Optimization with Machine Learning: Introduction
Optimization with Machine Learning: What is Machine Learning?
Machine learning (you can use for optimization purposes) is an application of artificial intelligence (AI) that allows systems to learn and improve from experience without being explicitly programmed automatically. Machine learning focuses on developing computer programs that can access data and use it to learn for themselves. The process of learning begins with observations or data, such as examples, direct experience, or instruction, to look for patterns in data and make better decisions in the future based on the examples that we provide. The primary aim is to allow the computers to learn automatically without human intervention or assistance and adjust actions accordingly.
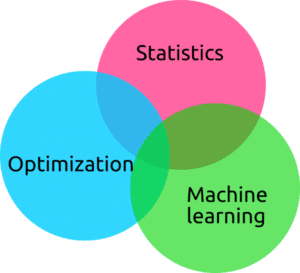
Figure 1. Statistics, Optimization, and Machine Learning.
What is Optimization?
The optimization process is a set of steps to find the best possible solution in the output of a process with the highest efficiency and the lowest cost. The optimization process depends on several factors, such as the nature of the process itself and the solution methods.
In industries, performance optimization is an integral part of product design. Optimizing a product is one of the most important stages of product production. In the past, trial and error strategies were used to produce more stable products with better performance. But today, with the development of technology and with the intention of reducing production costs, trial and error methods can not be appropriate and there is a need for more reliable methods to design and optimize products before the production stage. CFD tool is one of the most reliable methods today there are different software with different CFD methods available to engineers to design and analyze the model before making the real model and applying the desired optimizations.
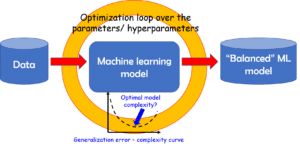
Figure 2. Optimization Loop Over the Parameters.
Using ANSYS, one can perform two types of Optimization. 1-Direct Optimization, 2-Indirect Optimization. These methods will result in the same answer but with different steps. Direct Optimization predicts the behavior of a system without any intermediary step. In contrast, indirect Optimization needs the data obtained by the RSM to provide the user with the correct mathematical function for predicting the system behavior.
DOE as a First Step of the Indirect Multiple Optimization in ANSYS Workbench
To quickly optimize the performance of systems with input variables, scientists have introduced the Design of Experiments (DOE) as a statistical technique. DOE can be used to reduce the cost of the designs by speeding up the design process and reducing product material and labor complexity. Designed Experiments are also powerful tools to achieve manufacturing cost savings by minimizing process variation and reducing rework, scrap, and the need for inspection. In fact, DOE is introduced as an efficient method that permits engineers to study the relationship between a multi-input variable and key output variables. Engineers use the DOE methods when they want to determine whether a factor, or a collection of factors, has an effect on the response, to determine whether factors interact in their effect on the response, to model the behavior of the response as a function of the factors and, to optimize the response.
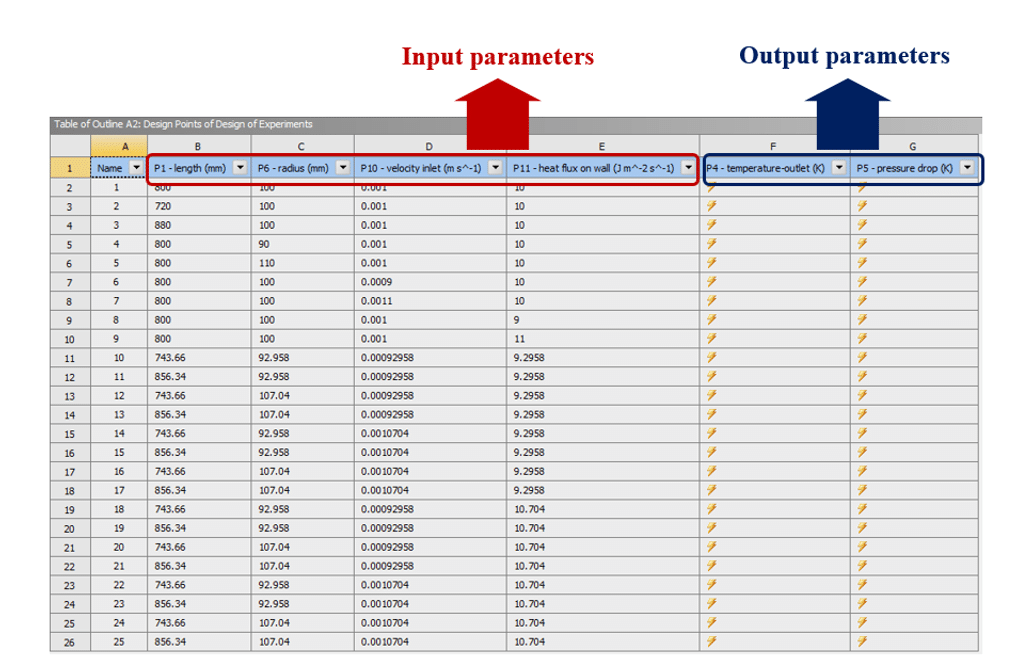
As was mentioned above, the purpose of producing a design of experiments environment is to divide the range of changes of factors or input parameters into different values from the minimum value to the maximum value based on a certain pattern or design; these values are called design points. Then a set of these definition values or design points for each of these input parameters are placed in different rows of a table, each containing a solution. In that row, Each of the input parameters with a specific value is located in the corresponding column, and these parameters simultaneously perform the solution process. Therefore, the result obtained in each solution shows the simultaneous and interacting effect of these values of input parameters or factors on the desired output parameters. Figure 1 shows an example of a table of design points of the design of experiments.
Example of DOE
in the example below, four parameters are input or independent parameters: length, radius, velocity inlet, and heat flux on the wall, and two parameters as output parameters Or dependent, including temperature outlet and pressure drop.
Figure 3. Example of DOE
Design of Experiment Types
There are several different methods to produce the design of the experiment’s environment. Thus, these methods determine the type of segmentation of change intervals related to each of the input factors or parameters. Each test design uses its method to indicate the number of design points and the type of point division.
These methods in the ANSYS Workbench environment are:
- Central Composite Design or CCD
- Box-Behnken Design or BBD
- Custom
- Custom + sampling
- Optimal space-filling design (OSF)
- Sparse grid initialization
- Latin hypercube sampling design (LHS)
Increasing the number of defined input variables will prolong the production time of the test environment and will also make it difficult to create an accurate response level because response levels depend on the relationship between input variables and output parameters. Naturally, The greater several defined input parameters, the more difficult the response levels can be to determine how these input variables will affect the output parameters. Therefore, we recommend that each method of producing the test environment uses as few input parameters as possible. Hence, there are limitations to determining the number of input parameters.
An Example
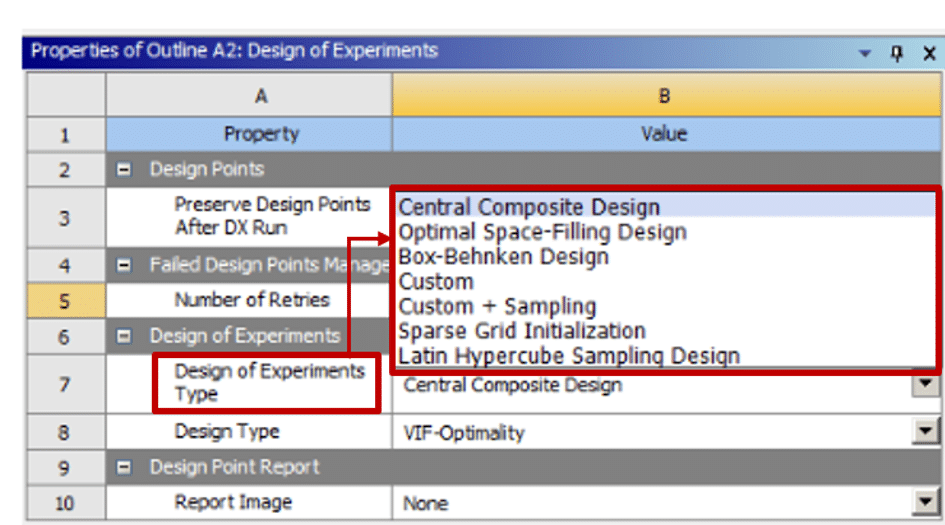
For example, the CCD, LHS, and the OSF method have a limit of up to 20 input parameters. Also, the BBD method has a limit of up to 12 input parameters. Now, suppose the number of input parameters of the definition exceeds the allowable limit. In that case, the system gives a warning message to reduce the input parameters, in which case users must disable some input parameters. So users should disable the less effective parameters. Sometimes it was difficult to determine the less essential parameters to disable. In this situations users should use the parameters correlation system to select the lower correlation parameters. The figure below shows the design of the type of experiment in the ANSYS Workbench software.
Figure 4. Design Of Experiments Types.
RSM as a Second Step of the Indirect Multiple Optimization in ANSYS Workbench
RSM is one of the most common experimental designs for optimization. It is a collection of mathematical and statistical techniques to:
- Generate knowledge in the experimental domain of interest
- Reliably estimate the experimental variability guarantee the adequacy between the proposed model and the experimental data
- Predict the response, as exactly and precisely as possible, in points within the experimental domain where no there are no experiments.
- Propose sequential strategies to carry out the experimentation with different alternatives according to the results obtained,
- Maintain high efficiency with respect to economical cost, time and any other practical limitations,
- Make the identification of outlier data easy
- Make the decision making possible under uncertainty conditions, reducing the ambiguity.
Clearly, RSM includes much more than model fitting and analysis of them. Indeed, RSM, broadly understood, has become the core of industrial experimentation.
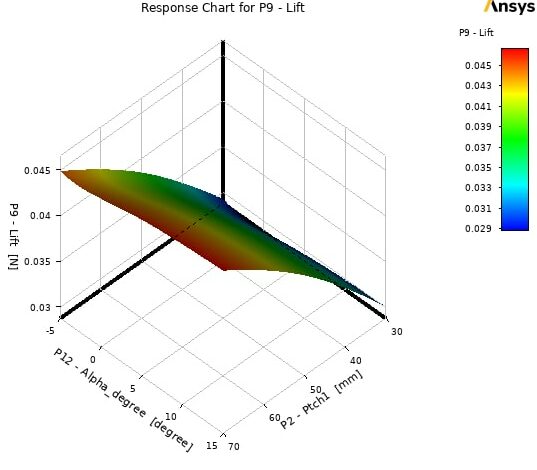
Figure 5. Example of Response Surface Using Genetic Aggregation Method
Types of RSM in ANSYS Workbench
In fact, Response surfaces are functions with different natures that can define any of the parameters or output variables in terms of input parameters or variables. In other words, response surfaces can obtain approximate values of the desired output variable or parameter at any point in the analyzed design space without performing a complete solution process.
Users must define several input firs. Software divides each input parameter into several sample design points in the definition of design space in the experimental environment. Therefore, a set of design points is created based on input parameters. The response surface based on the results of the solution process of each of the combinations of sample design points, using various methods, defines the most appropriate possible function to estimate the value of the desired output parameter based on the value of one or more selected input parameters.
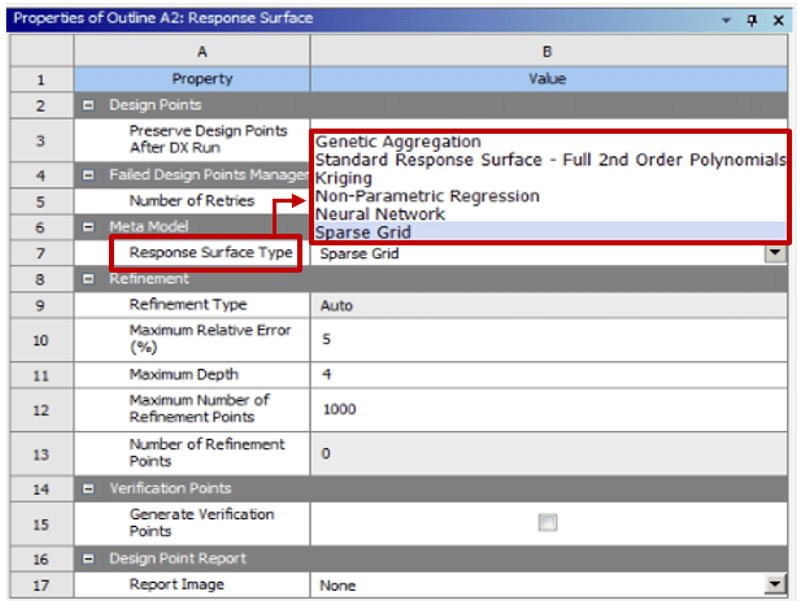
The response surface production mechanism in the ANSYS Workbench software optimization section has six different types:
- Genetic aggregation
- standard response surface – full 2nd order polynomials
- Kriging
- Non-parametric regression
- Neural Network
- Sparse grid
The figure below shows the various methods for generating response surfaces in the ANSYS Workbench software.
Figure 6. Types of Response Surface Methodology


Comments (0)