CFD Project Outsourcing
Outsource your CFD project to the MR CFD simulation engineering team. Our experts are ready to carry out every CFD project in all related engineering fields. Our services include industrial and academic purposes, considering the ANSYS Fluent software's wide range of CFD simulations. By outsourcing your project, you can benefit from MR CFD's primary services, including CFD Consultant, CFD Training, and CFD Simulation.
The project freelancing procedure is as follows:
An official contract will be set based on your project description and details.
As we start your project, you will have access to our Portal to track its progress.
You will receive the project's resource files after you confirm the final report.
Finally, you will receive a comprehensive training video and technical support.
What is the User Defined Function (UDF)?
A user-defined function, or UDF, is a function that you program that can be dynamically loaded with the ANSYS FLUENT solver to enhance the standard features of the code. For example, you can use a UDF to define your boundary conditions, material properties, and source terms for your flow regime and specify customized model parameters (e.g., DPM, multiphase models) and initialize a solution or enhance post-processing.
UDFs are written in the C programming language using any text editor, and the source code file is saved with a .c extension (e.g., myudf. c). One source file can contain a single UDF or multiple UDFs, and you can define multiple source files. UDFs are defined using DEFINE macros provided by ANSYS FLUENT. They are coded using additional macros and functions also supplied by ANSYS FLUENT that access ANSYS FLUENT solver data and perform other tasks.
Every UDF must contain the UDF.h file inclusion directive (#include “UDF.h”) at the beginning of the source code file, which allows definitions of DEFINE macros and other ANSYS FLUENT-provided macros and functions to be included during the compilation process. Note that values passed to a solver by a UDF or returned by the solver to a UDF are specified in SI units.
Source files containing UDFs can be either interpreted or compiled in ANSYS FLUENT. For interpreted UDFs, source files are interpreted and loaded directly at runtime in a single-step process. For compiled UDFs, the process involves two separate steps. A shared object code library is first built, and then it is loaded into ANSYS FLUENT. After being interpreted or compiled, UDFs will become visible and selectable in ANSYS FLUENT dialog boxes and can be hooked to a solver by choosing the function name in the appropriate dialog box.
- Are written in the C programming language.
- Must have an included statement for the UDF.h file.
- Must be defined using DEFINE macros supplied by ANSYS FLUENT to utilize predefined macros and functions supplied by ANSYS FLUENT to access ANSYS FLUENT solver data and perform other tasks.
- They are executed as interpreted or compiled functions.
- Are hooked to an ANSYS FLUENT solver using a graphical user interface dialog box.
- Use and return values specified in SI units.
A User Defined Function (UDF) is a function provided by the user of a program or environment in a context where the usual assumption is that functions are built into the program or environment. In SQL, a UDF is a function that is created by the user and not provided by the system. It allows the user to create a function to perform a series of actions and then call that function by its given name. In programming languages such as C++, Java, Python, etc., a UDF is a function created by the user to perform specific tasks that are not provided by the built-in functions.
How can UDF be applied in CFD simulation Engineering?
User-defined functions (UDFs) allow you to customize your CFD simulations in software like ANSYS Fluent. UDFs allow you to define new user-defined models that can be used to simulate processes that are not included in the standard Fluent solver.
Here’s a basic example of how a UDF can be applied in a CFD simulation:
#include “udf. h”
DEFINE_PROPERTY(cell_temperature, c, t)
{
real temperature;
/* Calculate the temperature of the cell */
temperature = C_T(c,t);
return temperature;
}
In this case, the UDF is used to define a new property (cell temperature) that can be used in the simulation. The function C_T(c,t) is used to get the temperature of the cell.
To use this UDF in your simulation, you would need to:
– Write your UDF in a text file with a .c extension.
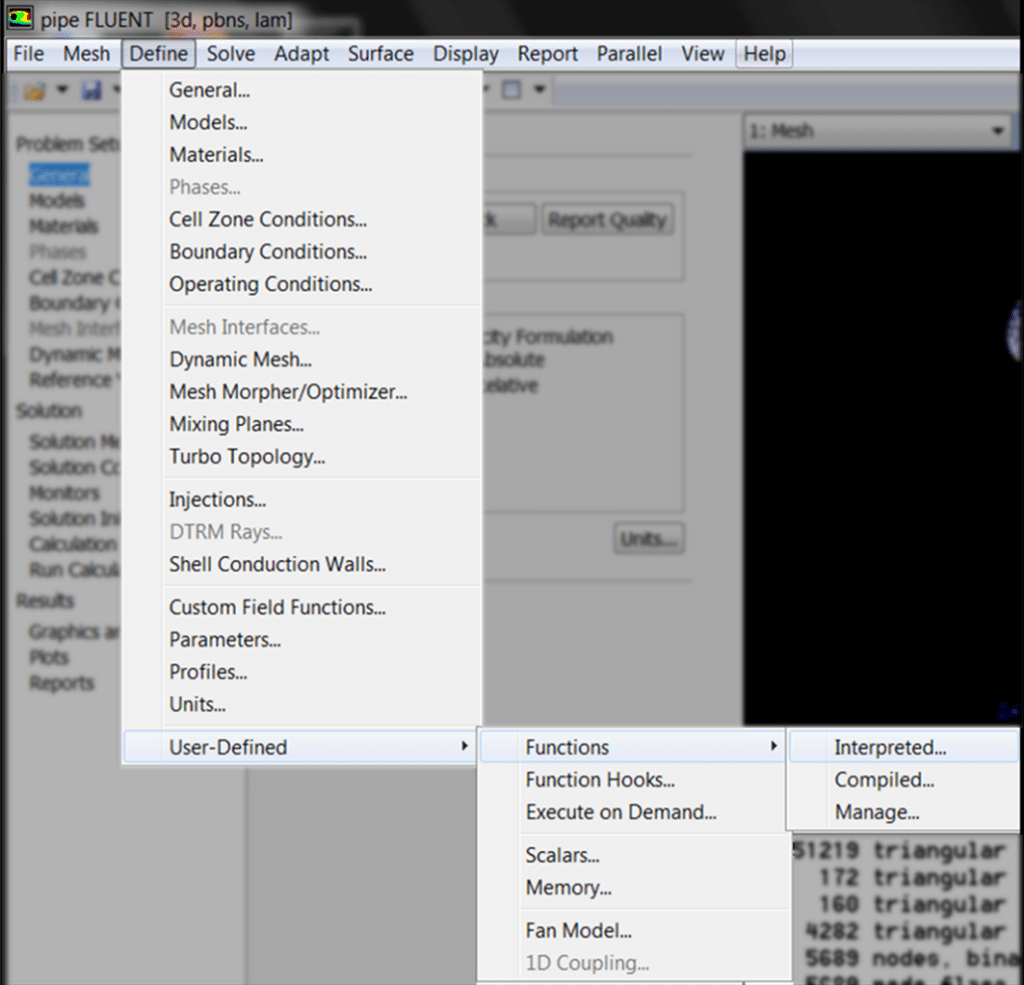
– Load the UDF into Fluent using the Define > User-Defined > Functions > Compiled… menu.
– Compile the UDF using the same menu.
– Hook the UDF to your simulation using the Define > User-Defined > Function Hooks… menu.
MR CFD services in the UDF Simulation for Engineering and Industries
With several years of experience simulating a wide range of problems in various CFD fields using Fluent software, the MR-CFD team is ready to offer extensive modeling, meshing, and simulation services. The MR-CFD team is an expert in developing C codes for enhancing the features implemented inside the ANSYS Fluent software (udf) to perform your fundamental projects that are impossible to execute using the default Fluent solvers.
Our services are not limited to the mentioned subjects. The MR-CFD team is ready to undertake different and challenging projects—in which UDFs should be implemented—ordered by our customers. You can consult with our experts freely and without charge at first and then order your project by sending the problem details to us using the following address.
UDF (User-Defined Functions) simulation is just one of the many CFD (Computational Fluid Dynamics) services offered by MR CFD. CFD software’s UDF Simulation is a robust tool for altering and expanding the program’s predefined capabilities. Complex fluid dynamics issues, which cannot be solved by utilizing the software’s default tools, are frequently simulated by industries and technical sectors employing it.
MR CFD offers the following services:
– Consulting Services: MR CFD’s consulting services can assist you in resolving difficult fluid dynamics issues.
– User-Defined Function Development: The expert programmers at MR CFD can create UDFs tailored to your needs.
– Simulation Services: MR CFD offers comprehensive computational fluid dynamics (CFD) simulation services, including flow, heat transfer, and multiphase modeling.
– Training Services: To help you and your team become more proficient at simulation, MR CFD offers training sessions in CFD software and UDF development.
Macro Different Applications in UDFs
DPM-Drag Macro
Drag between Particles and Fluid CFD Simulation
Mass Transfer Macro
Evaporation and Condensation Rate CFD Simulation
Delta-T Macro
Time Step Control CFD Simulation
Source Macro
Momentum Source Term CFD Simulation
CG-Motion Macro
Reciprocating Motion CFD Simulation
Init Macro
Initial Temperature CFD Simulation
Prandtl-K Macro
Profile Macro
Pressure Profile CFD Simulation
Property Macro
Viscosity Relation CFD Simulation
UDF in ANSYS Fluent
UDF (User-Defined Functions) in ANSYS Fluent allows users to customize the software as per their requirements. Users can write their functions to perform specific tasks that are not available in Fluent by default.
Here is the basic structure of a UDF:
DEFINE_… (name, …)
{
/* Your code here */
}
In the DEFINE_… line, … is replaced by the type of UDF you’re creating (like EXECUTE_AT_END, PROFILE, etc.), the name is the name of your UDF, and … in the parentheses is where you put the arguments your UDF will take.
You can compile and interpret UDFs in Fluent. Here’s how:
– Interpreting UDFs
– Go to Define -> User-Defined -> Functions -> Interpret…
– Browse and select your UDF file, then click OK to interpret.
– Compiling UDFs
– Go to Define -> User-Defined -> Functions -> Compiled…
– Click Add… to add your UDF files, then click Build to compile.
Remember, always check the console for any errors or warnings when interpreting or compiling UDFs.
UDF MR CFD Projects
In CFD, UDFs are often used to customize the software according to the specific requirements of a project. These functions can be used to specify custom boundary conditions, material properties, and source terms or even to implement custom models.
Here are some example UDF projects:
– Custom Boundary Conditions: You might have a boundary condition that isn’t included in your CFD software. You can write a UDF to implement this. For example, a sinusoidal velocity inlet condition.
#include “udf. h”
DEFINE_PROFILE(inlet_velocity, thread, position)
{
face_t f;
real t = CURRENT_TIME;
begin_f_loop(f, thread)
{
F_PROFILE(f, thread, position) = 10.0*sin(2.0*M_PI*t);
}
end_f_loop(f, thread)
}
– Custom Material Properties: If you’re working with a material that isn’t in your software’s material library, you can use a UDF to specify its properties. For example, a temperature-dependent viscosity.
#include “udf. h”
DEFINE_PROPERTY(cell_viscosity, cell, thread)
{
real temperature = C_T(cell, thread);
return 0.001*exp(-0.02*temperature);
}
– Custom Source Terms: You can use a UDF to add a source term to your equations. For example, a heat source that varies with time.
#include “udf. h”
DEFINE_SOURCE(cell_heat_source, cell, thread, source, eqn)
{
real t = CURRENT_TIME;
source = 1000.0*sin(2.0*M_PI*t);
return source;
}
Remember, all these codes should be compiled in the software before running the simulation. Also, the correct UDF should be hooked to the correct boundary condition or property.
UDF to define a mass transfer between water and vapor based on surface evaporation
Productivity estimation of a single-slope solar still: Theoretical and numerical analysis
With the help of the ANSYS Fluent software, the current problem attempts to model the process of surface evaporation that occurs within a solar desalination system. This CFD project is carried out, and an investigation using CFD is carried out. The material in this simulation was taken from a reference paper titled “Productivity estimation of a single-slope solar still: Theoretical and numerical analysis,” and the findings of this simulation are compared and validated with the results that were found in the reference article. In a broad sense, evaporation is a surface process that can take place at any temperature on the surface of a liquid. The purpose of this simulation is to create a single-slope solar still that contains a specific volume of water at a specific elevation.

At the conclusion of the solution process, two-dimensional contours were obtained. These contours were related to temperature, velocity, and the rate of mass transfer between the two phases (surface evaporation rate). Other variables included air volume %, liquid water volume fraction, and water vapor volume fraction. The contours allow us to see that the water surface in the solar still chamber dries up over the course of some time. Because of this, some of the space inside the chamber that is located above the water’s surface is taken up by water vapor.
The results shown in Table 3 of the study above were used as the basis for the Validation of the current simulation. The quantity of surface evaporation rate that occurred in each of the two simulations was compared and validated using the model evaporation rate that was supplied in the research. The maximum value of the mass transfer rate between the two phases of liquid water and water vapor is equal to this value of the evaporation rate, which indicates the maximum value.
In the first scenario, the temperature of the glass is equivalent to 30 degrees Celsius. In the first scenario, the temperature of the water is equivalent to 40 degrees Celsius. In the second scenario, the temperature of the water is equal to 50 degrees Celsius, while the temperature of the glass is equal to 40 degrees Celsius.
Solar Desalination Considering Surface Evaporation CFD Simulation, ANSYS Fluent Training
Through the use of the ANSYS Fluent program, we will be simulating the surface evaporation that occurs during solar desalination. This CFD project is carried out, and an investigation using CFD is carried out. In this simulation, we construct a straightforward solar still by arranging tilted glass plates in a specific pattern. Solar rays are able to penetrate the glass and make it to the surface of the water contained within the system. When the water’s surface is heated, it causes the water to evaporate.
The created steam is pure, and the impure materials have settled out at the system’s bottom. When this pure steam collides with the inside surface of the angled glass, condensation occurs as a result of the loss of heat. The slope that was chosen for the glasses makes it so that the drops of distilled water glide across the surface of the glass and are directed toward the outflow of the system.
The rate at which water turns into steam can be specified by using a UDF function. This equation, which is employed in this function, is equivalent to the rate at which water evaporates from the earth’s surface. Evaporation that takes place at the water’s surface is distinguished by the fact that it is the only type of evaporation that may take place at temperatures that are lower than the temperature at which water is saturated. Furthermore, boiling is a volumetric process that can only take place when the temperature is high enough to reach saturation.
Following the completion of the problem, the temperature contours, pressure contours, and volume fraction contours for each water, air, and vapor phase have been produced. The findings demonstrate, quite accurately, that the water on the surface will begin to evaporate with time. Because of this, the level of the water has been dropping over time.
In addition, the findings indicate that the temperature of saturation is not necessary for the occurrence of the mass transfer. Therefore, one can conclude that the mechanism for surface evaporation that is based on the definition of the UDF has functioned appropriately.
Solar Water Desalination by Species Transport, 2-D
The ANSYS Fluent program for this current study analyzed the performance of a solar-still thermal desalination unit. The most recent iteration of this design features a compact enclosure that tapers to a glass surface at its summit. The generated vapor collides with the cool surface of the glass, which causes it to go through the distillation process. The hot vapor distillation process results in the production of clean water, which is then discharged as it goes down the slope of the glass plate.

The heat from the sun is able to penetrate the glass and reach the water’s surface inside the enclosure, which results in surface evaporation (using a UDF that is designed for surface evaporation). This method does not imitate the flow of distilled water and instead presumes that there is a mixture of air and vapor inside the chamber interior.
In point of fact, when the simulation first starts, the area inside the chamber is solely filled with air; the bottom plane of the chamber is thought to be the surface of the water, and given that water evaporates off the surface, it is presumed that the surface is made up of vapor. In addition to this, it is presumed that the sloping plate that the steam collides with is made entirely of vapor. Therefore, the water and air mass fraction contours represent the evaporation produced by the device in its entirety.
Solar Still (3-D) by Species Transport Model, ANSYS Fluent CFD Simulation Training
The ANSYS Fluent program for this current study analyzed the performance of a solar-still thermal desalination unit. The current prototype is made up of a compact space that has a glass surface that slopes upward at the very top. The heat from the sun travels through the glass to the water’s surface in the enclosure, where it creates surface evaporation (using a UDF, which stands for universal design feature for surface evaporation). The generated vapor collides with the chilled surface of the glass, where it then goes through the distillation process. The hot vapor distillation process results in the production of clean water, which is then discharged as it goes down the slope of the glass plate.
Two-stage Water Desalination Equipment CFD Simulation
Desalination and distillation of water are two methods that are frequently utilized for the purpose of eliminating pollutants from water. These impurities include salts, minerals, and other contaminants. In this procedure, water is heated to its boiling point, which causes the water to evaporate, leaving behind any pollutants that may have been present in the water.
After that, the water vapor is turned into a liquid, which ultimately results in pure water. Distillation is a very efficient way of purifying water because it can get rid of even the tiniest particles that other purification processes might miss. The process of distillation and desalination can be carried out with a wide variety of apparatus, ranging from straightforward pot stills to intricate distillation systems designed for use on an industrial scale. The method is useful in a variety of contexts, including the production of drinking water, pharmaceuticals, and industrial chemicals, among other things.
In order to represent the mass transfer that occurs due to surface evaporation, a user-defined function (UDF) was connected to the Fluent source code. This was necessary because this process was not included in the base code. The data and contours that were obtained make it abundantly evident that the pressure distribution inside the system trays is stratified in nature. This is because the water column inside the trays exerts a hydrostatic pressure, which causes this effect.
Additionally, as can be seen in the temperature contour, the bottom surface has a higher temperature than the rest of the surface, which causes the molecular motion route of the water liquid to increase. Because of this increase in molecular motion, the kinetic energy of water molecules will also increase, which, in turn, will allow the process of surface evaporation to proceed at a quicker rate.
In addition, by inspecting the mass transfer rate contour, one is able to ascertain the quantity of the vapor that was produced. After coming into contact with the cold sloped plates, the exact amount of water that had been vaporized will condense. Therefore, the amount of water that has been vaporized and is contained within the trays is equivalent to the amount of water that has been distilled and is exiting the system through the outlet borders.
UDF to define breathing flow rate
COVID-19 Transient Breathing in the Operating Room
The challenge uses the ANSYS Fluent software to model the COVID-19 Transient Breathing in the Operating Room airflow from the mouth of a patient. This CFD project is carried out, and an investigation using CFD is carried out. In point of fact, in this particular instance, a specific operating room has been built, and it is outfitted with equipment for ventilation and air conditioning. On the other hand, as the patient inhales and exhales, he takes in oxygen and releases carbon dioxide into the atmosphere.

It is the job of the ventilation systems and air conditioners that are built into the room’s ceiling and floor to circulate fresh air throughout the space and then to direct that air out of the room through the side pores and into the surrounding environment.
In addition, the undiluted fraction, or UDF, is defined as the input flow rate from the oral area. However, for the sake of this model, it is believed that the mouth is a constant source for both inhaling and expelling air. In actuality, during breathing, the mouth constantly takes in air, and it is exhaled through the nose.
As a result, the terms “inhalation” and “exhalation” ought to be defined for the oral region. Therefore, a UDF is utilized in order to determine the velocity of the airflow that is entering the room from the mouth into the inside of the space. When our objective is to analyze the behavior of the particles from a Lagrangian and discrete point of view, we make use of the discrete particle method (DPM).
In the current configuration, the patient’s mouth serves as the point of origin for the particle that carries the exhaled airflow into the interior space of the operating room. This airflow contains oxygen, nitrogen, and carbon dioxide. When the mode for tracking unsteady particles is selected, the behavior of the discrete airborne particles is altered over time. Therefore, in the presence of air conditioning and ventilation equipment in the operating room, we can perform a time-efficient analysis of the CORONAvirus particle in a short amount of time.
UDF to define the reciprocating motion
Oscillatory Wave and its Effect on Fin Motion, ANSYS Fluent CFD Training
Using the ANSYS Fluent software, the current challenge attempts to model the rotating motion of a fin as it moves through a two-phase flow field while being affected by an Oscillatory Wave flow that has been constructed. This CFD project is carried out, and an investigation using CFD is carried out.
Additionally, a user-defined function, or UDF, specifies the reciprocating motion of the scaffold wall that creates the waveform within the domain. This motion is what causes the domain to oscillate. Following the completion of the solution process, we were able to get two-dimensional contours that were associated with pressure, velocity, the volume fraction of liquid and air, and pathlines at the time t=2s.
Additionally, the location of the fin in terms of its x and y coordinates, as well as its angle placement at various periods, can be saved as a data set in a text file if the write motion history option in the six degrees of freedom definition section is enabled. The data graph presents the angular shifts that occurred in the position of the fin throughout the course of 22.5 seconds.
UDF to define the temperature profile
The current issue is a modeling challenge that involves heat transfer and airflow around a radiator. The current simulation was created with the help of the ANSYS Fluent software. It was based on the research published in the article titled “CFD Study on Thermal Performance of Radiators in a Power Transformer: Effect of Blowing Direction and Offset of Fans.”
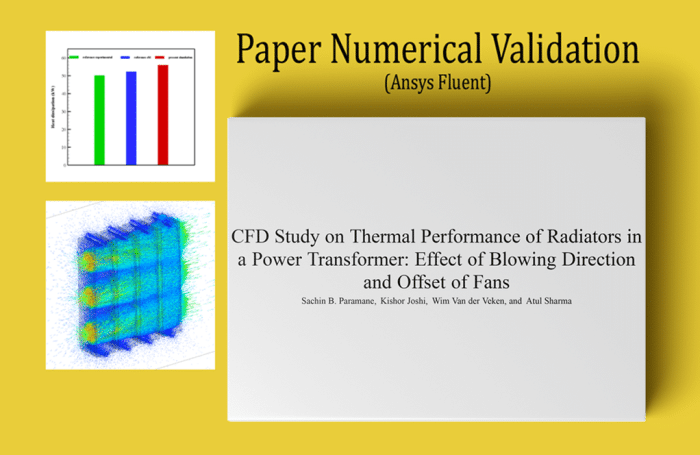
This temperature profile of the plates on which the UDF is written is obtained in such a way that the temperature of the hot water entering the radiator from the upper part is initially assumed to be 366.15 K, which, after flowing into the pipes and downward moving, heat exchange with the ambient airflow, and reaches its lowest temperature value of 353.15 K in the lower part. The UDF is written in such a way that this temperature profile of the plates is obtained. The movement of the flow in the vertical direction is primarily to blame for these temperature shifts.
At the completion of the process of finding a solution, we will calculate the net heat loss rate from the radiator plates to the airflow, and we will compare this rate with the reference document for Validation. In order to make this comparison, we will be using Figure 5 from the article as well as the ONAF mode (which features heat transmission via forced convection). We are able to assume that the rate of heat loss from the radiator body to the environment is proportional to the difference in air temperature between the intake and the output of the radiator. Therefore, we are able to determine the difference in heat transfer rate between the input and output boundaries by utilizing the Report and selecting the Total Heat Transfer Rate option from the Flux Report section. This allows us to compare the heat transfer rates of the input and output boundaries. In addition, once the process of finding a solution has been completed, we are provided with two-dimensional and three-dimensional contours of temperature, velocity, and pressure, in addition to three-dimensional path lines and velocity vectors.
UDF to define the nucleation and growth rates in PBM analysis
Population Balance Model for Nucleation, PBM Tutorial
The current issue makes use of the ANSYS Fluent software to do a simulation of the manufacturing process for calcium oxalate, which is based on the Population Balance Model (PBM). This CFD project is carried out, and an investigation using CFD is carried out. During the course of this research, the process of producing calcium-oxalate will first be modeled. Then, the PBM will be studied by making use of the production, growth, and displacement of production particles.
From one tube, only a mixture of water with calcium is injected, and from the other tube, only a stream of water is injected with oxalate. This occurs because the mechanism of the system that was investigated is designed in such a way that the flow of water carrying calcium and oxalate enters a chamber through two pipes.
It is feasible to investigate the behavioral pattern of particles that are created in the secondary phase once the process of converting materials from the primary phase into the secondary phase, as well as the occurrence of a chemical reaction, have both been defined. The population balance model (PBM) is able to investigate the behavior of created particles and provide accurate predictions regarding the population or density of particles of a certain size range.
There is a progression of events that takes place in an environment when many particles are created. These events include the formation of the first particle nucleation, the growth of formed particles, the aggregation of several small particles, and the fragmentation of a large particle into smaller particles.
In addition, it is expected that neither aggregation nor breakage will take place throughout this simulation; rather, only the processes of nucleation and growth will take place. Both the nucleation rate and the growth rate are defined with the help of a UDF function. In addition, the equations describing the flow of the fluid are solved by employing the laminar model.
Following the completion of the simulation, two-dimensional findings pertaining to the mass fraction of the already existing chemical species are obtained for a variety of bin numbers at a variety of timeframes. For example, a two-dimensional contour is formed that is connected to the volume fraction of the primary phase (which includes water, calcium, and oxalate), as well as the volume fraction of the secondary phase (calcium-oxalate).

After that, the table that pertains to the sizes of each definition category (bin) is shown to the reader. In the classification of particle sizes, there are 48 different categories, with the smallest being 5e-7m at bin-47 and the largest being bin-0. In addition to this, the bar graph that depicts the number density is presented in terms of the bin number.
That is, how many particles that have the necessary volume (according to the size of each bin) are contained within the intended area Number density is a ratio that represents the number of particles that are present in a given volume. In the end, we are able to create contours in two dimensions that show the volume percentage of calcium-oxalate that was produced in each of the different bins. According to the findings, the amount of material produced becomes significant, beginning somewhere around bin 30 and continuing.
This indicates that the volume of particles produced in the categories ranging from bin 0 to bin 30 is negligible and cannot be detected by the human senses. Therefore, we are able to conclude that the generated particles are formed and grow in smaller volumetric sizes (between bin-47 and bin-30) but are not evident in greater volumetric sizes. This is because of the results of the previous experiment. The Population Balanced Model Training Course has reached its fourth and final installment with this video.
UDF to define the temperature-dependent viscosity
Using the ANSYS Fluent software, the project attempts to mimic the solidification and melting of a phase change material that is contained within a shell and tube heat exchanger. A numerical simulation was carried out based on the reference article [Experimental and computational evolution of a shell and tube heat exchanger as a PCM thermal storage system], and the results were compared and validated with the results that were found in the publication. This was done in order to ensure that the results of the numerical simulation were accurate.
The findings that are presented in the paper are derived from both experimental and computational modeling. In a broad sense, phase change materials are materials that include organic compounds and can take in and store significant quantities of latent thermal energy.
Thermal energy storage in these materials is achieved during the phase change process (solid phase to liquid or vice versa). This means that when the material changes phase from solid to liquid, it absorbs heat from the surrounding environment (which causes cooling of the environment). When the material changes from liquid to solid, it returns heat to the environment (which causes heating of the environment).
Additionally, the viscosity of the phase change material is temperature dependent, and it is specified as an exponential function that takes the form of a UDF. This function is based on the temperature of the material. When the process of finding a solution is finished, a graph of the temperature changes that occur in the section of the shell that contains the phase change material is obtained by basing it on the time that elapses during the entire melting process.
The temperature changes depicted in this picture are validated by comparing them to the graphic found in Figure 8 of the reference article. The results of both the experimental work and the numerical CFD simulations are included in the graph that is presented in the article.
The findings indicate that the outcomes of the currently running numerical simulation have an acceptable level of accuracy when compared with the outcomes of the numerical and experimental work presented in the paper. In addition to this, two-dimensional and three-dimensional contours that are connected to the pressure, temperature, and liquid mass fraction have been obtained.
UDF to define pulse velocity and pulse pressure
Lumen Blood Vessel (FSI & Non-Newtonian), CFD Simulation Ansys Fluent Training
In the context of this research, a simulation of a Lumen Blood Vessel (FSI and Non-Newtonian) has been carried out, and the results of the simulation have been analyzed with the assistance of the ANSYS Fluent program. This CFD project is carried out, and an investigation using CFD is carried out.
When it comes to the input boundary condition, we have used UDF to define the pulse velocity, and when it comes to the outlet boundary condition, we have used UDF to describe the pulse output pressure. When the process of finding a solution is complete, the resulting contours in three dimensions are connected to wall displacements and von Mises stresses. As can be observed, the circulation of blood within the vessel causes the walls of the vessel to be subjected to stress.
Blood Vessel (FSI) with the Pulse Velocity, CFD Simulation Ansys Fluent Training
In this project, which has been carried out with the Ansys Fluent program, a blood vessel that has a wall is simulated, and the displacement of the wall can also be seen. We defined the pulse velocity by utilizing UDF as the input variable and the atmospheric pressure was the output variable. Inside of the fluent was where this FSI simulation was carried out.
After running the simulation, we are able to evaluate the velocity and pressure contours inside the vessel. In addition, we are able to investigate the stresses and displacements that were caused in the vessel wall as a result of the Force that was applied by the blood.
Numerical investigation of blood flow in a deformable coronary bifurcation and non-planar branch
The research article titled “Numerical investigation of blood flow in a deformable coronary bifurcation and non-planar branch” does an in-depth analysis of the pulsatile flow of blood in a coronary bifurcation that contains a non-planar branch using computational methods. In order to produce a more realistic study, it has been assumed that the wall is compliant.

The impact of non-Newtonian blood, compliant walls, and various bifurcation angles on the properties of hemodynamic flow were investigated. With the help of the Carreau-Yasuda model, we were able to replicate the shear-thinning of blood. Due to the fact that atherosclerosis is more common in bifurcations, the current research concentrated mostly on the flow characteristics that are found in these areas. In addition, because regions with low shear stresses are more likely to develop stenosis, these regions were singled out for investigation.
The pulsative velocity of the blood at the inlet face is depicted in the accompanying picture. At the same time, the relevant equation of motion is derived with the help of MATLAB software and implemented in the Fluent platform by an appropriate UDF.
The figure shown in Figure 6 of the article was employed for the purpose of validating the present results of the numerical simulation. This graphic illustrates the wall shear that exists within Coronary’s walls. The distance from the point of bifurcation is represented along the X-axis of the diagram. The model’s confines or limits. The amount of wall shear stress that is reported in this article was measured along Line 3, which can be found in Figure 1 of the article. In the image gallery, you can see a comparison of the outcomes of the currently running numerical simulation with the outcomes of the numerical work that was done for the article.
UDF to determine variable velocity and attack angle
FSI Analysis of Airflow around an Airfoil Vibration
The current issue is a Fluid Solid Interaction (FSI) Analysis of Airflow around an Airfoil performed in the ANSYS Fluent software. This method analyzes the airflow around the airfoil. During this simulation, a circular computational domain of airflow will be built. This will be done so that an airfoil can be placed within this region. Because of the high speed at which this airfoil is traveling, the flow of air collides with its body, which causes a force to be applied to it.
In this model, defining the boundary of the inner surface around a circle that is part of the airfoil as fixed support is distinguished from creating a circular hole inside the airfoil itself. This barrier or surface is always impacted by the interaction with the flow of the fluid, but it does not change position or deform as a result of this interaction.
However, because the contact of the fluid flow with the airfoil body causes the two sides of the airfoil to be displaced, these boundaries need to be described as displacement. In order to accomplish this, we will need to define a data transfer from the model wall in the fluent software to the same model wall in the transient structural program as Force. This indicates that the fluid flow around the airfoil wall strikes the wall, causing it to be subjected to a force by virtue of its proximity to the wall.

At this boundary, the velocity inlet boundary condition is utilized, which means that both the airflow velocity and the airflow directions are able to vary as a function of the passage of time. The fact that the direction of the airflow is changeable indicates that the angle of attack of the airfoil will change over time.
As a result, the UDF was utilized in order to ascertain the variable velocity as well as the varied attack angle. Following the completion of the solution process, we acquire the results in the software programs known as Fluent and Transient Structural. On the outer surface of the airfoil, we describe deformation, strain, and stress contours using software that analyzes transient structural behavior.
These contours correspond to the very last second of the simulation, which lasted 0.32 seconds. On the symmetrical surface of the computational region surrounding the airfoil in question, the fluent program displays two-dimensional outlines that are related to the variables of velocity, pressure, and temperature. These contours also correlate to the final second of the simulation, which was 0.32 seconds. A figure depicting the changes in drag coefficient and lift coefficient that are imparted to an airfoil over time in 0.32 seconds is also presented here.
UDF to define the movement as a Rigid Body
Self-Propelled Submarine Motion, Dynamic Mesh (6-DOF)
Through the use of the dynamic mesh approach and the ANSYS Fluent software, the current problem attempts to replicate the movement of a self-propelled submarine while it is floating on the water surface. The Dynamic Mesh Training Course is currently in its fourth chapter, and this product is that chapter. During this simulation, a computational domain that takes into account air and water at a particular level is developed. This is done so that an autonomous submarine can float on the surface of the sea.
It has also been possible to describe the type of dynamic mesh behavior using six degrees of freedom (six-DOF). This indicates that the model can move and relocate itself at six different degrees. The properties of six degrees of freedom, including the mass and the moment in various directions for this model, are specified as a UDF. These properties include the mass and the moment.
At the conclusion of the process of finding a solution, we are presented with contours in two dimensions that are related to the velocities and volume fractions of each air and water phase in the floating submarine zones. In the final second of the simulation process, we exhibit these outlines in two different planes: the X-Y plane and the Y-Z plane. In addition to this, we present a diagram that illustrates the amount of transitional and rotational movement that the submarine exhibited along each of the three axis (X, Y, and Z).
Floating Vessel Motion in Water by Dynamic Mesh, ANSYS Fluent Training
Using the dynamic mesh approach and the ANSYS Fluent software, the current issue attempts to model the movement of a floating vessel while it is immersed in water. A computational domain consisting of water and having a specific height level is designed for this simulation. A floating vessel is placed on the surface of the water.
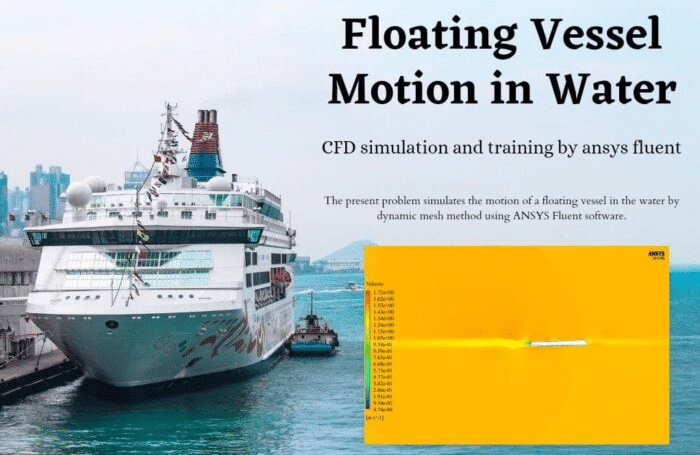
At the conclusion of the process, two-dimensional contours related to the pressure on the floating vessel and two-dimensional contours related to the velocity and volume fraction of each air and water phase are acquired in the areas around the floating vessel. These contours are obtained in the areas around the floating vessel.
These contours represent the very last second when the simulation was run. Also acquired is the graph that depicts the amount of vertical movement of the vessel along the z-axis in relation to the passage of time, as well as the graph that depicts the amount of rotation angle of the floating vessel about its central axis in relation to the passage of time along the y-axis.
The angular and transitional spatial changes that occurred during the course of 7 seconds are depicted by these graphs. Since it is obvious that the amplitude of the oscillation of the changes in the two graphs reaches its minimum in the seventh second, we can state that the rotational and the transition motion are both damped after this point in time.
UDF Application in Industrial Companies
User-Defined Functions (UDFs) are custom functions that extend the capability of computing platforms. They are used to encapsulate a sequence of operations into a single unit. Industrial companies often use UDFs to automate repetitive tasks, perform complex calculations, and integrate third-party software.
Here are a few examples:
– Data Processing: Industrial companies often deal with large volumes of data. UDFs can be used to process this data in a way that is specific to the company’s needs. For example, a UDF might be used to calculate the average temperature of a machine over a specific period.
def average_temperature(data):
return sum(data) / len(data)
– Integration with Third-Party Software: UDFs can be used to integrate third-party software into a company’s existing systems. For example, a UDF might be used to pull data from an external API and format it for use in a company’s database.
def get_data_from_api(api_url):
response = requests.get(api_url)
data = response.json()
return format_data(data)
– Automation of Repetitive Tasks: UDFs can be used to automate repetitive tasks. For example, a UDF might be used to generate a weekly report on machine performance.
def generate_report(data):
report = create_report(data)
send_report(report)
Remember, the application of UDFs will vary greatly depending on the specific needs and systems of the industrial company. The above examples are quite generic and might not apply to every situation.
MR CFD Industrial Experience in the UDF Field
Some examples of UDF industrial projects recently simulated and analyzed by MR CFD in cooperation with related companies are visible on the MR CFD website.
You may find the Learning Products in the UDF CFD simulation category in the Training Shop. You can also benefit from the UDF Training Package, which is appropriate for Beginner, Intermediate, and Advanced users of ANSYS Fluent. Also, MR CFD is presenting the most comprehensive UDF Training Course for all ANSYS Fluent users from Beginner to Experts. Get more familiar with UDF concepts.
Our services are not limited to the mentioned subjects. The MR CFD is ready to undertake different and challenging projects in the UDF modeling field ordered by our customers. We even carry out CFD simulations for any abstract or concept Design you have to turn them into reality and even help you reach the best strategy for what you may have imagined. You can benefit from MR CFD expert Consultation for free and then Outsource your Industrial and Academic CFD project to be simulated and trained.
By outsourcing your Project to MR CFD as a CFD simulation consultant, you will not only receive the related Project’s resource files (Geometry, Mesh, Case, and Data, etc.), but you will also be provided with an extensive tutorial video demonstrating how you can create the geometry, mesh, and define the needed settings (preprocessing, processing, and postprocessing) in the ANSYS Fluent software. Additionally, post-technical support is available to clarify issues and ambiguities.


