Arterial Occlusion CFD Simulation, ANSYS Fluent Tutorial
$40.00 $20.00 Student Discount
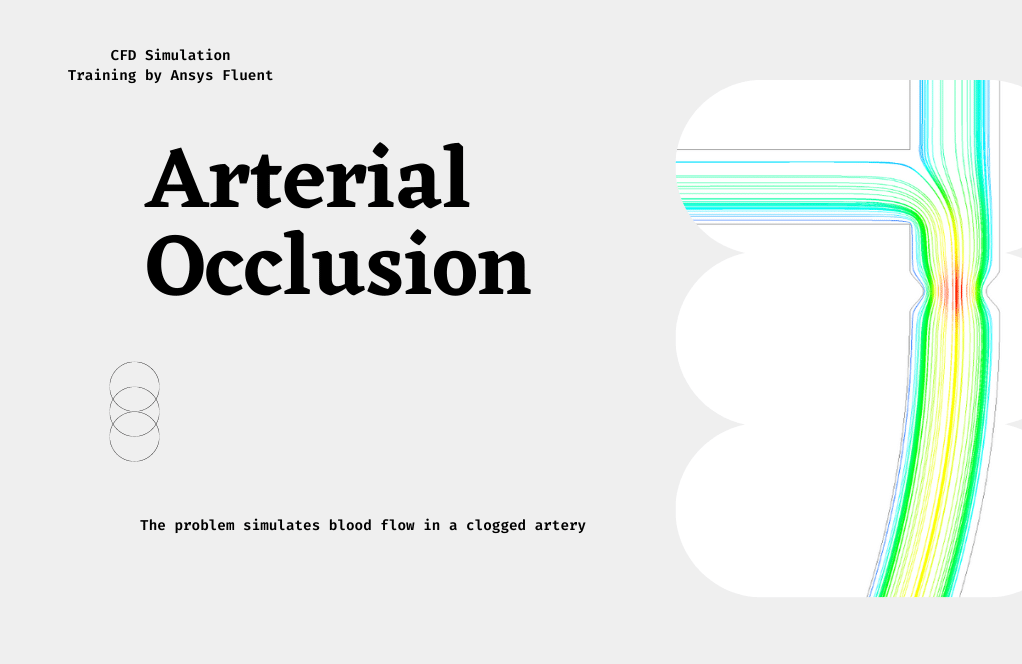
- The problem numerically simulates arterial occlusion considering blood using ANSYS Fluent software.
- We design the 2-D model by the Design Modeler software.
- We Mesh the model by ANSYS Meshing software.
- The mesh type is Structured, and the element number equals 85222.
- We define a curve line function to draw the stenosis of the vessel branch.
To Order Your Project or benefit from a CFD consultation, contact our experts via email (info@mr-cfd.com), online support tab, or WhatsApp at +44 7443 197273.
There are some Free Products to check our service quality.
If you want the training video in another language instead of English, ask it via info@mr-cfd.com after you buy the product.
Description
Description
This problem simulates arterial occlusion considering blood by ANSYS Fluent software. We perform this CFD project and investigate it by CFD analysis.
In this project, a vessel with two branches is modeled. The fluid used in the simulation process is blood, which has a density of 1060 kg/m3 and a viscosity of 0.35 kg/m.s. There is a stenosis in the middle of the vessel. A curvature line function has been used to define and plot the vessel’s stenosis.
This simulation aims to investigate the behavior of the blood passing through this stenosis. The mass flow rate of the blood flow to the artery from both inlet branches is 0.002385 kg/s, and the vessel wall is assumed to be static.
The geometry of this project is designed in the ANSYS design modeler and is meshed in ANSYS meshing. The mesh type is structured, and the element number is 85222.
Arterial Method
For the geometry of the vessel, a curve line function was used to plot the stenosis of the vessel branch. This function represents the sum of the points x and y that make up a curvature line obtained from the relation ‘‘y=0.0002475cos((πx)/0.001)’’.
For example, the curve is assumed to be 30% of the vessel’s congestion; This means that the ratio of the diameter of the vessel in the area with clogging to the diameter of the vessel is 0.7.
Percentage of clogging in the vessel changes to compare the behavior of the fluid in different states. The changes in the percentage of clogged arteries are 30%, 40%, 50%, 60%, 70%, 80% and 90%, respectively.
Arterial Conclusion
After simulation, 2D contours of pressure and velocity, as well as 2D pathlines and vectors, are obtained. The velocity contour indicates that the maximum velocity value occurs exactly at the stenosis point; Because the cross-section of the fluid reaches a minimum.
The pressure contour shows that the pressure of the fluid decreases after passing through the stenosis and its value is less than the pressure at the inlet of the two branches.
Also, the plots of pressure, velocity, and pressure drop according to the percentage of clogged arteries are presented. According to the plots, as the percentage of clogged arteries increases, the pressure drop of blood increases, and the velocity of blood passing through the clogged area also increases. This is because the high percentage of clogging indicates more obstruction of the vessel path.


Myrtie Ferry –
How does the simulation model the blood flow in the occluded artery?
MR CFD Support –
The simulation uses the Realizable k-epsilon turbulence model to simulate the turbulent nature of the blood flow.
Dr. Natalia Howe V –
Really great
Bruce Adams –
Hello, Is the modeling done in Newtonian or non-Newtonian?
MR CFD Support –
Hi dear friend
Thanks for visiting our site
The working fluid in this simulation is the blood that has been simulated non-Newtonian.
Hertha Jacobs –
Can you explain how to verify that the simulation correctly predicts the physics of blood flow through different levels of arterial occlusion?
MR CFD Support –
Verification in this complex simulation can be conducted by comparing the simulation results with experimental data or established analytical solutions when available. Another method involves conducting a mesh independence study to ensure that further refinement of the mesh does not significantly change the results. Lastly, assessing the quality of the boundary conditions and the input parameters for their physiological relevance is essential for a realistic simulation.
Mr. Mathew Jerde Sr. –
The tutorial description is fantastic. The examination of different degrees of arterial occlusion and their impact on blood flow and pressure was extremely informative. The step-by-step approach in simulating and analyzing the stenosis in the artery was easy to follow, and the final results were clearly significant for medical research and CFD applications in biomedical engineering. Great job on creating such a helpful and thorough CFD tutorial!
MR CFD Support –
Thank you so much for your kind words and for your acknowledgment of the details provided in the tutorial! We are glad to hear that the tutorial was informative and easy to follow for you. It’s our pleasure to contribute to the understanding of such crucial medical applications with our CFD simulations. We appreciate you taking the time to review our product and we are happy to know that it proved to be significant for your research and studies. If there’s anything more we can help with, please let us know!
Nayeli Schuppe –
I’m really impressed with the arterial occlusion simulation results. It’s fascinating to see the behavior of blood flow through different degrees of stenosis and how the pressure and velocity changes.
MR CFD Support –
Thank you for your review! We’re glad to hear that you found the simulation informative and that it provided clear insights into the dynamics of blood flow in occluded arteries. If you have any further questions or need more details, feel free to reach out to us.
Nya Gerlach IV –
I was particularly impressed by the detailed simulation of arterial occlusion and the clarity in showcasing how different levels of occlusion affect blood flow and pressure. It was fascinating to see the relationship between the degree of stenosis and subsequent changes in the hemodynamic parameters.
MR CFD Support –
Thank you for your kind words about our Arterial Occlusion CFD Simulation tutorial. We strive to deliver detailed and clear simulations and are glad to hear that our presentation of stenosis and its impact on blood flow and pressure was both informative and fascinating to you.
Mikayla Murray –
Really insightful tutorial! It provided an in-depth understanding of arterial occlusion simulation. The step-by-step approach made it easy to follow even for someone new to the field. Great job on illustrating the impacts of various occlusion percentages on blood flow dynamics!
MR CFD Support –
Thank you for taking the time to leave such a positive review! It’s great to hear that the tutorial was helpful and that you were able to gain a better understanding of the complexities involved in simulating arterial occlusion. We strive to produce clear and comprehensive content, so it’s rewarding to know it was easy to follow. If you have further interest in our simulation tutorials or any questions, feel free to reach out!
Jonathon Gerlach IV –
The training is excellent and exciting and, of course, complete.
Estevan Kovacek –
The ability to customize this simulation for specific conditions is a game-changer!
Julia Keeling –
Thank you for such a comprehensive tutorial on Arterial Occlusion Simulation. It was a challenging topic, but your explanations and the way you demonstrated the impact of stenosis on blood pressure and velocity made it really clear. The visual aids were especially helpful!
MR CFD Support –
We’re thrilled to hear that you found our Arterial Occlusion CFD Simulation tutorial so enlightening and useful! We always strive to present complex subjects clearly, and it’s rewarding to know our visual guides effectively facilitated your understanding. Thank you for taking the time to provide your positive feedback.
Ransom Romaguera –
I’m very interested in the method you used for the vessel stenosis mapping. The curvilinear function is quite fascinating. Could you provide more details on how this function feeds into the simulation setup in layman’s terms?
MR CFD Support –
Certainly! Basically, the curvilinear function is a mathematical representation that we use to mimic the narrowing of the artery, which is known as stenosis. Imagine squishing a part of a pipe, making that part narrower. The function tells the software exactly how to shape that narrow section by giving a list of coordinated points to form that part of the artery. The function changes the width to resemble an actual artery with a blockage. This information lets the software know how blood would flow through this narrowed part, allowing us to analyze how fast it goes and the changes in pressure as it squeezes through the constraint.
Bryce Howe –
EXCELLENT
Macey Will –
The tutorial mentions variations in stenosis percentage; can you elaborate on how changing the degree of stenosis affects the simulation results?
MR CFD Support –
In the simulation as described, varying the degree of stenosis changes the maximum flow velocity and pressure drop across the stenosed area. An increase in stenosis percentage leads to a higher velocity at the narrowest section due to the reduced cross-sectional area for flow. This also results in a greater pressure drop since the fluid elements lose more energy while accelerating through the stenosis. Therefore, higher degrees of artery clogging result in more pronounced changes in blood dynamics, which is essential for understanding the implications for cardiovascular diseases in clinical applications.
Maegan Bashirian –
The presentation of the simulation results was very clear! Could you explain how occlusion percentages affect intervention strategies?
MR CFD Support –
Our simulation results demonstrate how varying degrees of arterial occlusion impact blood flow. As occlusion percentages rise, both pressure drop and blood velocity increase due to more significant obstructions. Clinicians may utilize this crucial data to design effective intervention strategies. Precise quantification of occlusion severity lays the groundwork for determining whether stent placement, angioplasty, or possibly surgical intervention is necessary for restoring adequate blood flow.
Renee Runte –
I really enjoyed the thorough analysis provided about how the blood passes through the stenosis in the artery. The detailed results showcasing pressure and velocity changes with varying occlusion percentages was insightful and helped me understand the implications of arterial blockages. Great tutorial, thanks to the MR CFD team for such an informative lesson.
MR CFD Support –
Thank you for your kind words and for noticing the effort we put into analyzing blood flow through arterial stenosis. We’re glad to hear that the provided details clarified the impact of occlusion severity on blood pressure and velocity. It’s our pleasure at MR CFD to provide content that enhances understanding of complex phenomena. Your appreciation is much valued!
Royce Jacobs –
Can this simulation be customized to model different types of arterial occlusions and blood flow conditions?
MR CFD Support –
Yes, we are open to accommodate your desired simulations. Please share more details about your specific requirements.
Jason Windler Jr. –
The explanations reveal a high attention to detail in the simulation. Very impressive. I can say without a doubt that this resource was supremely helpful for my research project on cardiovascular fluid dynamics.
MR CFD Support –
Thank you for your kind words! We’re thrilled to hear that our Arterial Occlusion CFD Simulation tutorial was helpful for your research. It’s great to know that our content is assisting individuals in pursuing cutting-edge projects. If there’s anything else we can do to support your work, please let us know.
Georgette Abshire –
The problem’s explanation of the simulations for different occlusion percentages was really helpful. And it was a really great feature to be able to visually compare pressure and velocity in 2D contours.
MR CFD Support –
Thank you for your kind words! We are glad that the visualization of pressure and velocity in 2D contours enhanced the understanding of the simulation and was helpful for your learning experience. If you have any further questions or need assistance with similar CFD simulations, please feel free to reach out to us.
Reynold Crona II –
Is this simulation helpful for developing treatments for those patients with stenosis?
MR CFD Support –
Absolutely, the simulation can be a valuable tool for understanding hemodynamics in arterial occlusion and for developing treatment plans. The data from various scenarios of arterial clogging can assist in predicting blood flow patterns, examining the impact of different levels of occlusion, and helping in the design of medical devices or procedures to alleviate effect of stenosis.
Kendrick Reinger –
I’m impressed with the level of detail in the arterial occlusion simulation. Has this model been validated with clinical data or experimental results to ensure its accuracy?
MR CFD Support –
Thank you for your positive feedback and interest in the accuracy of our model. For the validation, this simulation’s outcomes could be compared to clinical data or results from experimental studies on the specific characteristics of blood flow through occluded arteries. This step would indeed be imperative to authenticate the appropriateness of the model for clinical or research purposes.
Demario Homenick –
The tutorial mentions changes in percentages of artery clogging to compare fluid behavior. How does this variation affect the computational requirements of the simulation?
MR CFD Support –
With each increase in the percentage of artery clogging, the complexity of the flow behavior increases, which in turn may require a denser mesh near the stenosis and possibly more computational iterations for the solution to converge. As a result, computational time and resources may increase with higher percentages of occlusion to ensure accurate results for fluid behavior.
Dereck Kovacek IV –
The simulations demonstrate how arterial occlusion impacts blood flow. What would be the application of these findings in the medical field? Are they applicable to developing treatments or interventions for arterial diseases?
MR CFD Support –
The findings of these simulations are indeed beneficial for the medical field, particularly in vascular surgery and cardiology. They can help in understanding the hemodynamic changes induced by arterial occlusion, which can assist in the design of medical interventions, such as the sizing and placement of stents, or in surgical planning for artery bypass grafting procedures. Furthermore, these simulations help predict the risk of potential complications such as local ischemia or distal embolization, thus aiding in the development of preventive measures and treatment strategies for arterial diseases.
Baylee Breitenberg –
I found the detailed conclusion about blood velocity and pressure changes to be informative. How can this simulation help in medical diagnosis or treatment planning?
MR CFD Support –
This simulation can help medical professionals understand hemodynamic changes due to arterial stenosis, which is crucial for diagnosis and treatment planning. By visualizing the changes in blood flow dynamics and pressure drops across different degrees of occlusion, physicians can better predict the risk of conditions such as ischemia and inform decisions regarding interventions like angioplasty or stent placement. Furthermore, it supports the customization of treatment plans based on patient-specific arterial geometries and flow conditions, ultimately contributing to personalized medicine.
Mrs. Loyce Hermiston Jr. –
What exactly is being investigated in this arterial occlusion simulation? Is there a particular clinical scenario or condition it is meant to represent?
MR CFD Support –
In this arterial occlusion simulation, we are mainly investigating how different percentages of arterial stenosis affect the behavior of blood flow through the vessel. This includes looking at changes in velocity and pressure as blood passes through varying degrees of occlusion. These conditions may represent a range of clinical scenarios from mild to severe arterial blockages that might be found in cardiovascular diseases such as atherosclerosis. The goal is to understand the flow characteristics and potential impacts on blood circulation and pressure, which are critical factors in medical diagnosis and treatment planning.