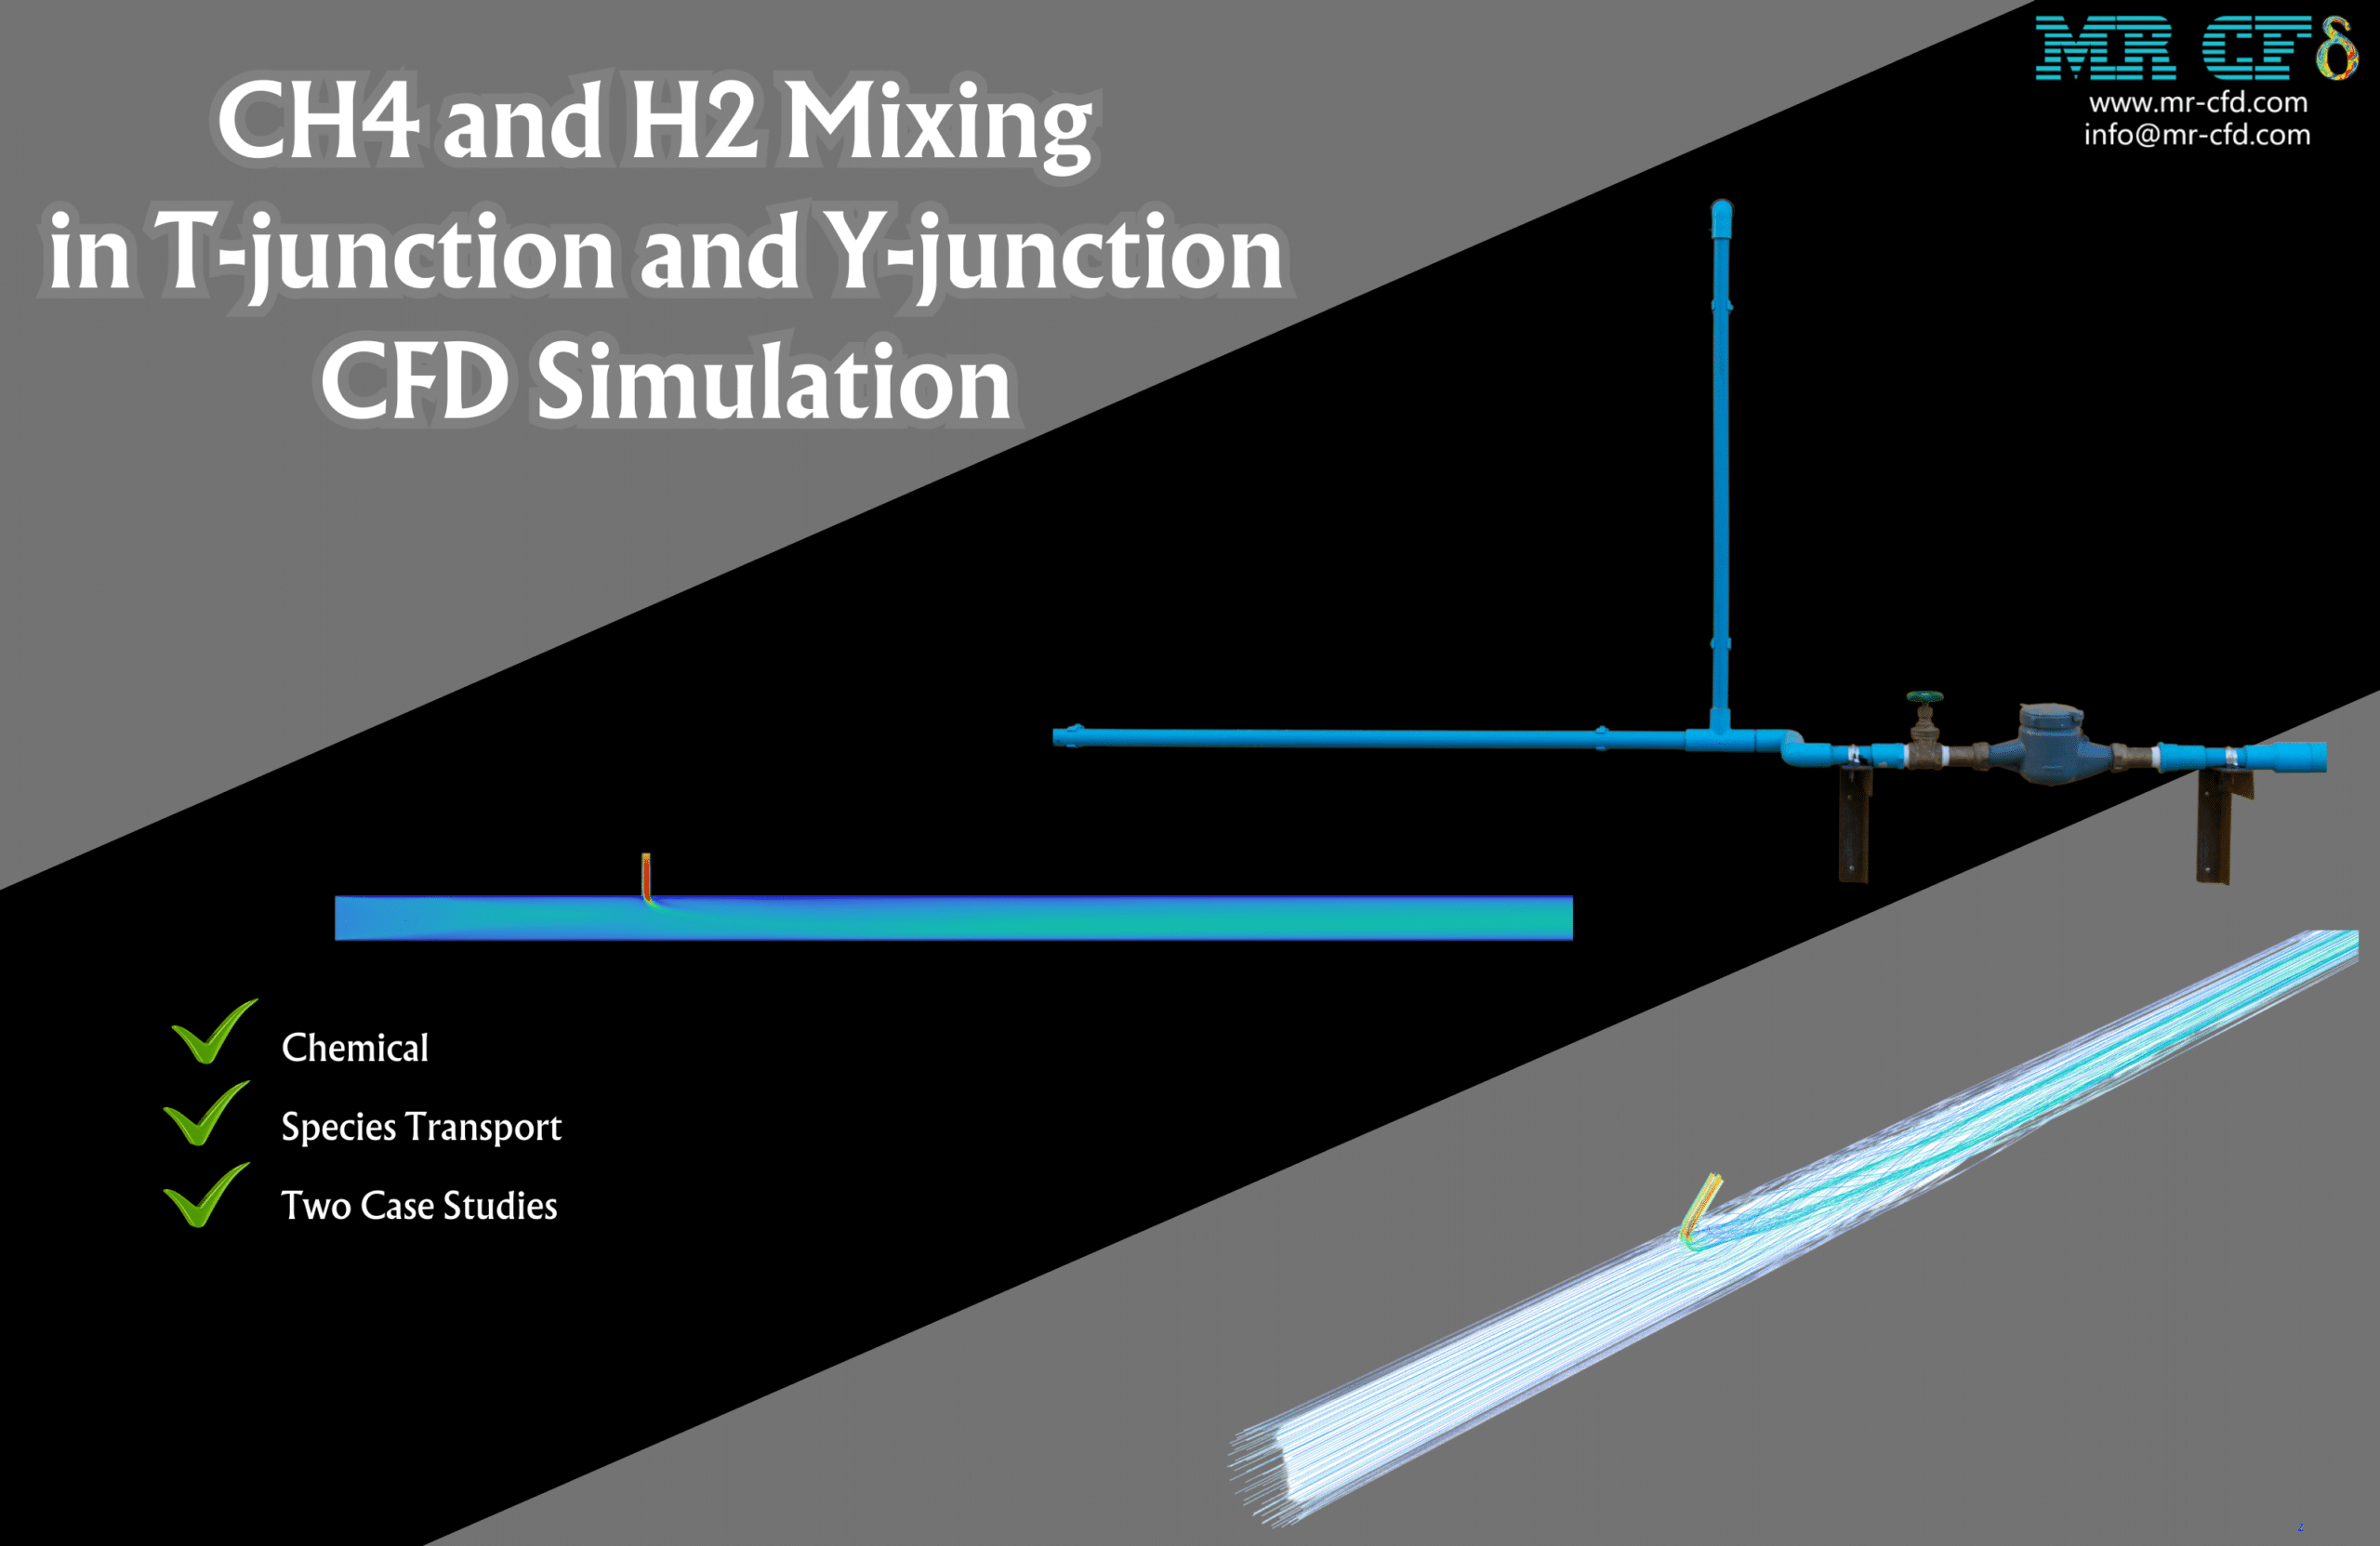
CH4 and H2 Mixing in T-junction and Y-junction CFD Simulation
$120.00 $60.00 Student Discount
To Order Your Project or benefit from a CFD consultation, contact our experts via email (info@mr-cfd.com), online support tab, or WhatsApp at +44 7443 197273.
There are some Free Products to check our service quality.
If you want the training video in another language instead of English, ask it via info@mr-cfd.com after you buy the product.
Description
CH4 and H2 Mixing in T-junction and Y-junction CFD Simulation, ANSYS Fluent Tutorial
Introduction
This study investigates the mixing process of methane (CH4) and hydrogen (H2) within T-junction and 45-degree angled Y-junction configurations using Computational Fluid Dynamics (CFD) analysis. The simulation aims to understand the effects of junction geometry on the mixing dynamics, species distribution, and flow characteristics. By employing advanced models for turbulence and species transport, this research provides valuable insights into the complex interplay of fluid dynamics in gas mixing systems.
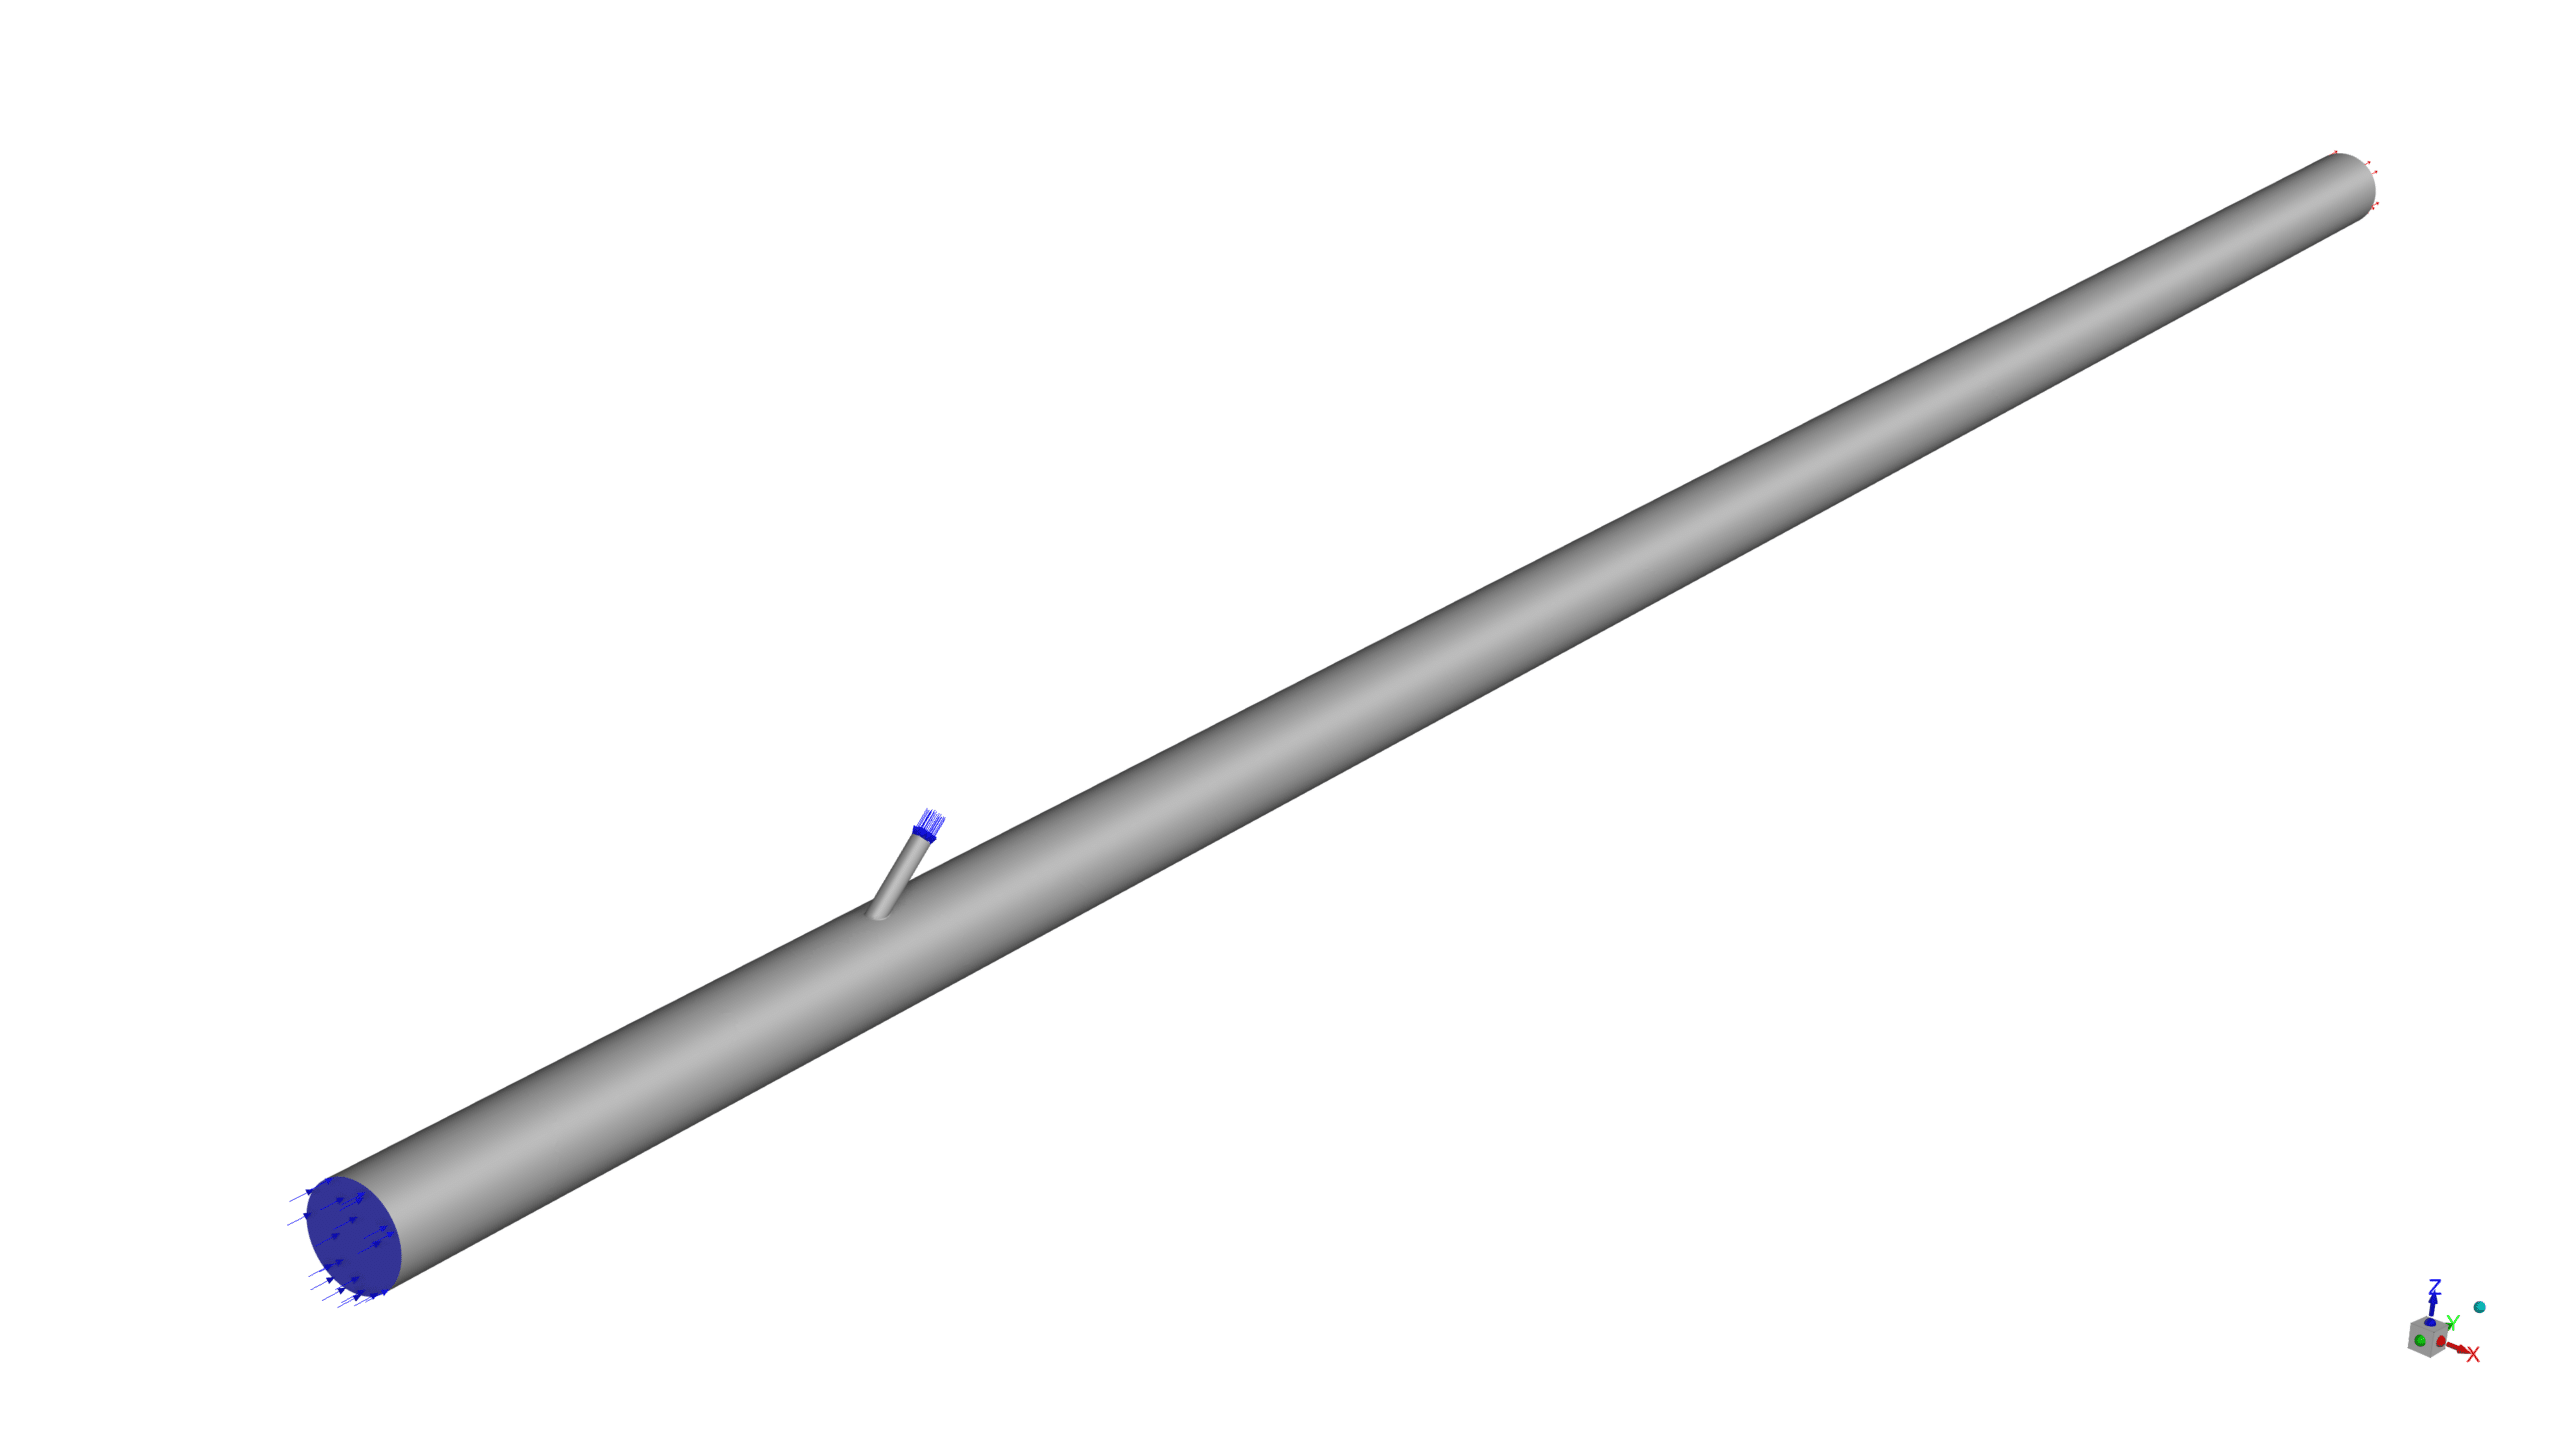
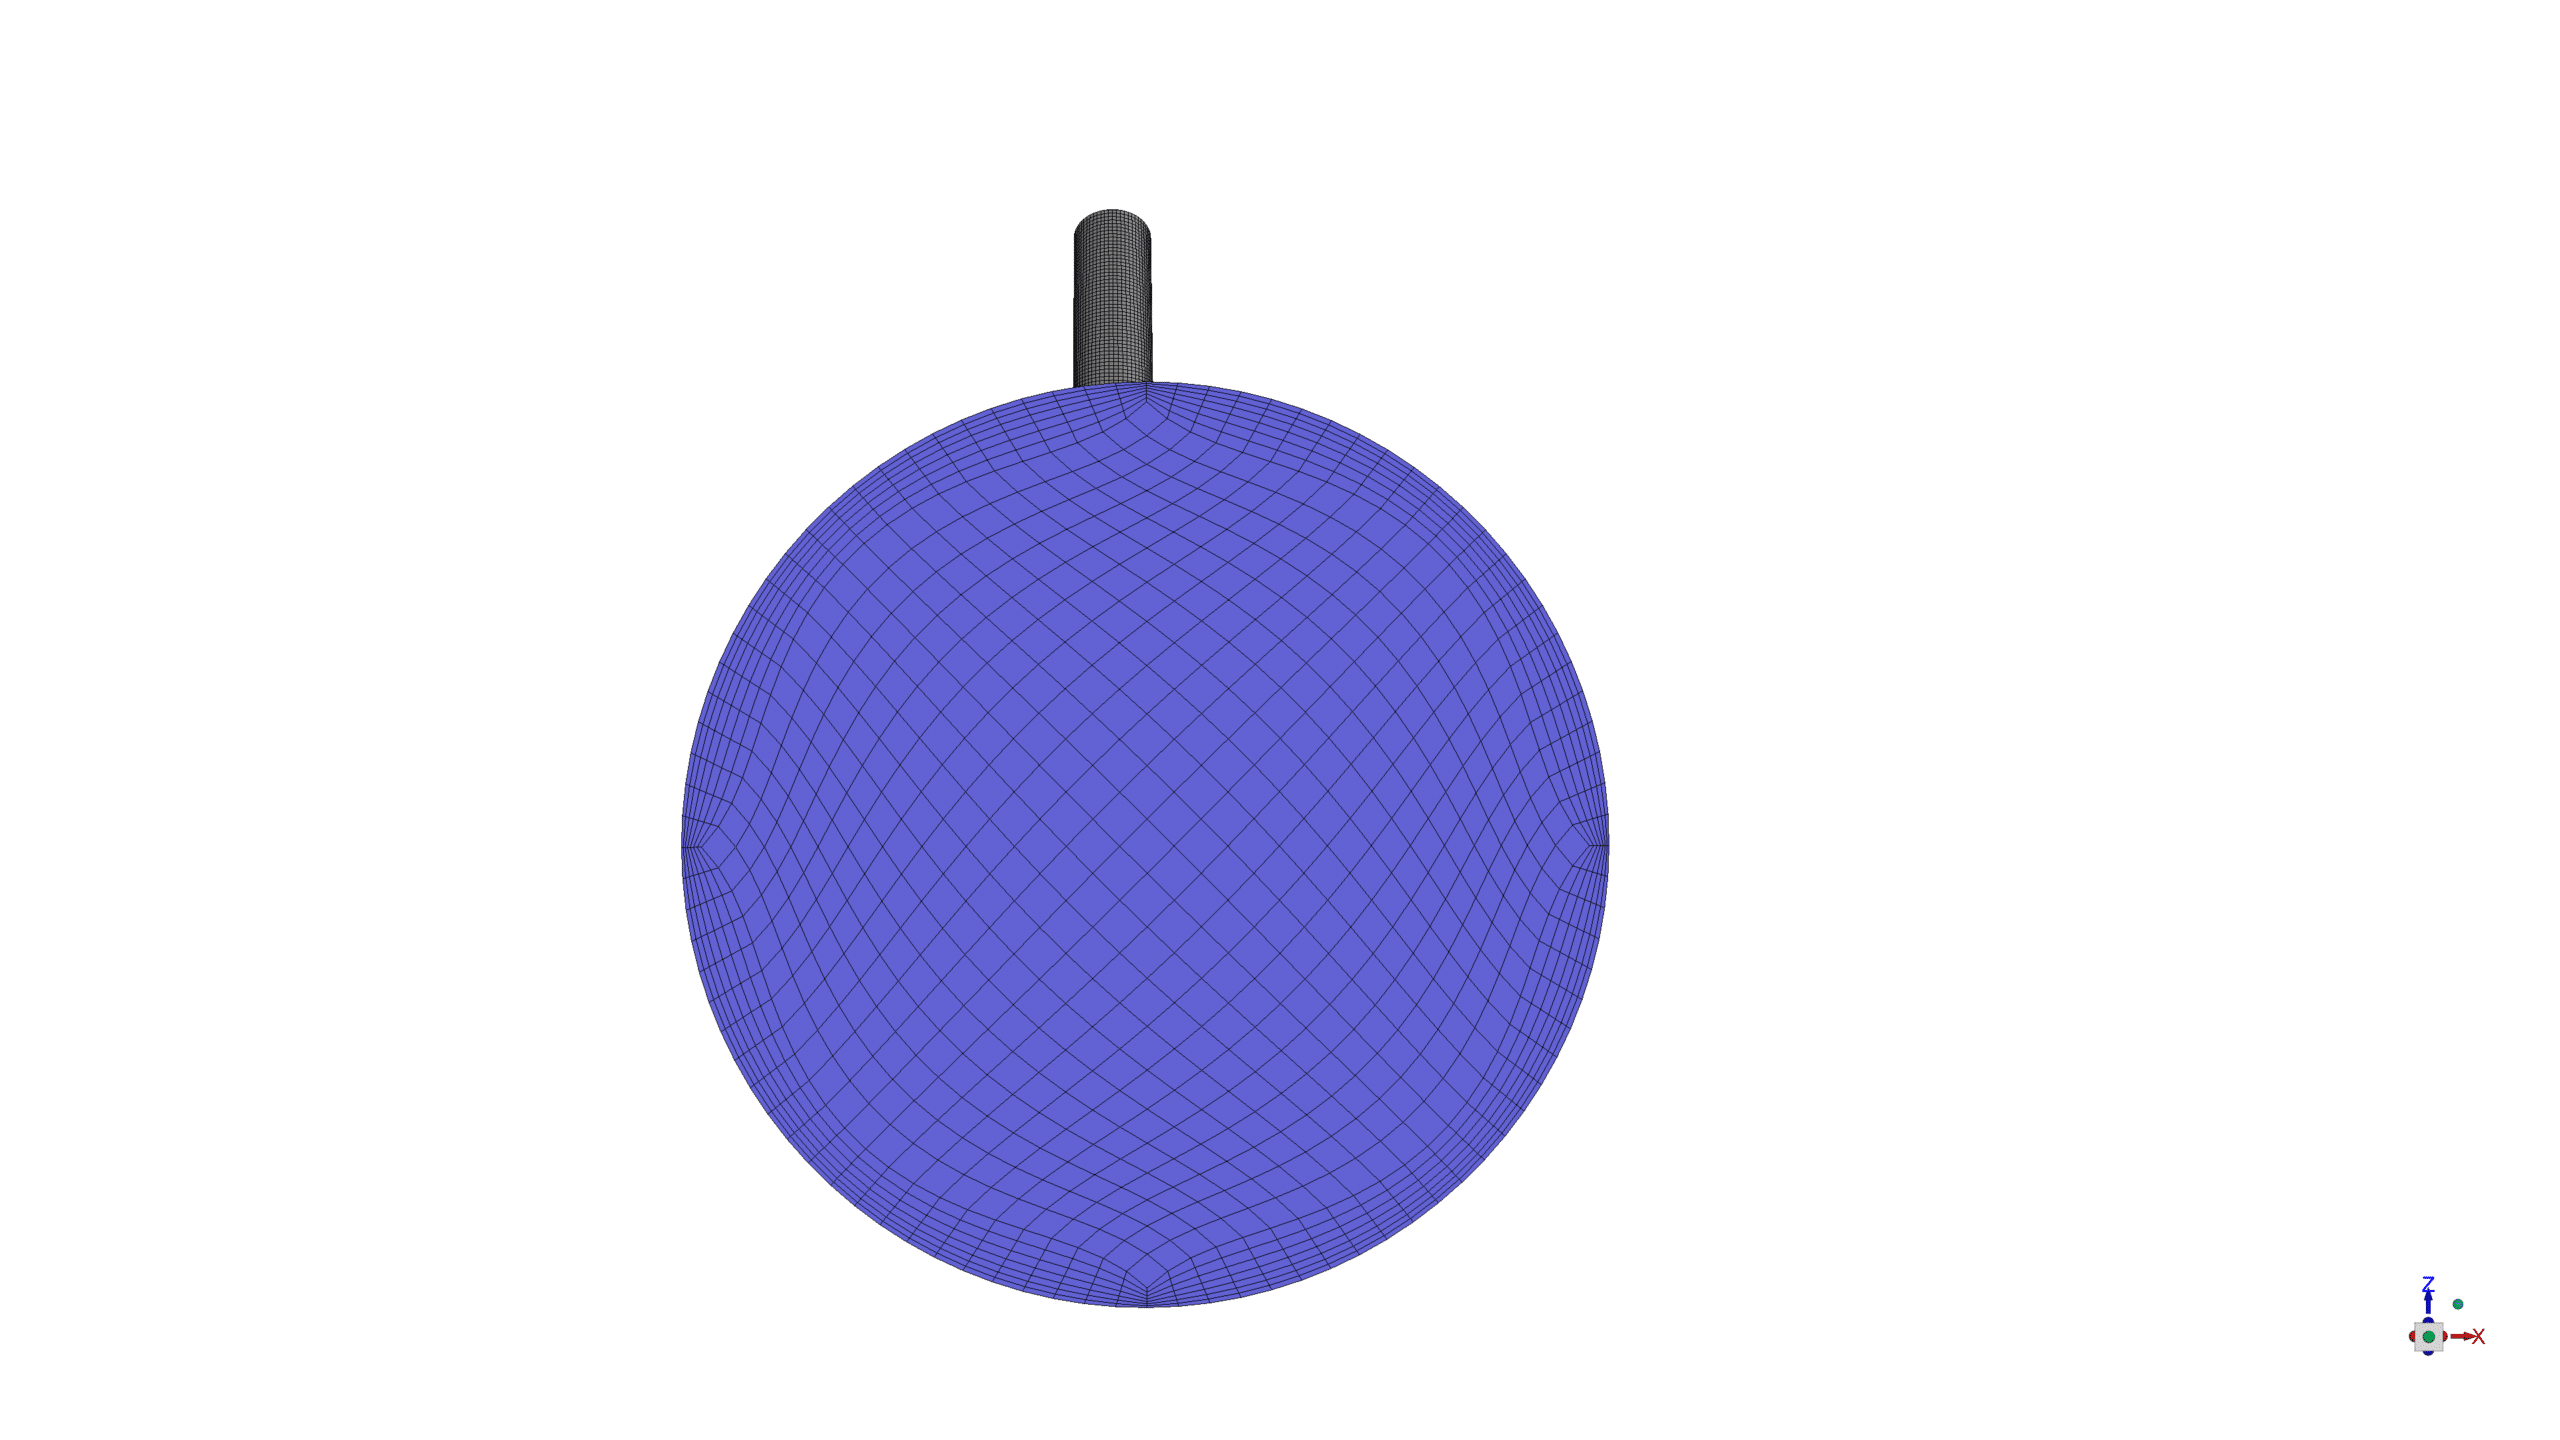
The CFD simulations were conducted using ANSYS Fluent software. The geometry was designed in ANSYS Design Modeler to represent T-junction and Y-junction configurations, with CH4 entering from the larger inlet on the left and H2 entering from the smaller inlet at the top. The mesh consisted of 2,484,831 quadrilateral elements generated in ANSYS Meshing, ensuring high-quality results.
Methodology
For turbulence modelling, the Standard k-ε model with standard wall function is utilized.
The Species Transport model is implemented to account for mixing different species (CH4 and H2) in the flow.
The energy equation is enabled, but as both inlets have the same temperature, it would be considered as an isothermal mixing study.
No chemical reactions are considered in this simulation, as the focus is on the physical mixing of the two gases.
Results
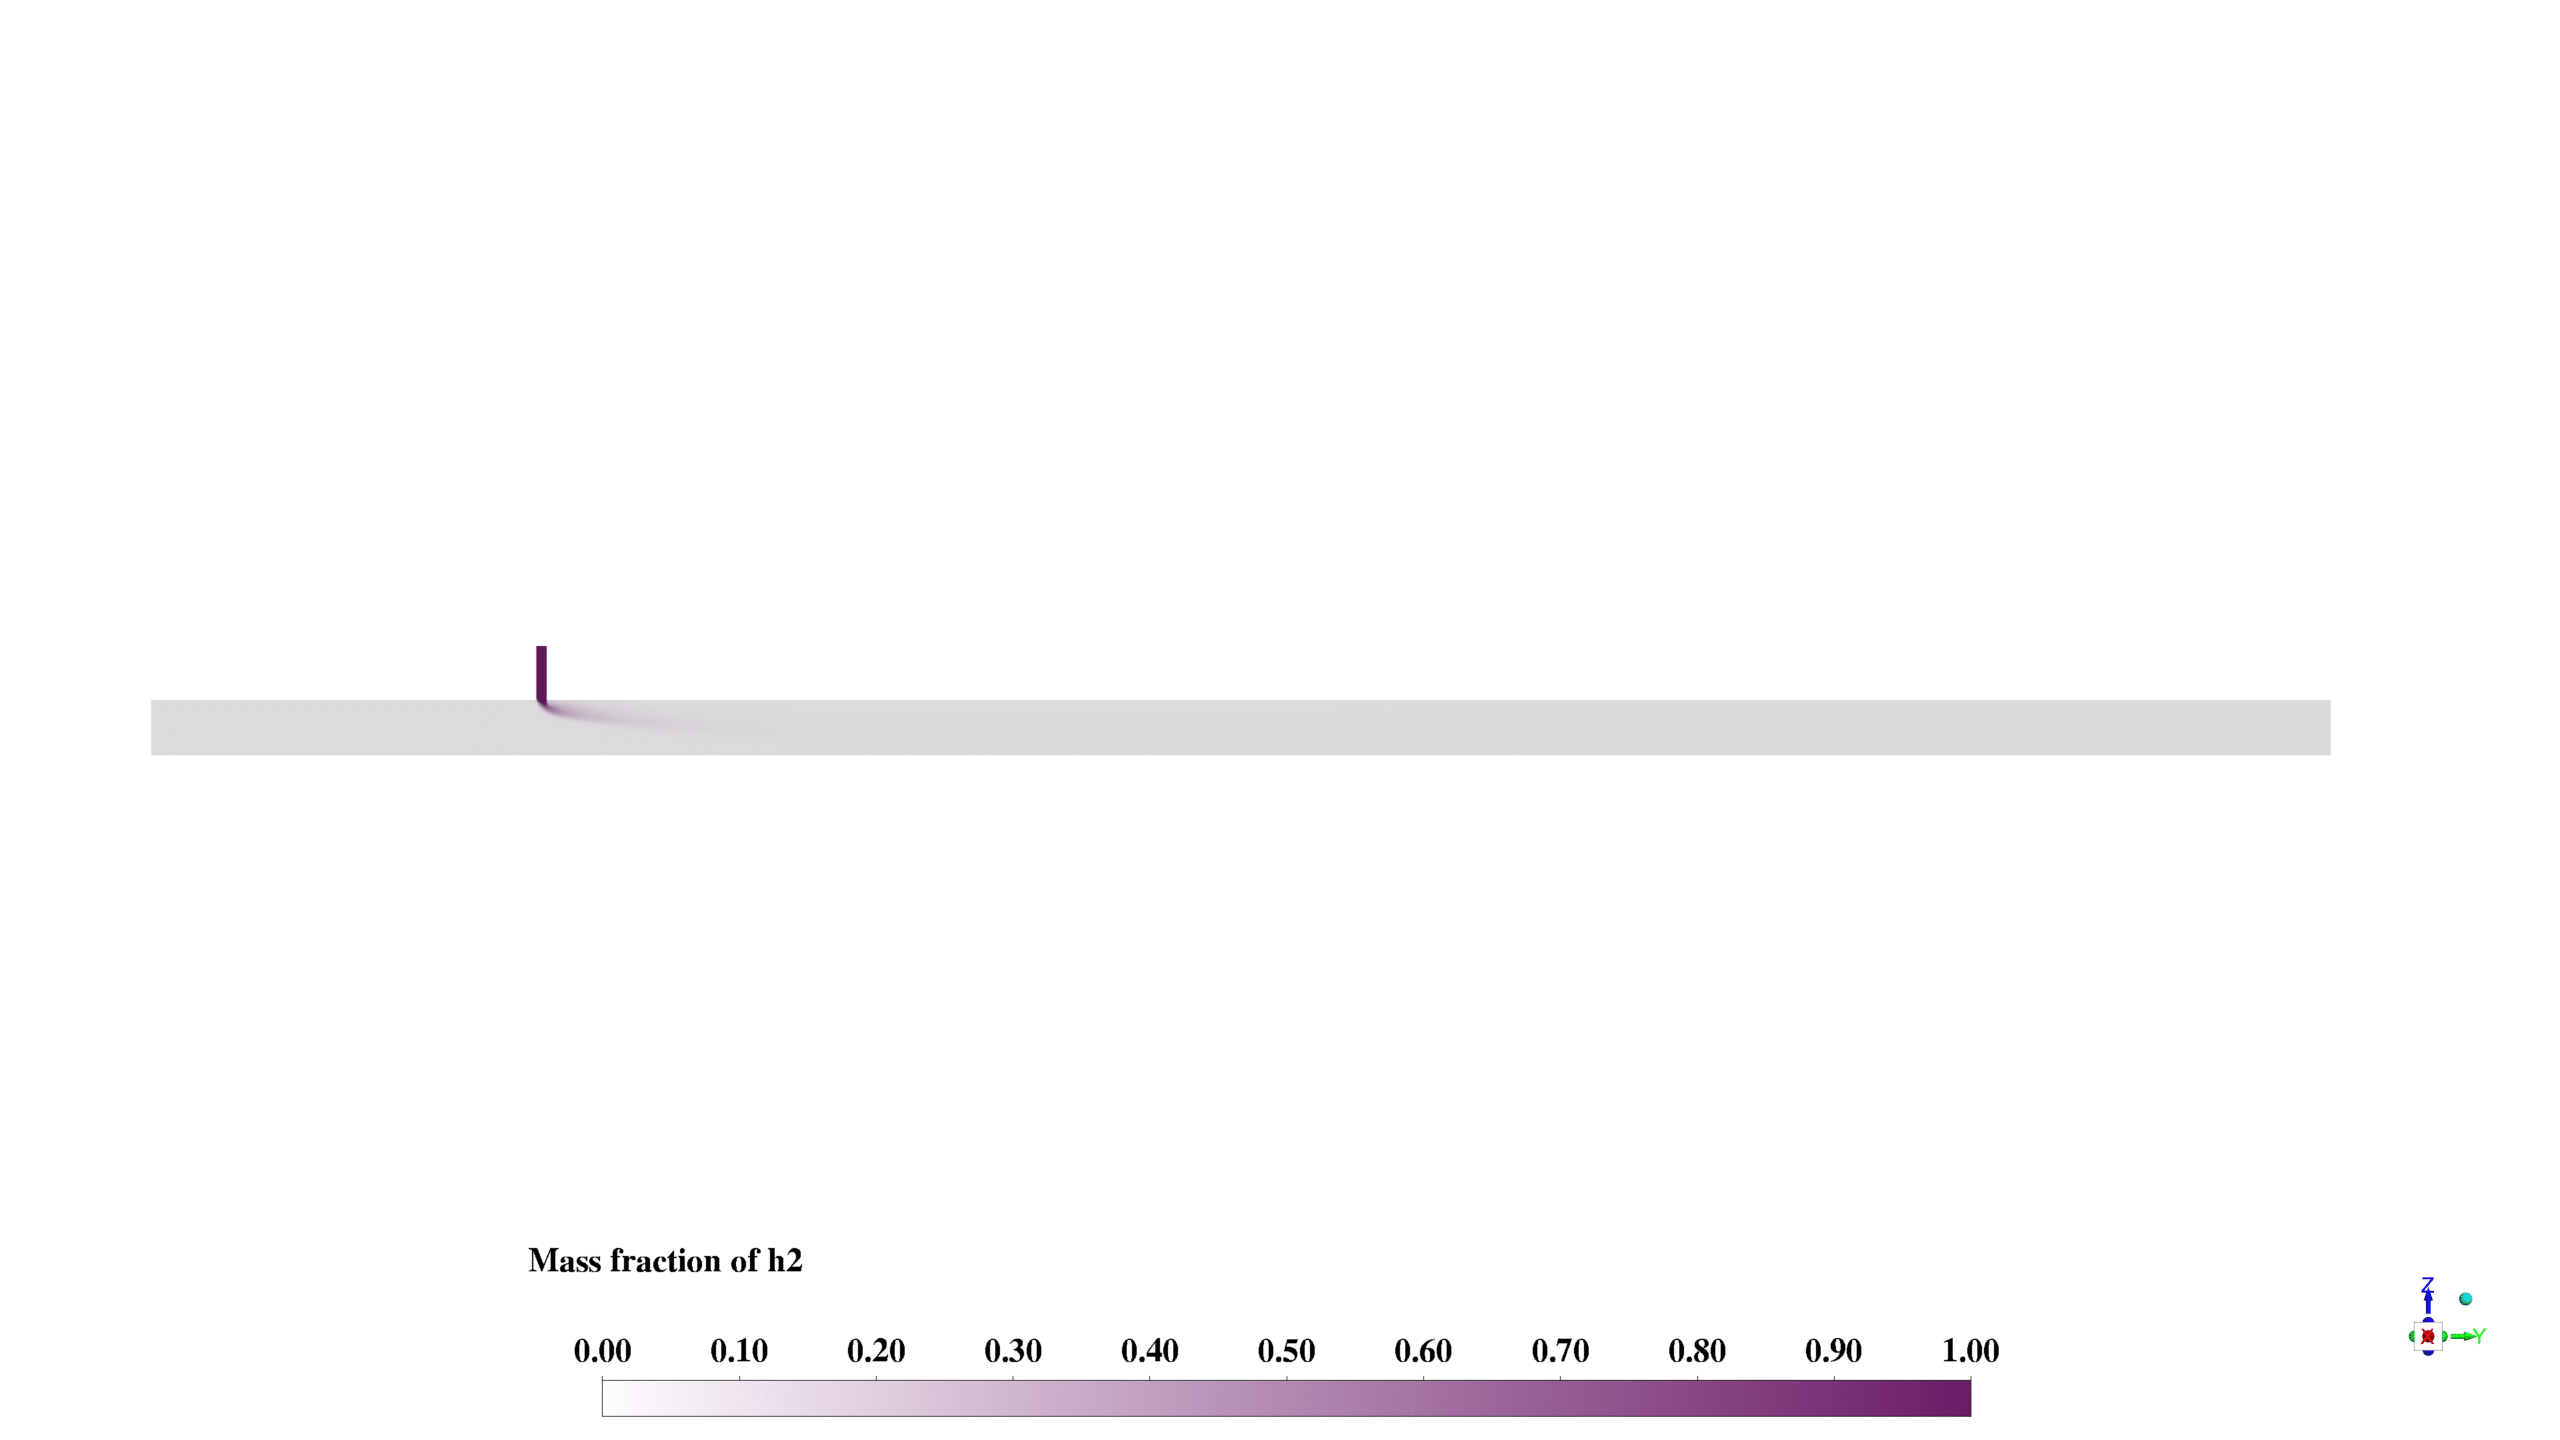
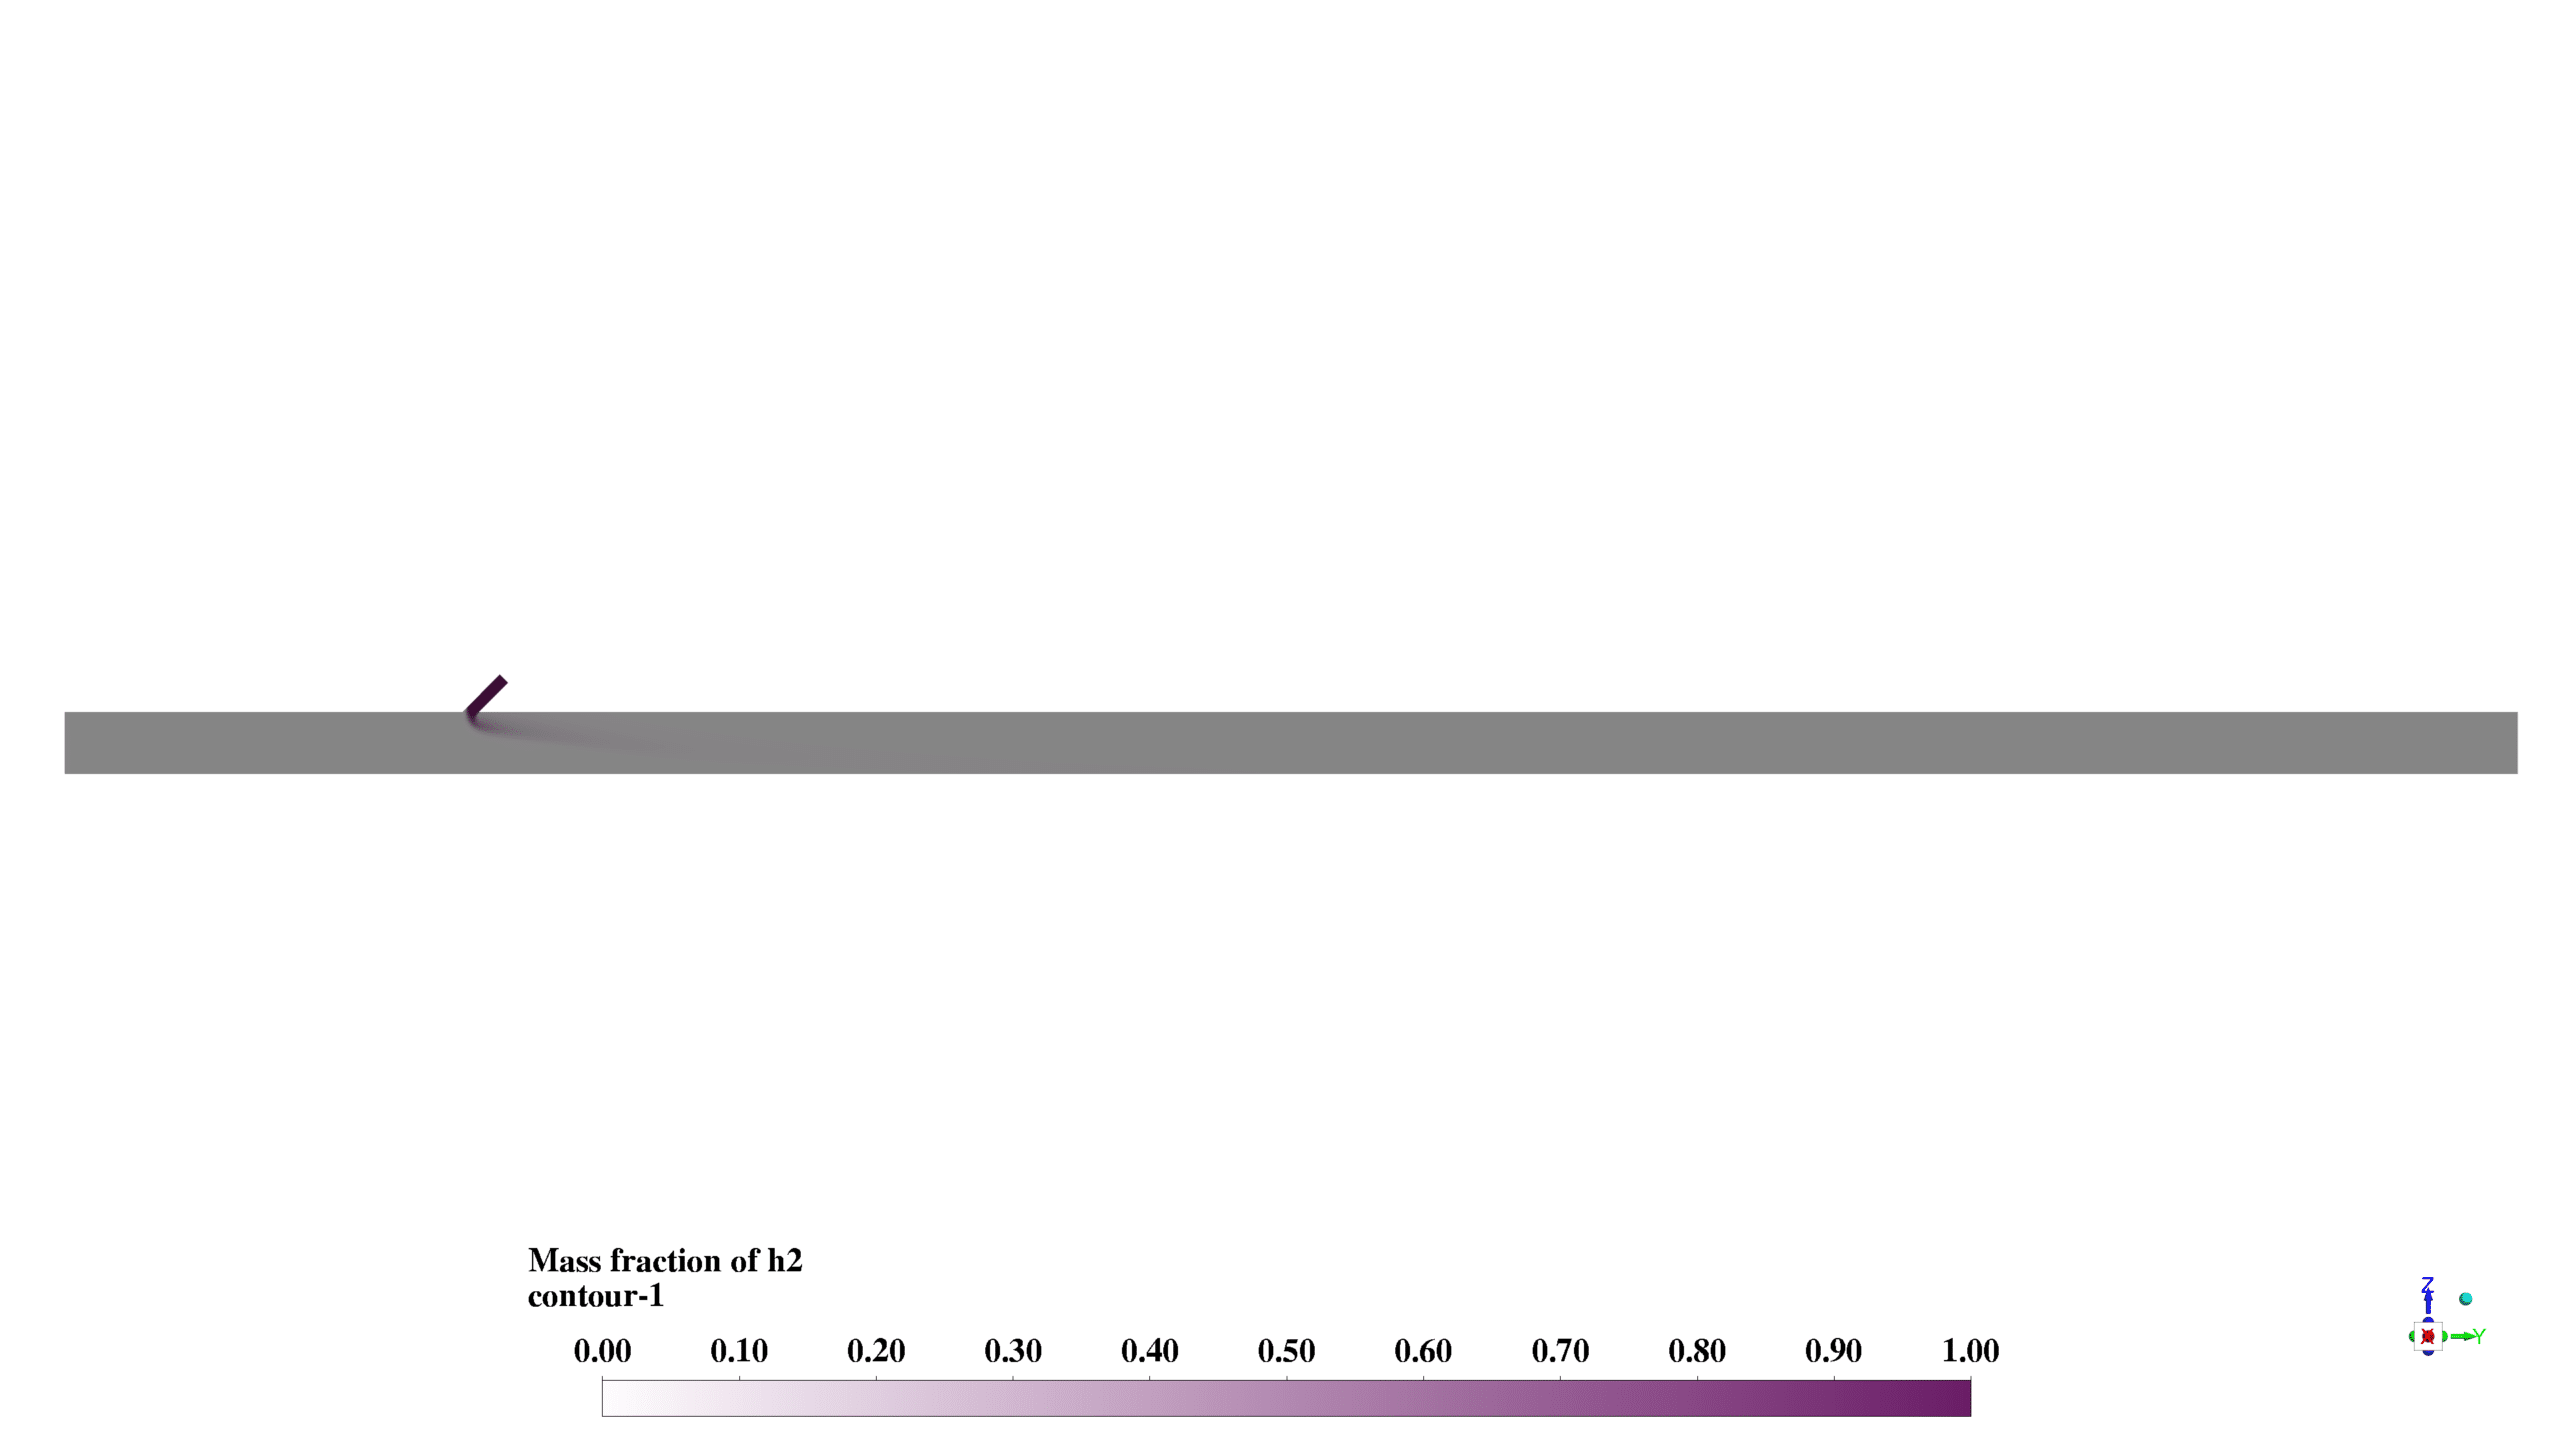
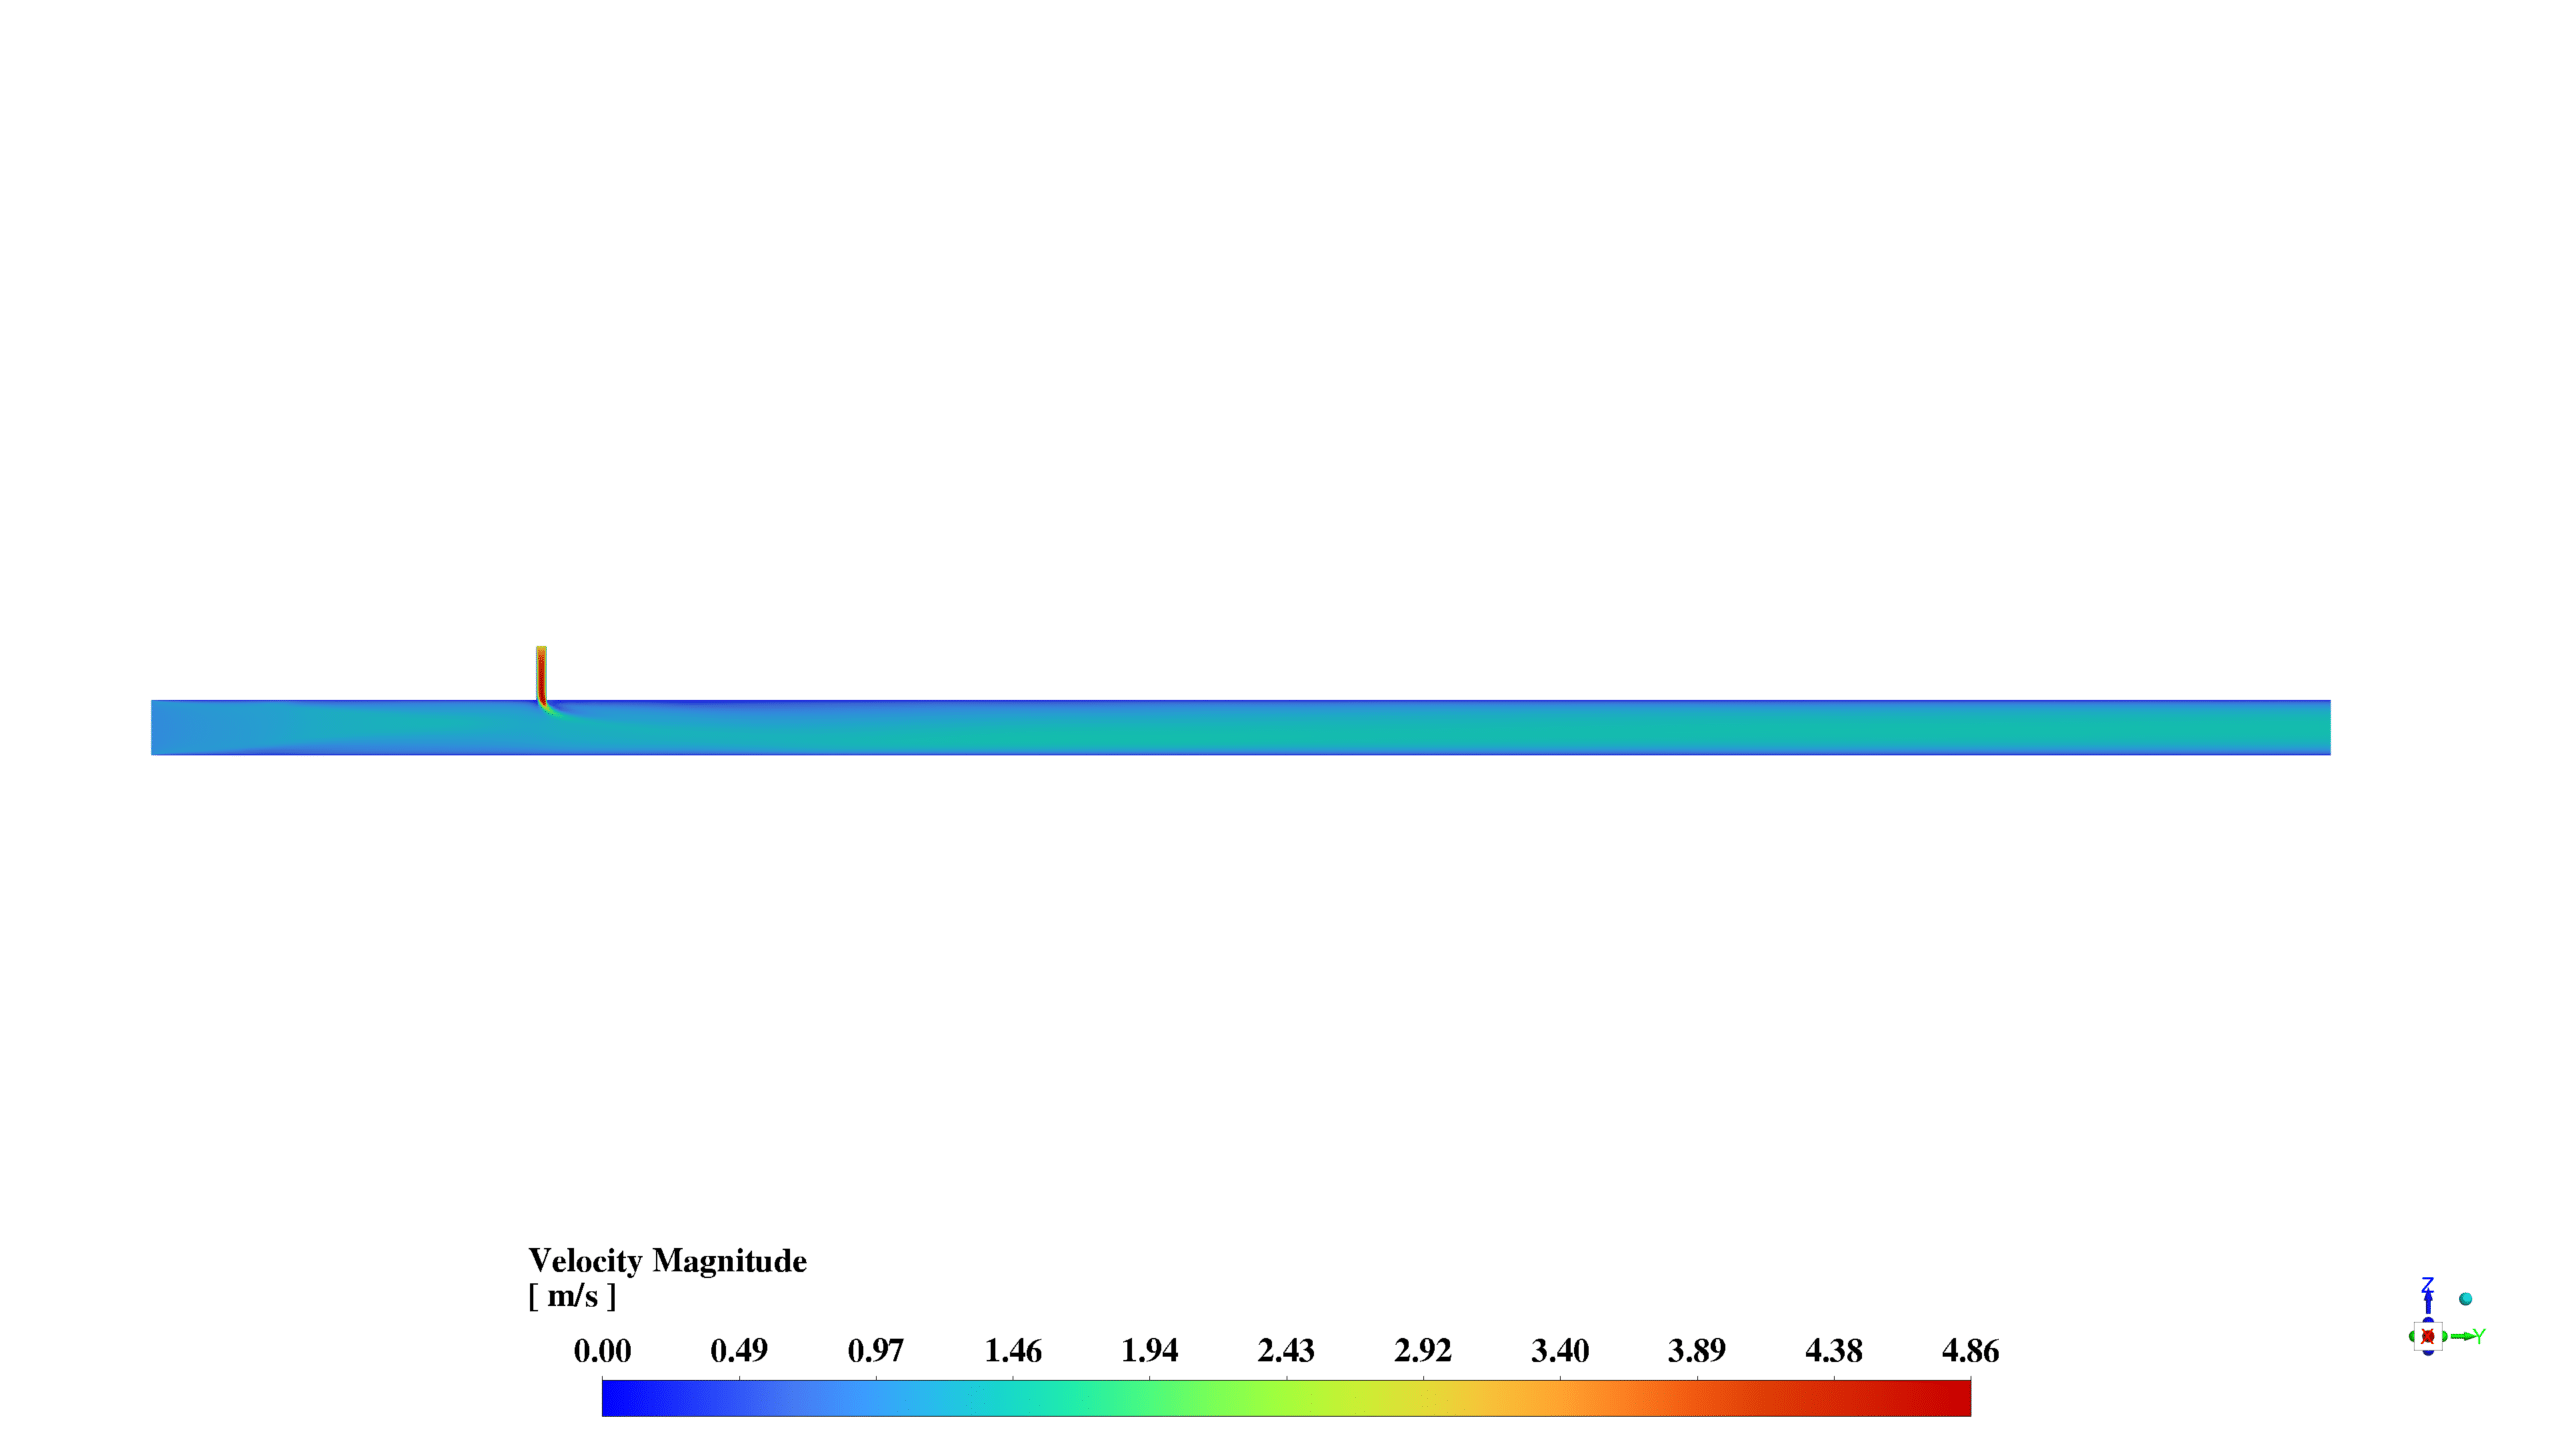
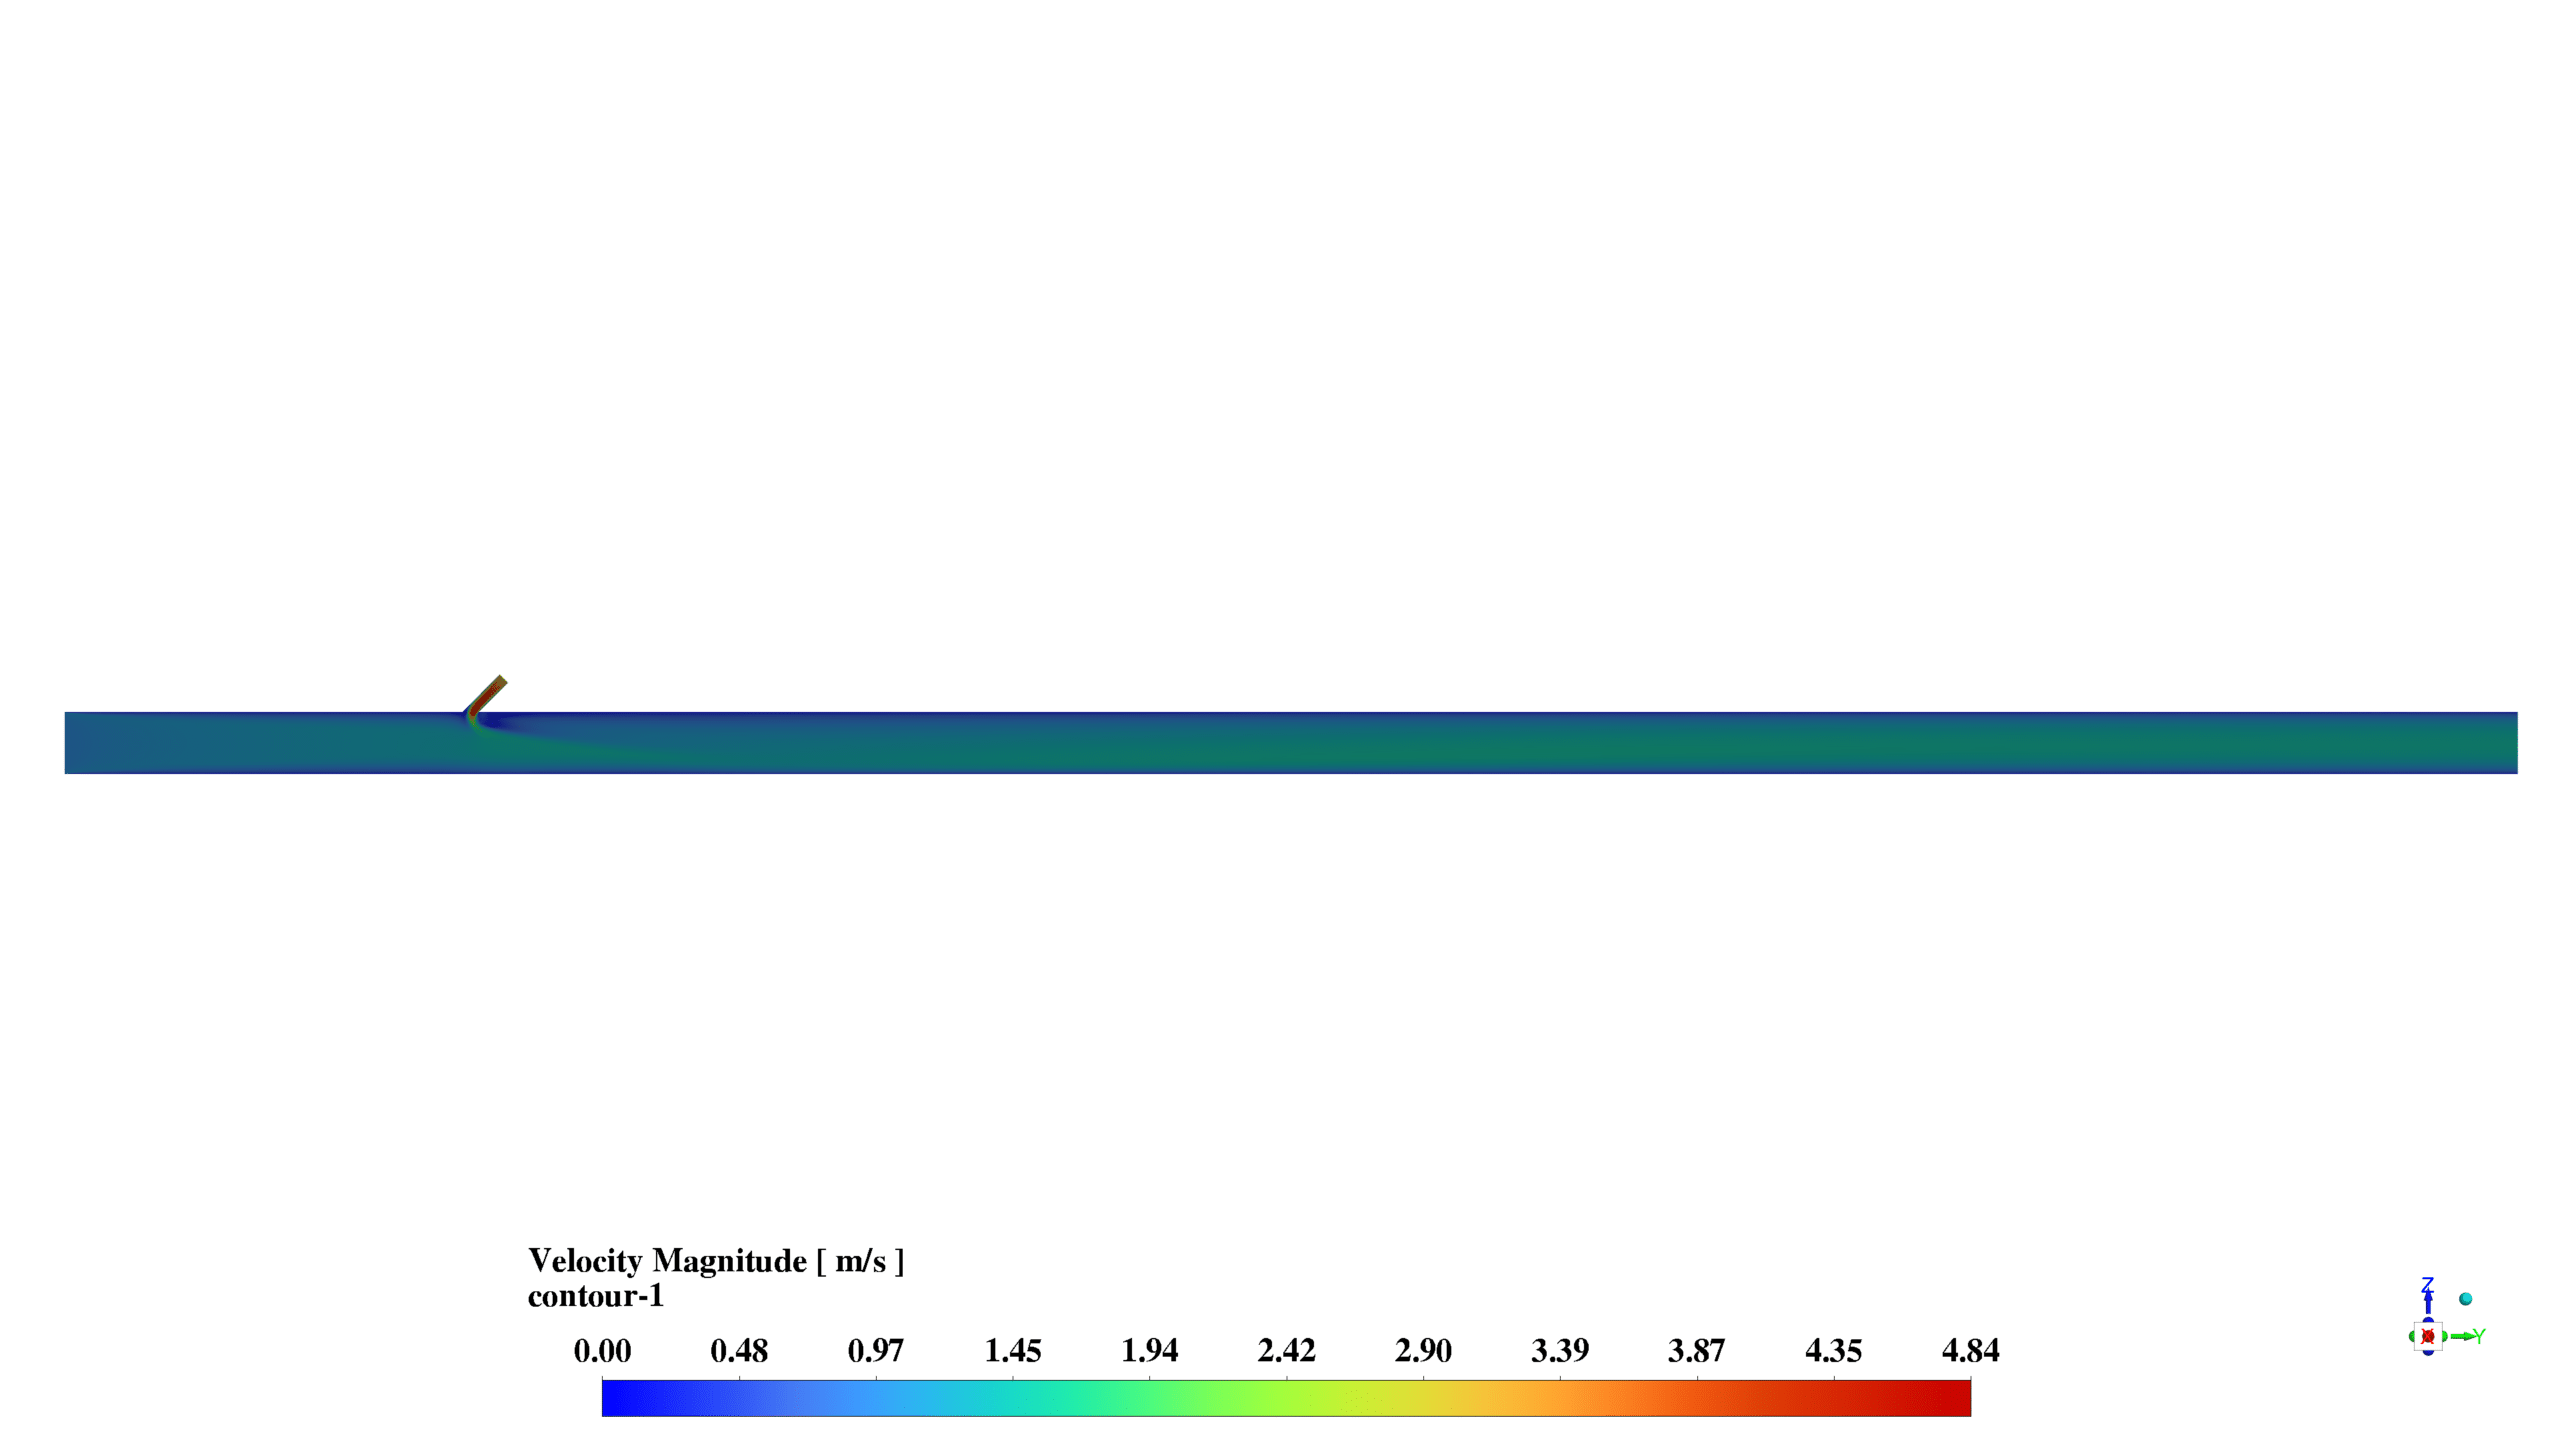
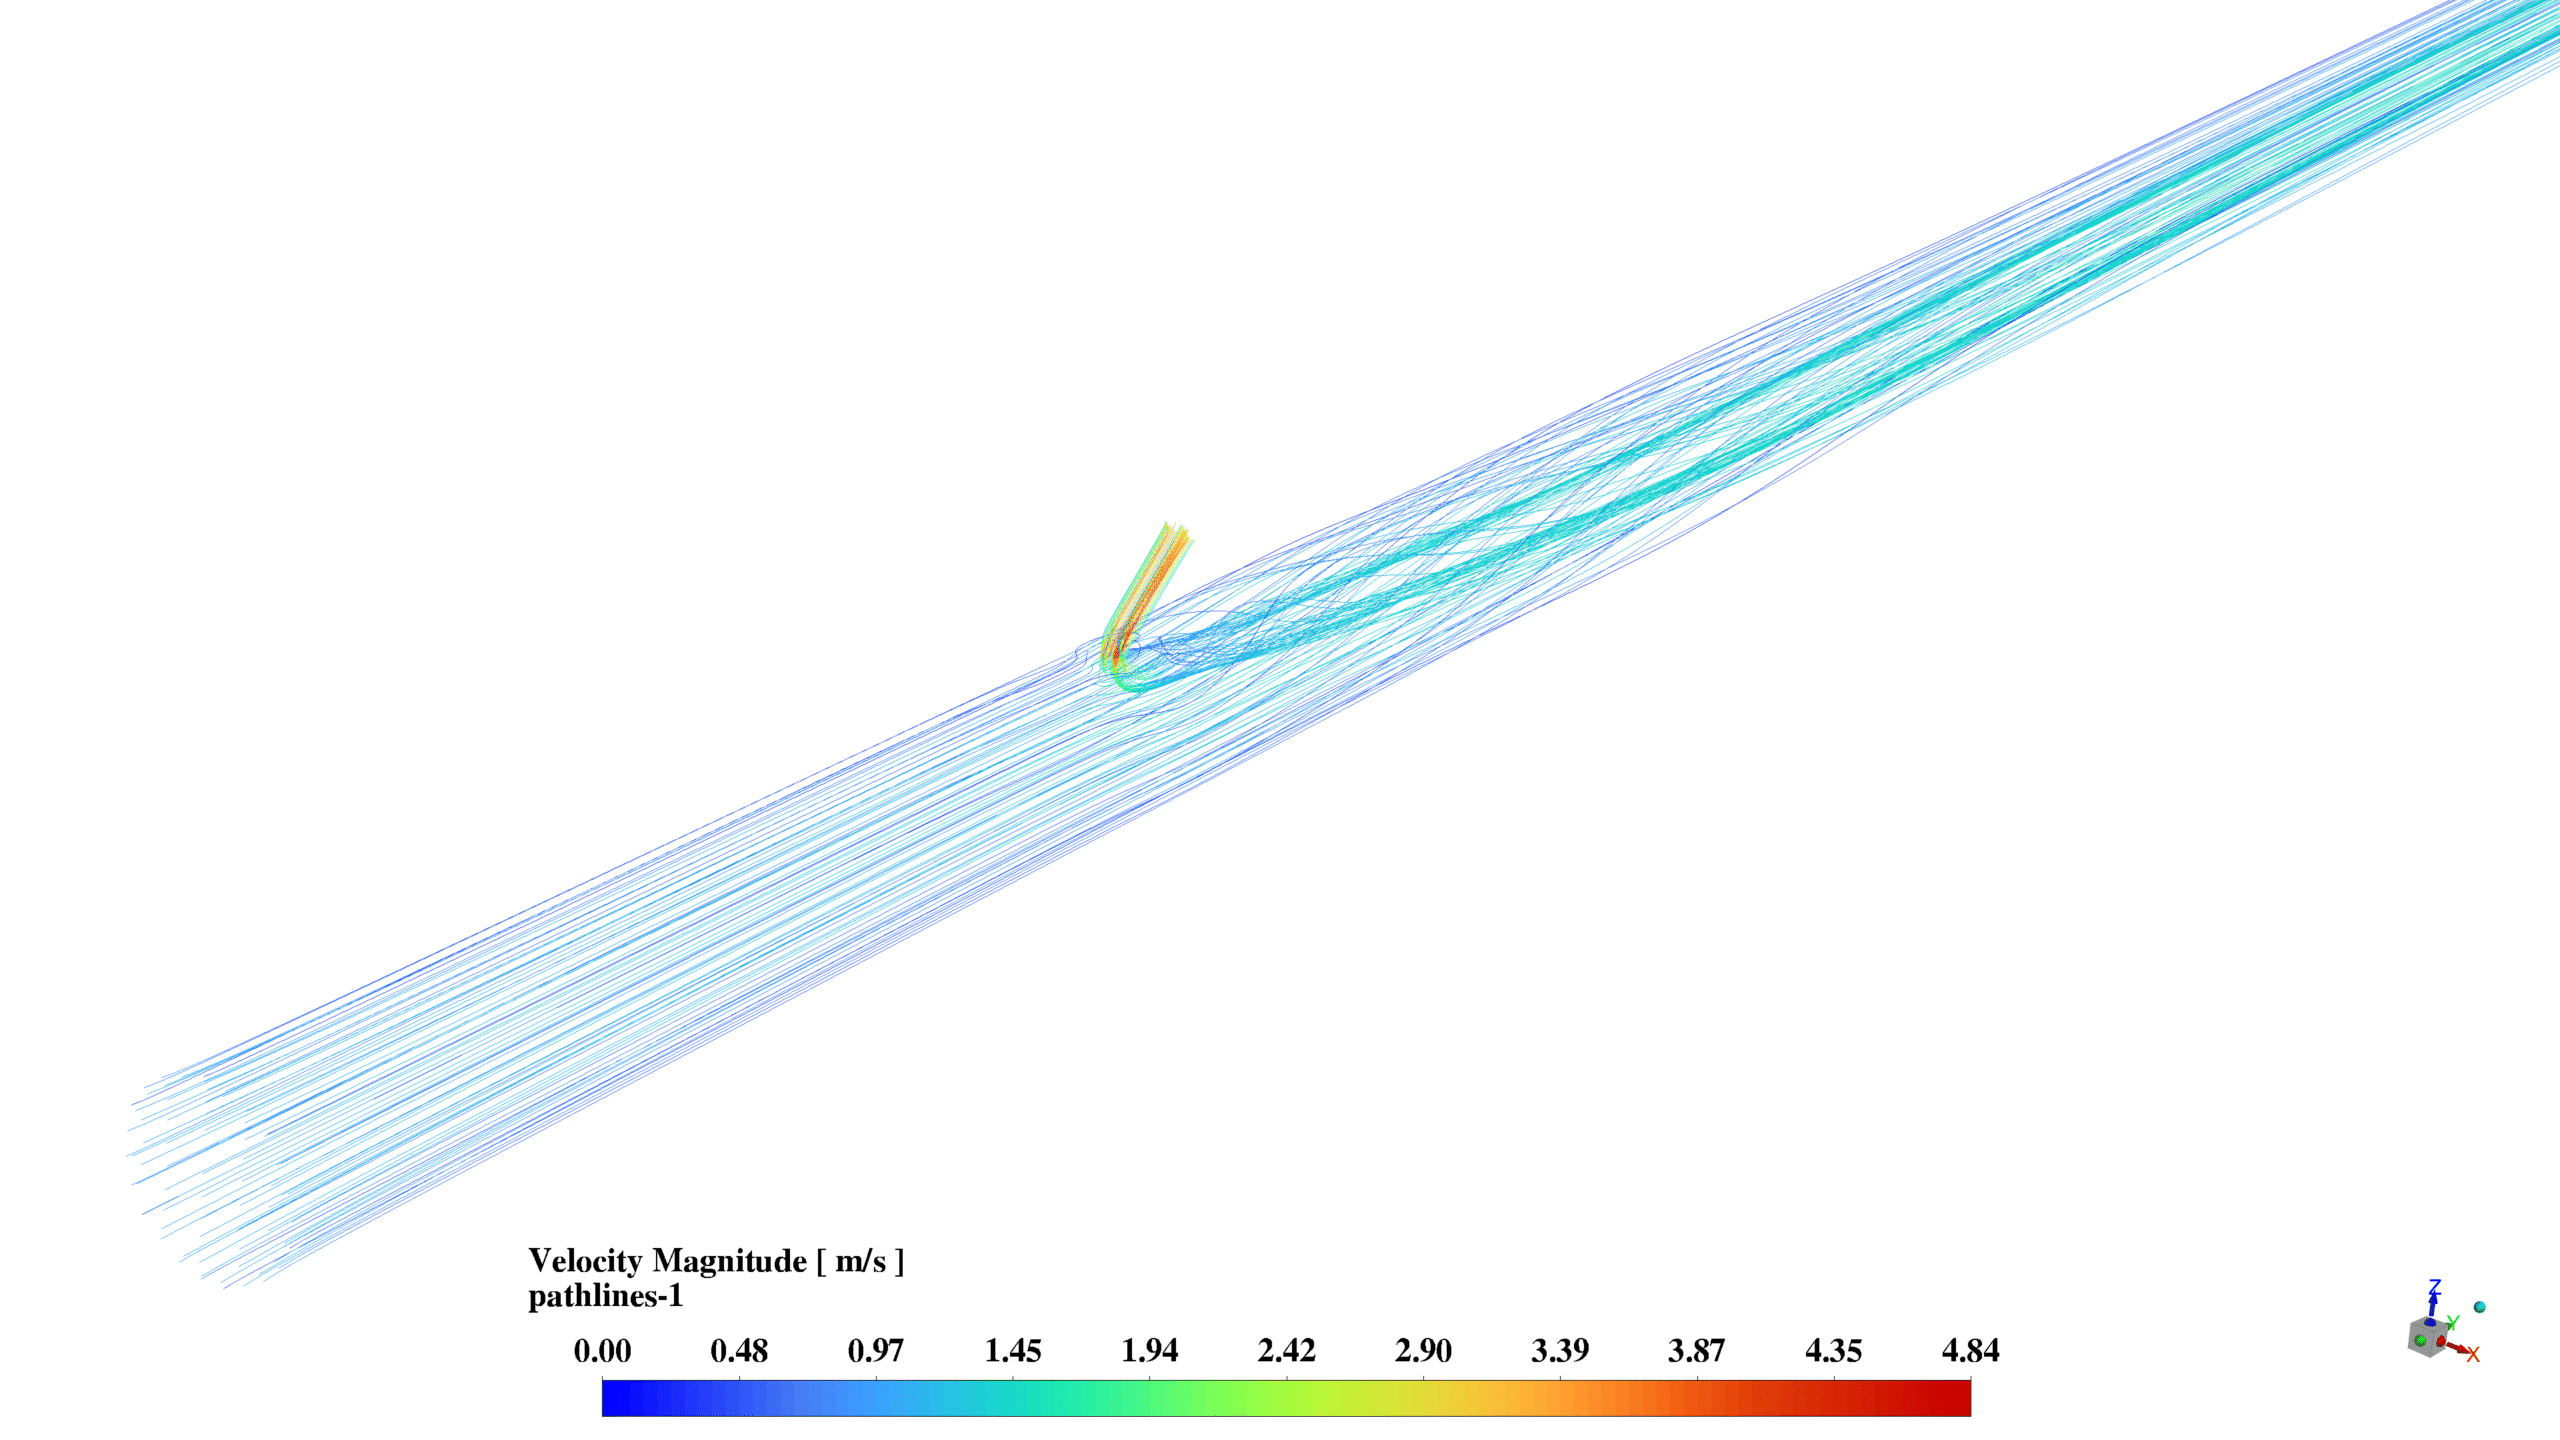
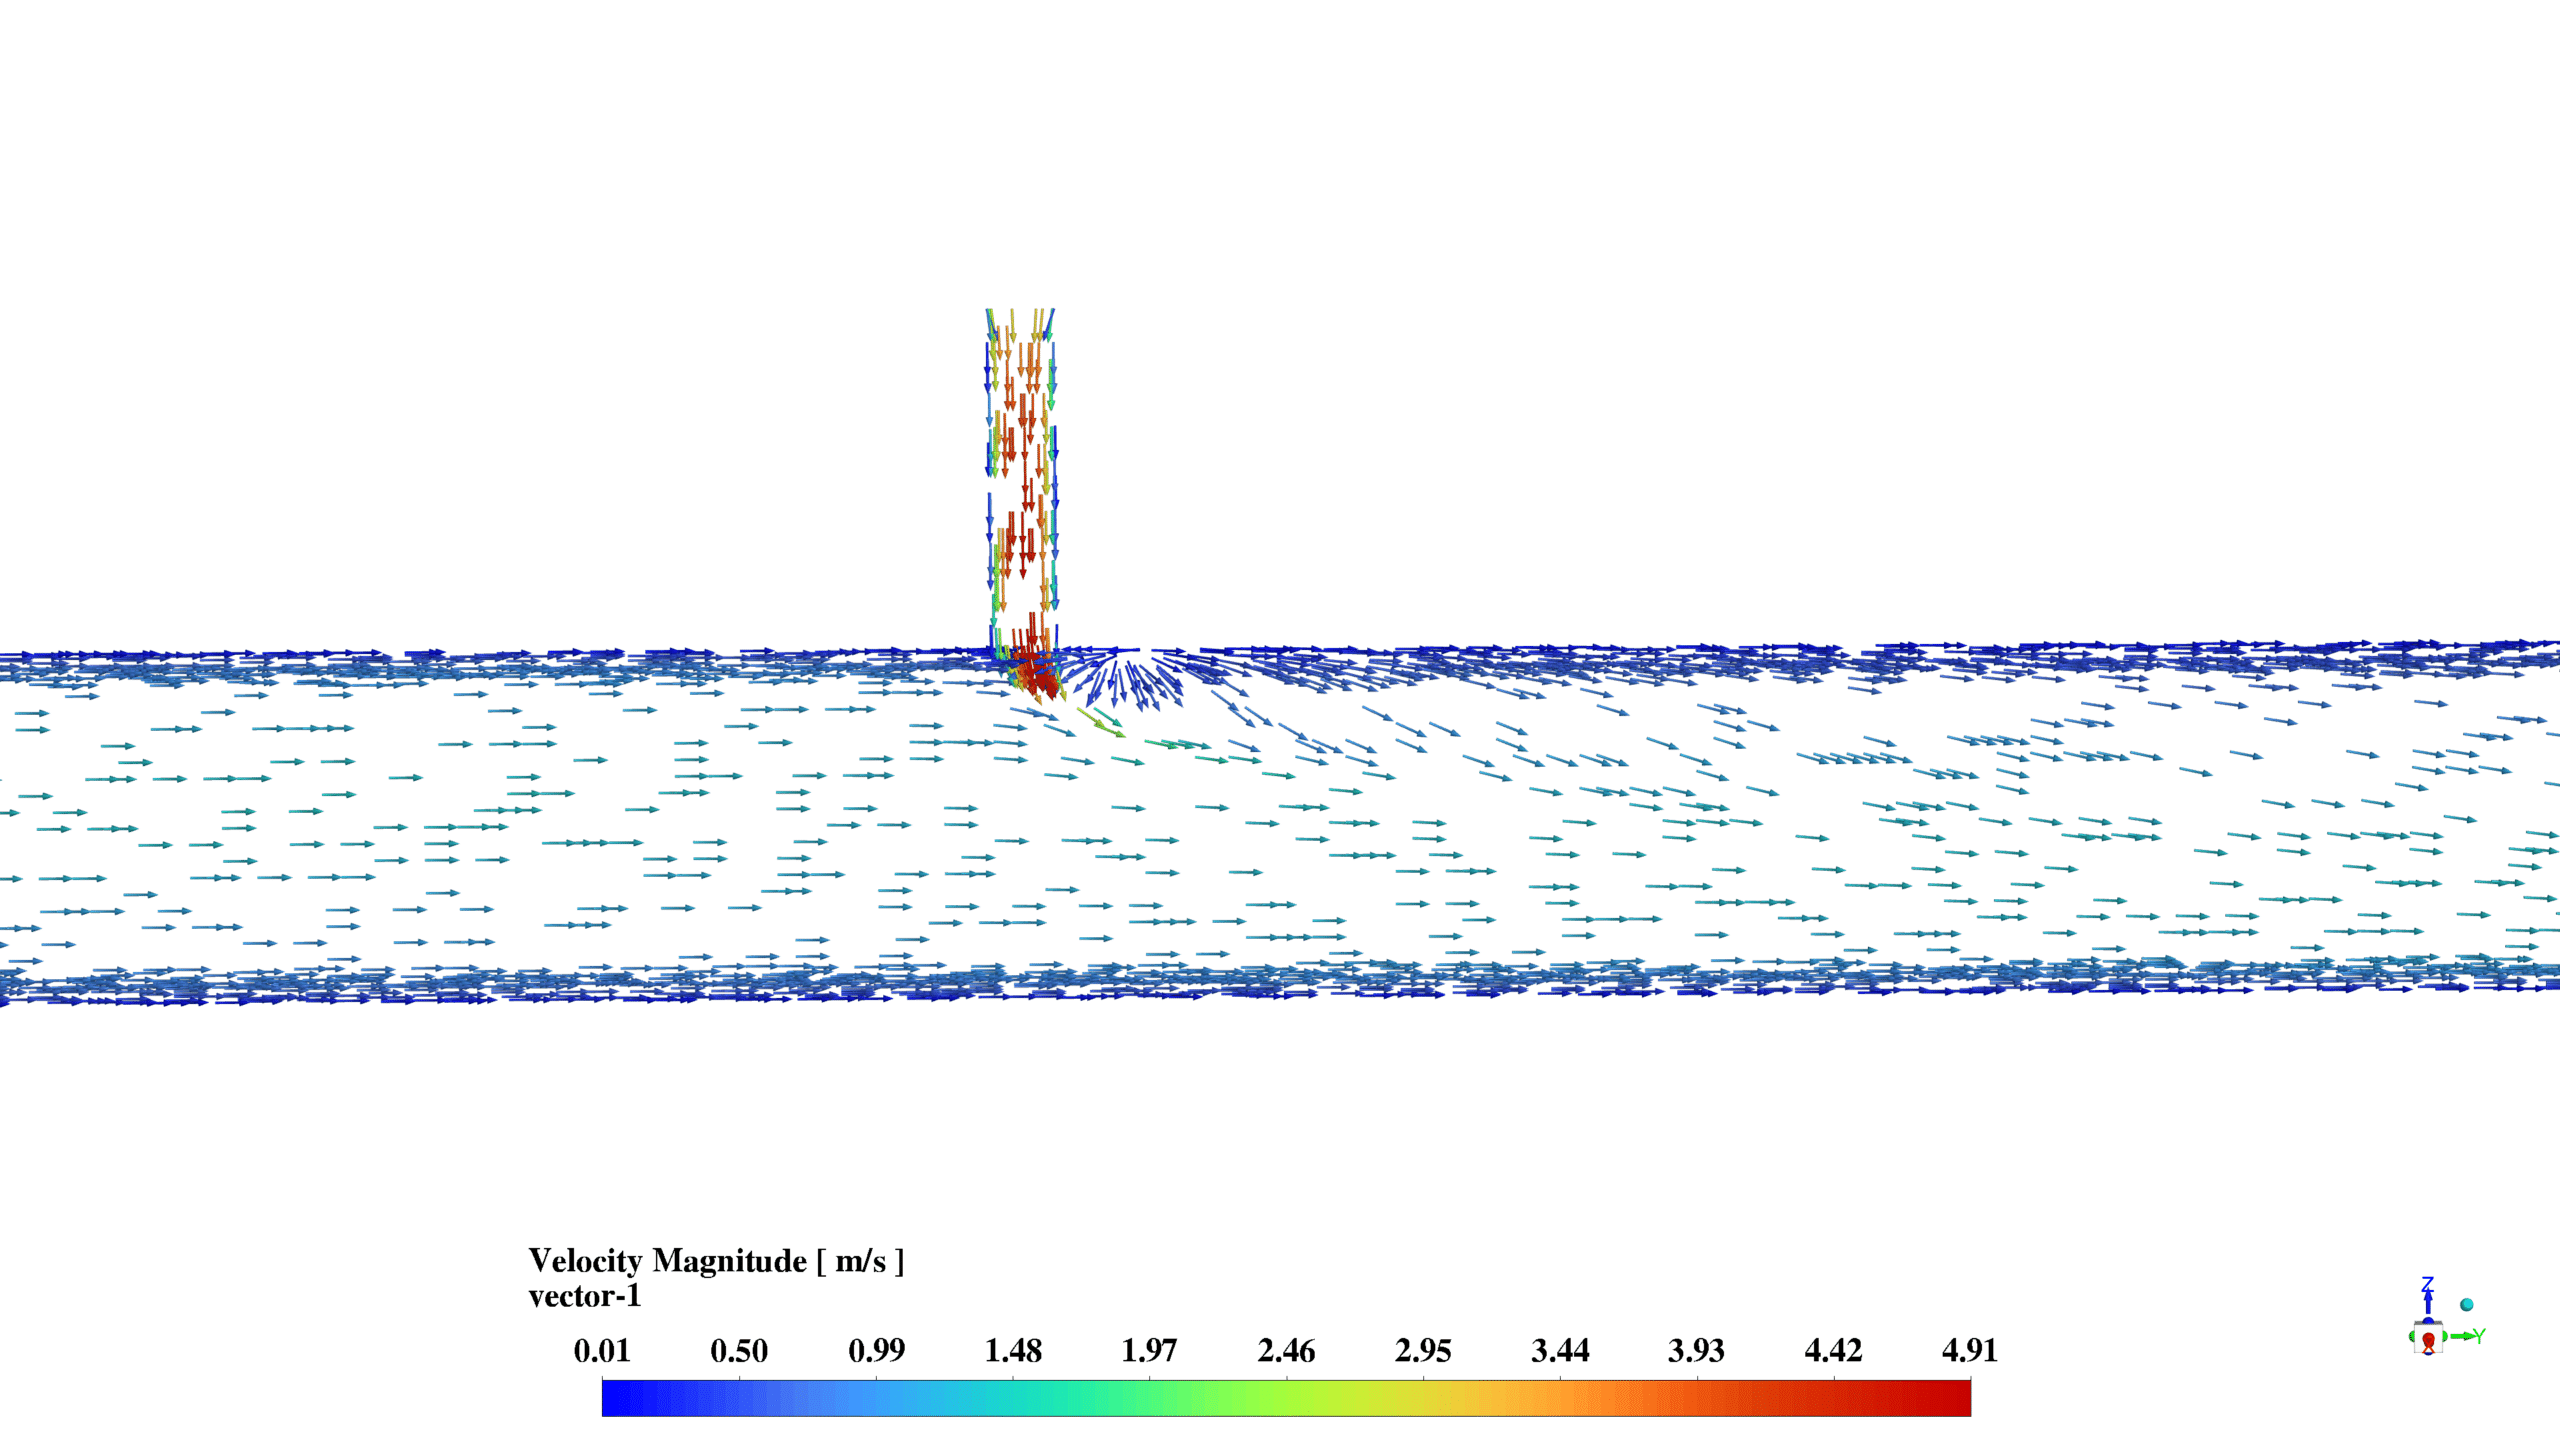
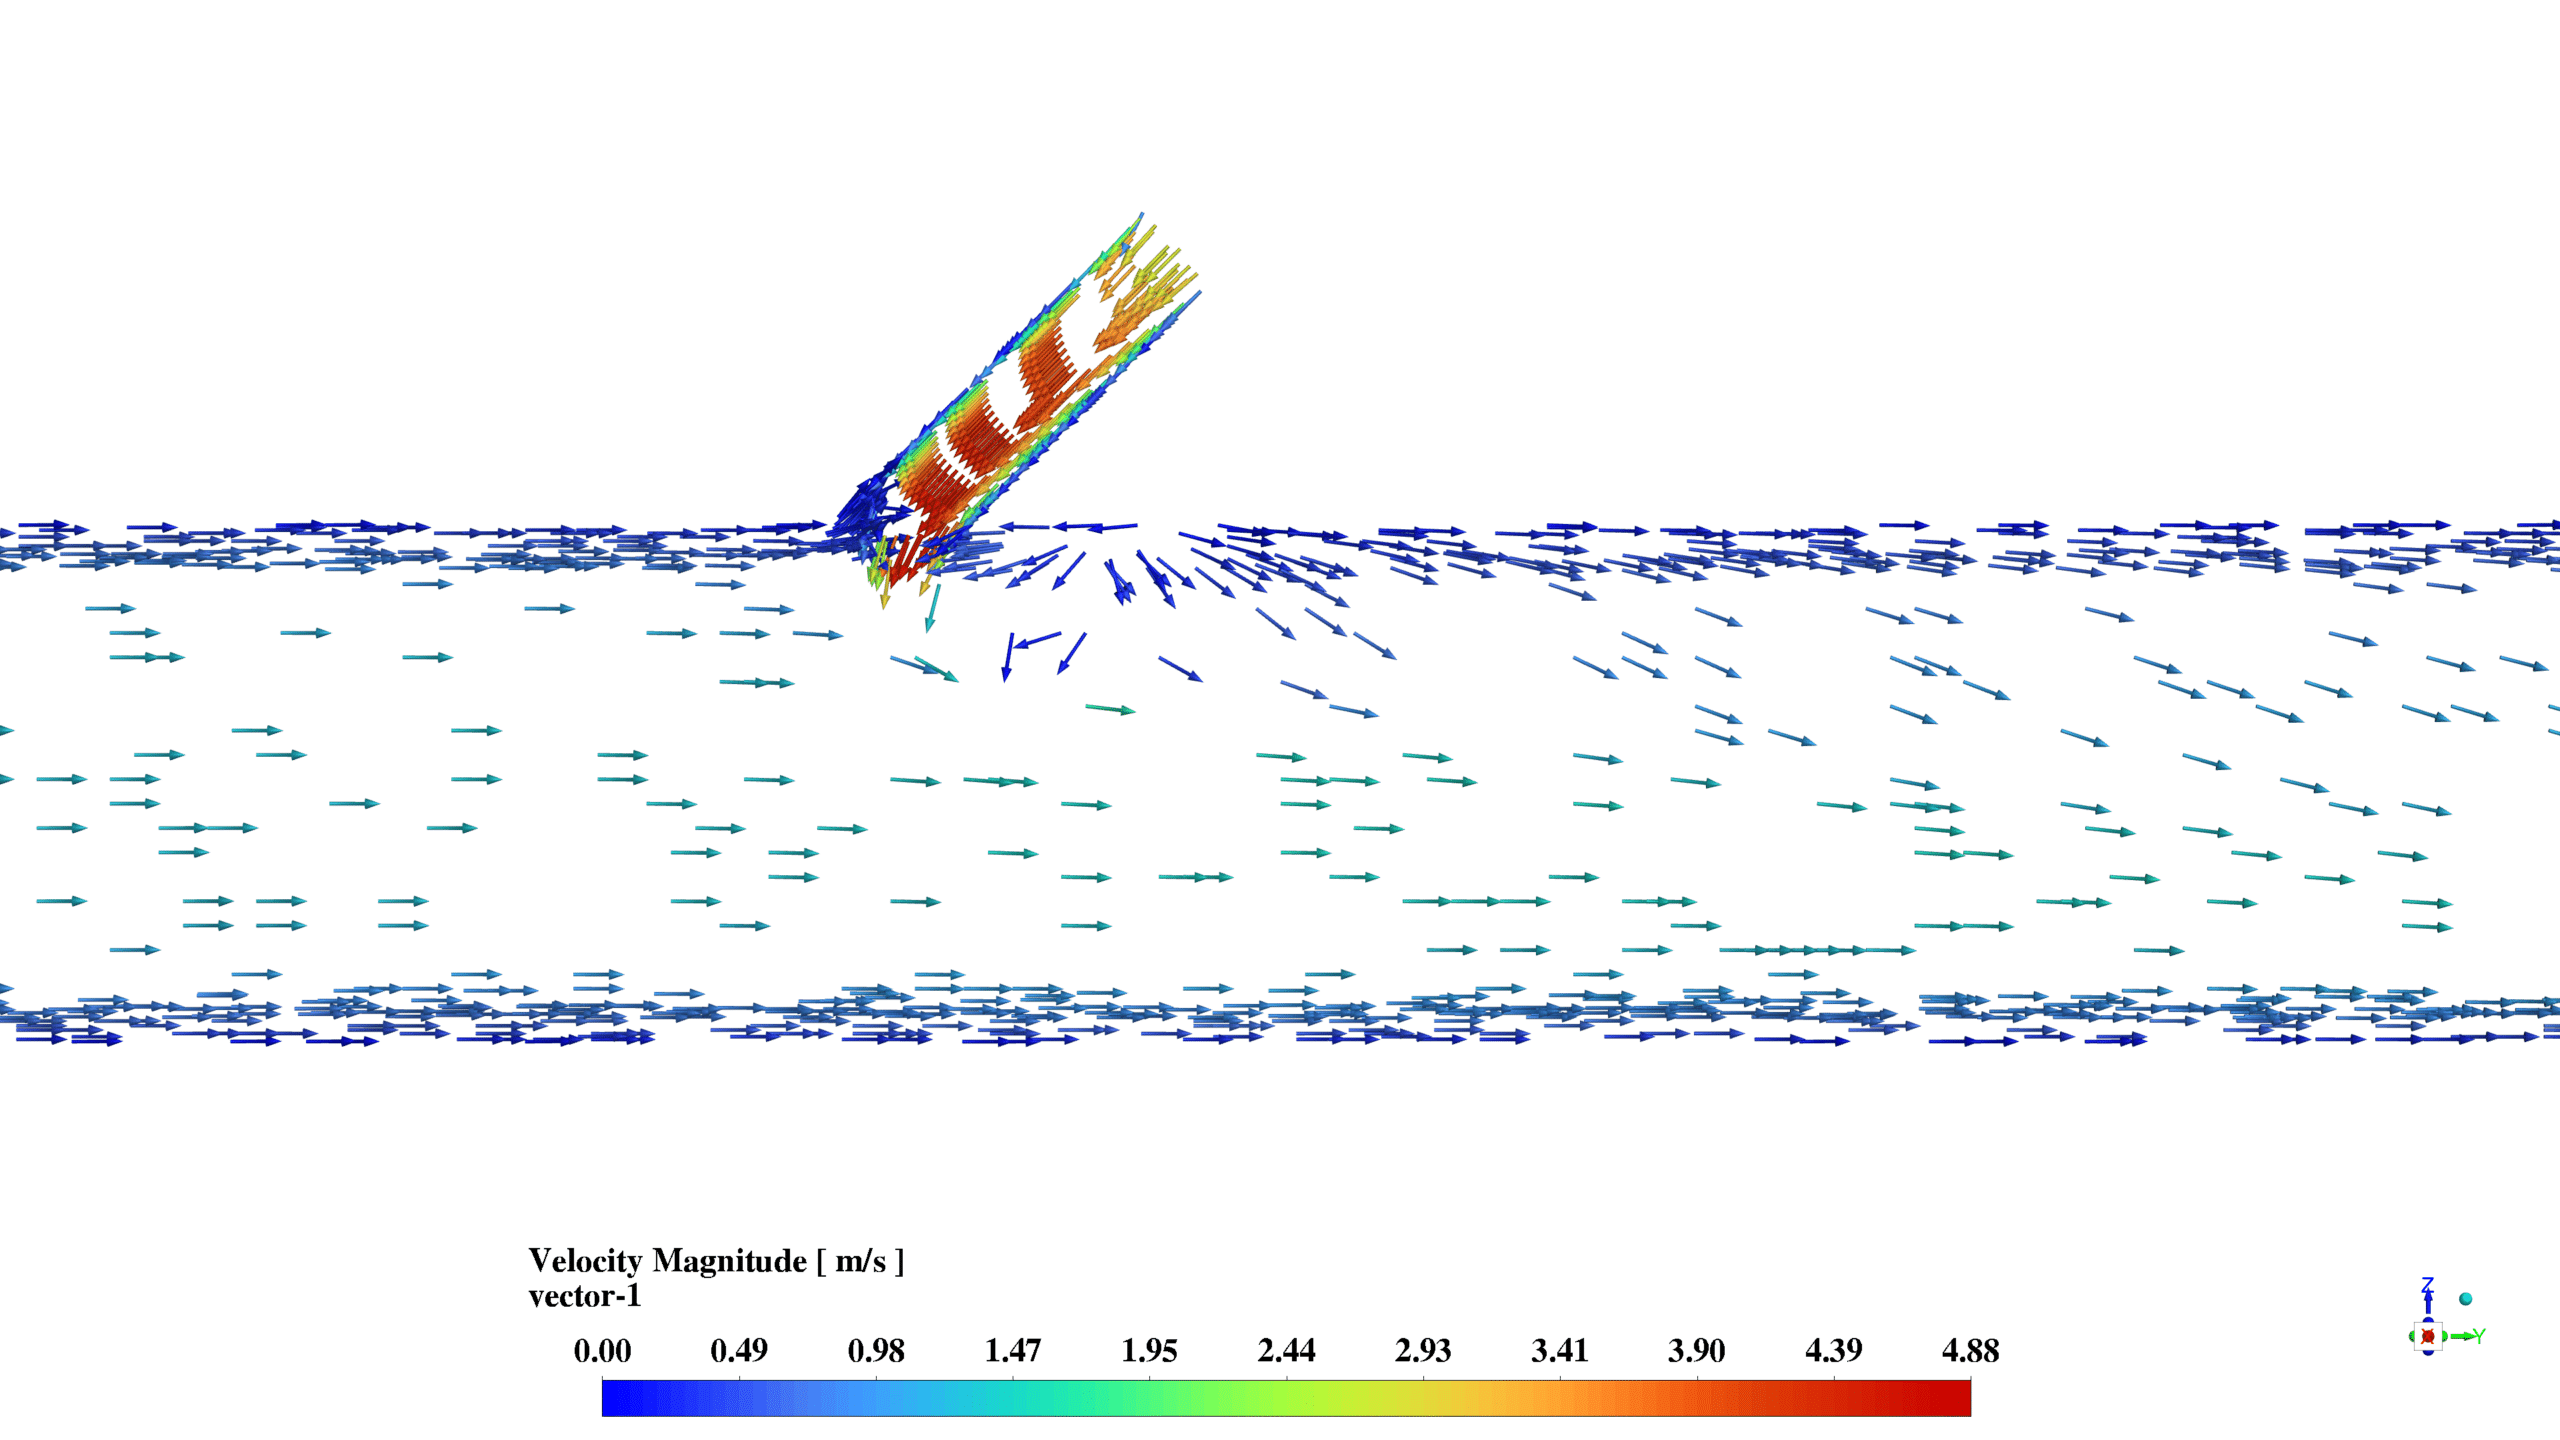
The H2 mass fraction contours show a maximum concentration of 1.00 near the top inlet, gradually decreasing along the length of the pipe as mixing occurs. The velocity magnitude contours indicate a maximum velocity of 4.86 m/s for the T-junction and 4.84 m/s for the Y-junction, with higher velocities observed near the inlets and at the junction points.
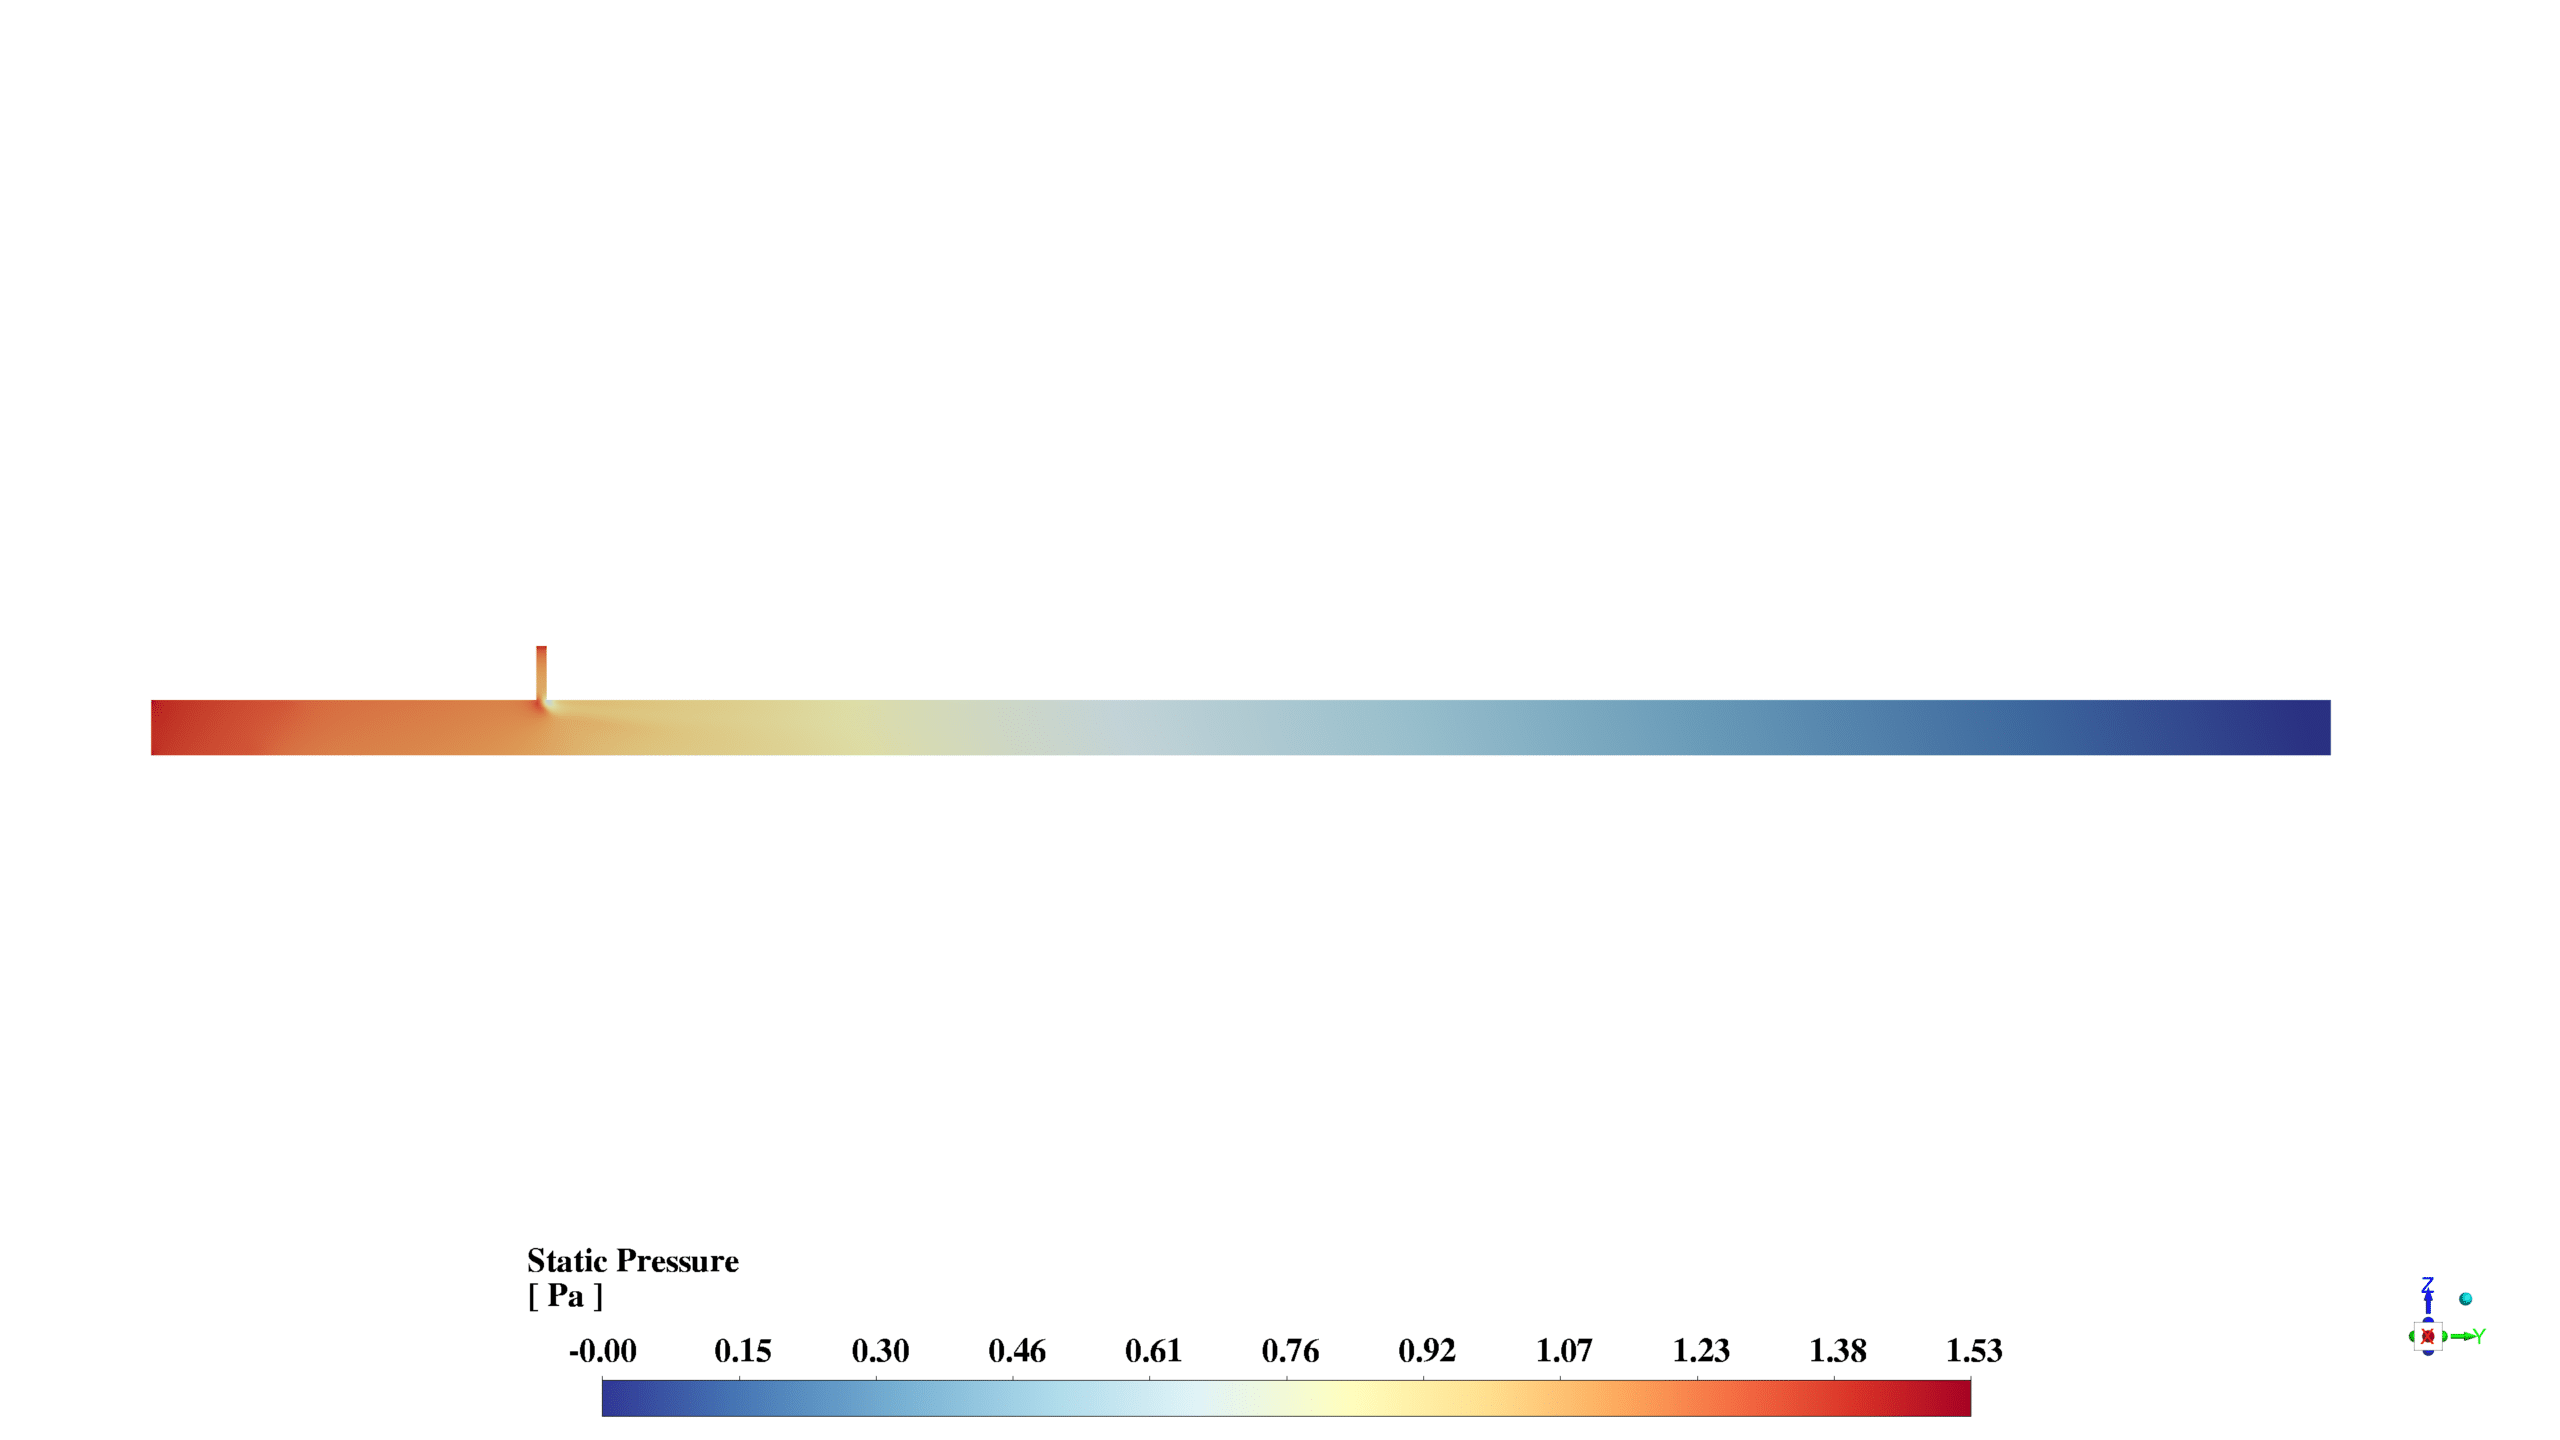
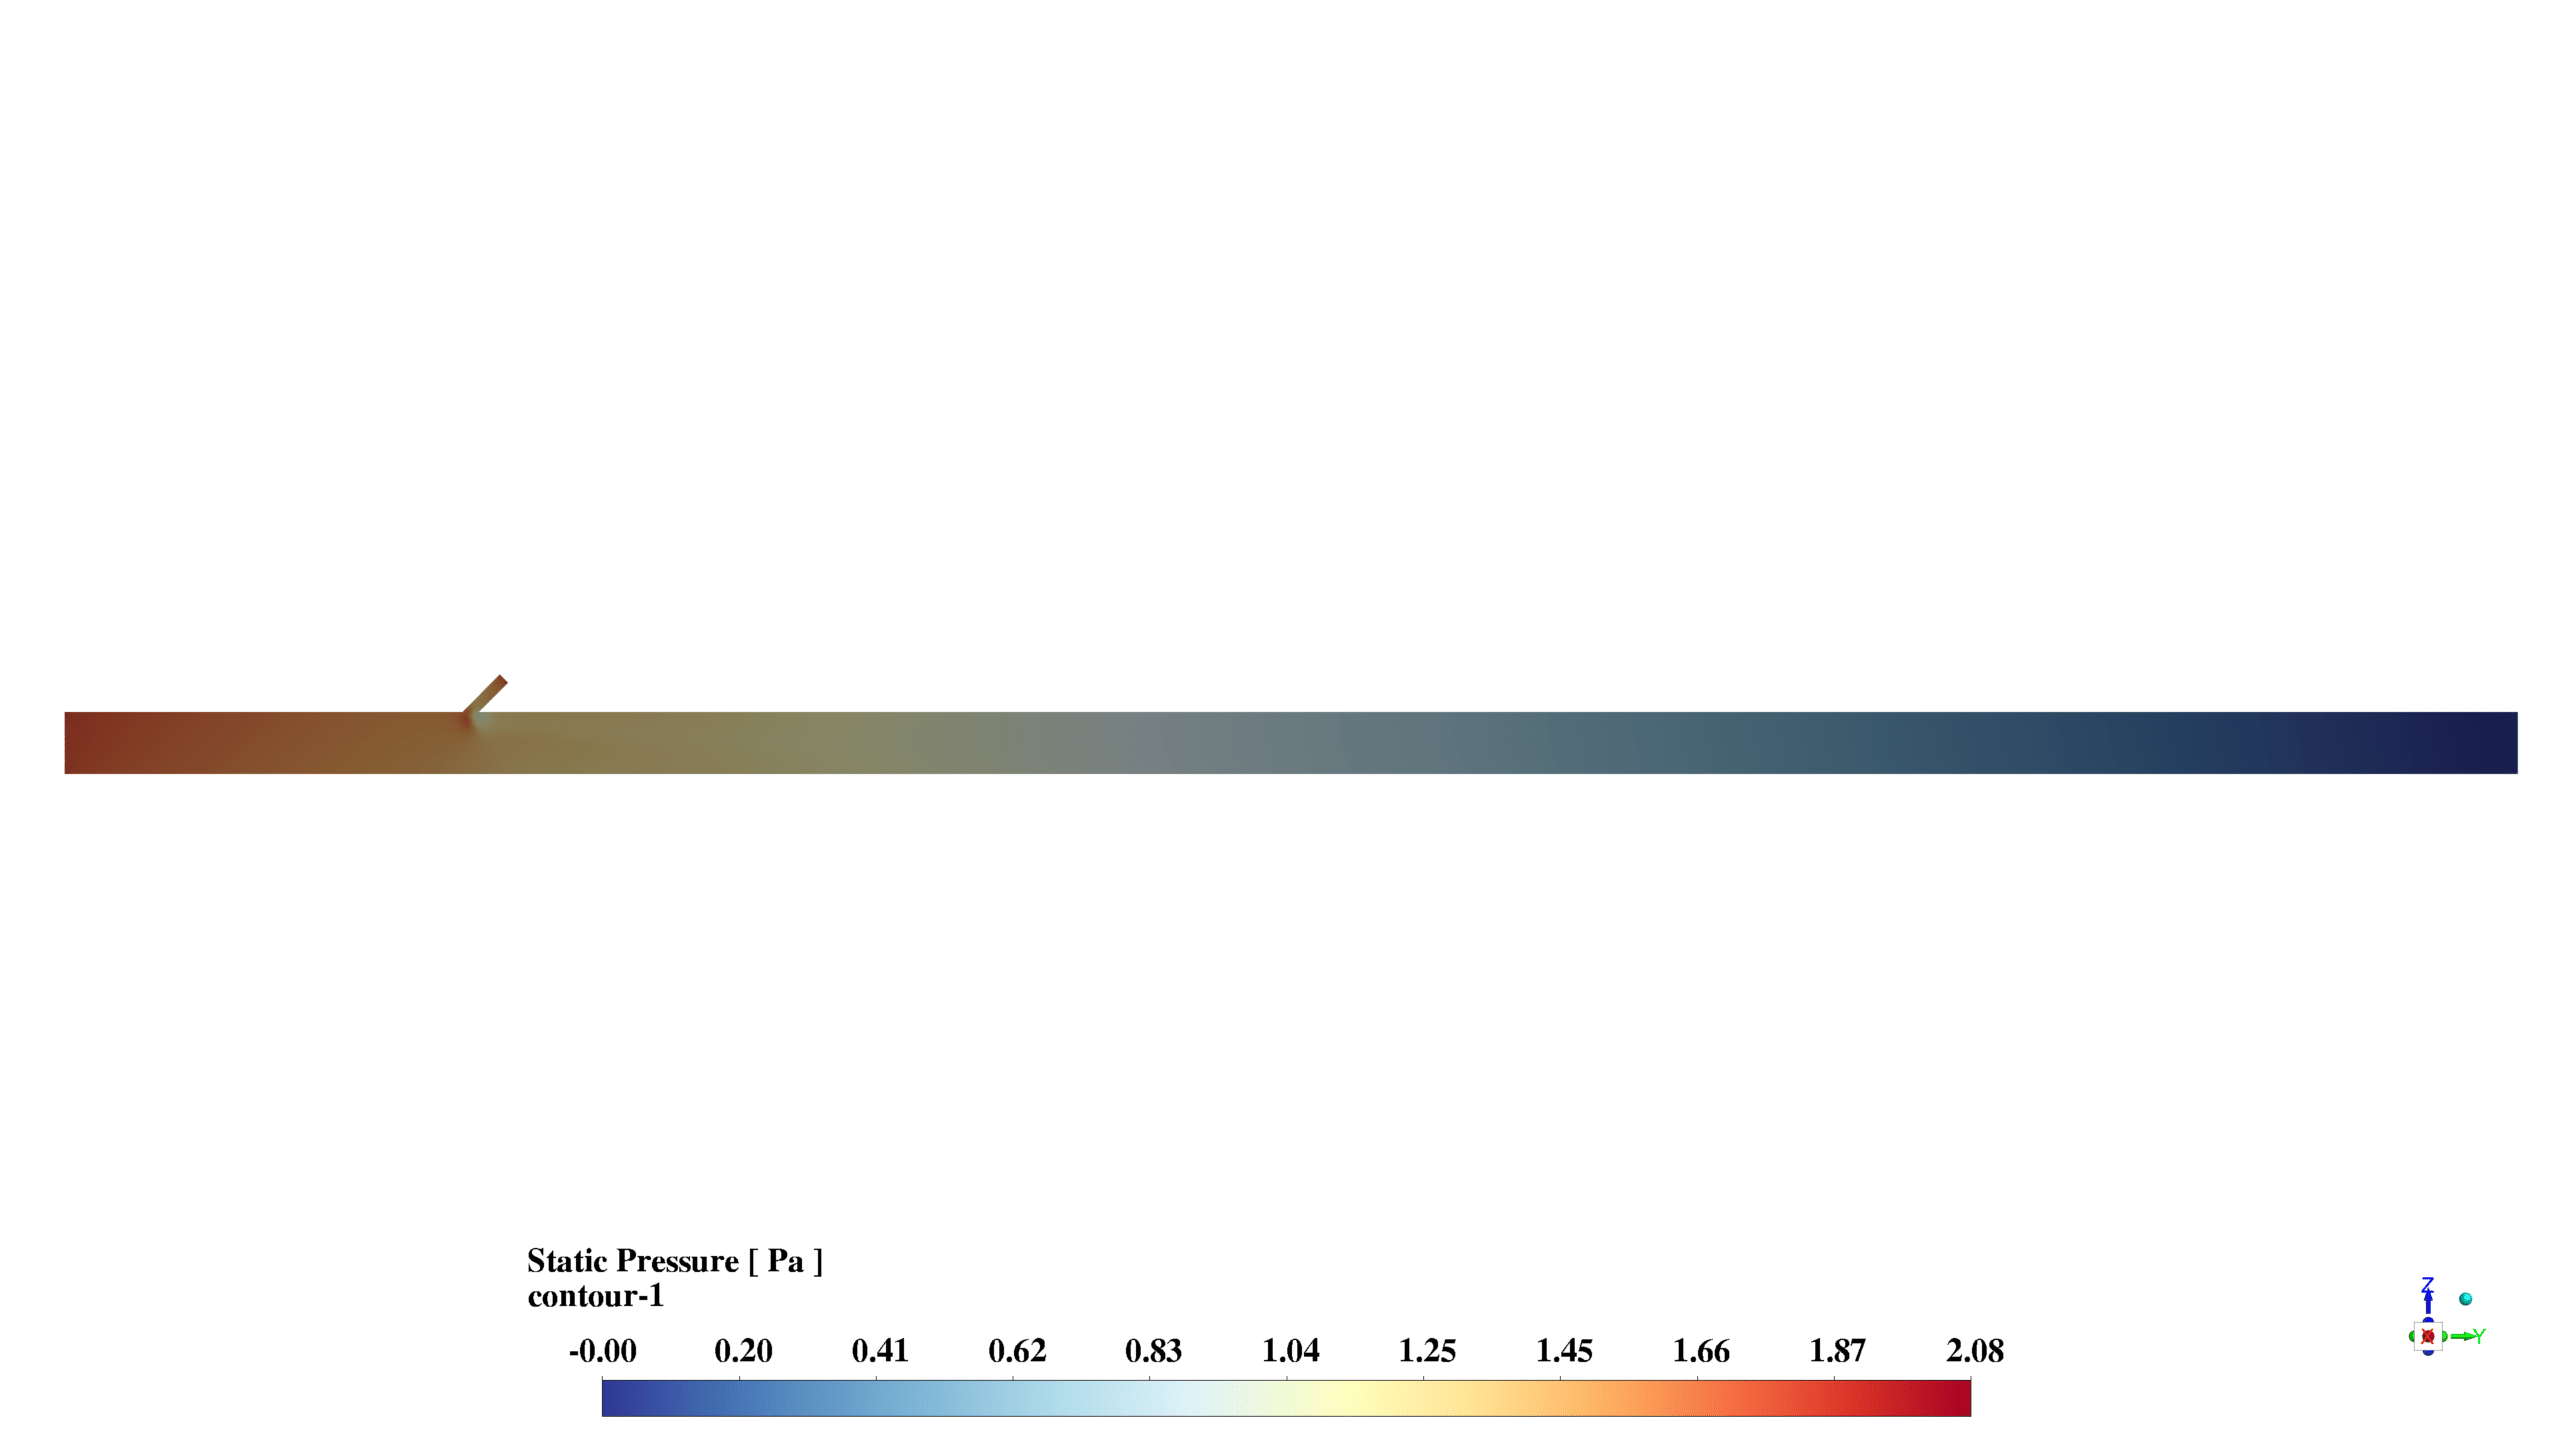
The static pressure contours display a maximum pressure of 1.53 Pa for the T-junction and 2.08 Pa for the Y-junction, with higher pressures at the inlets and a gradual decrease along the pipe length.
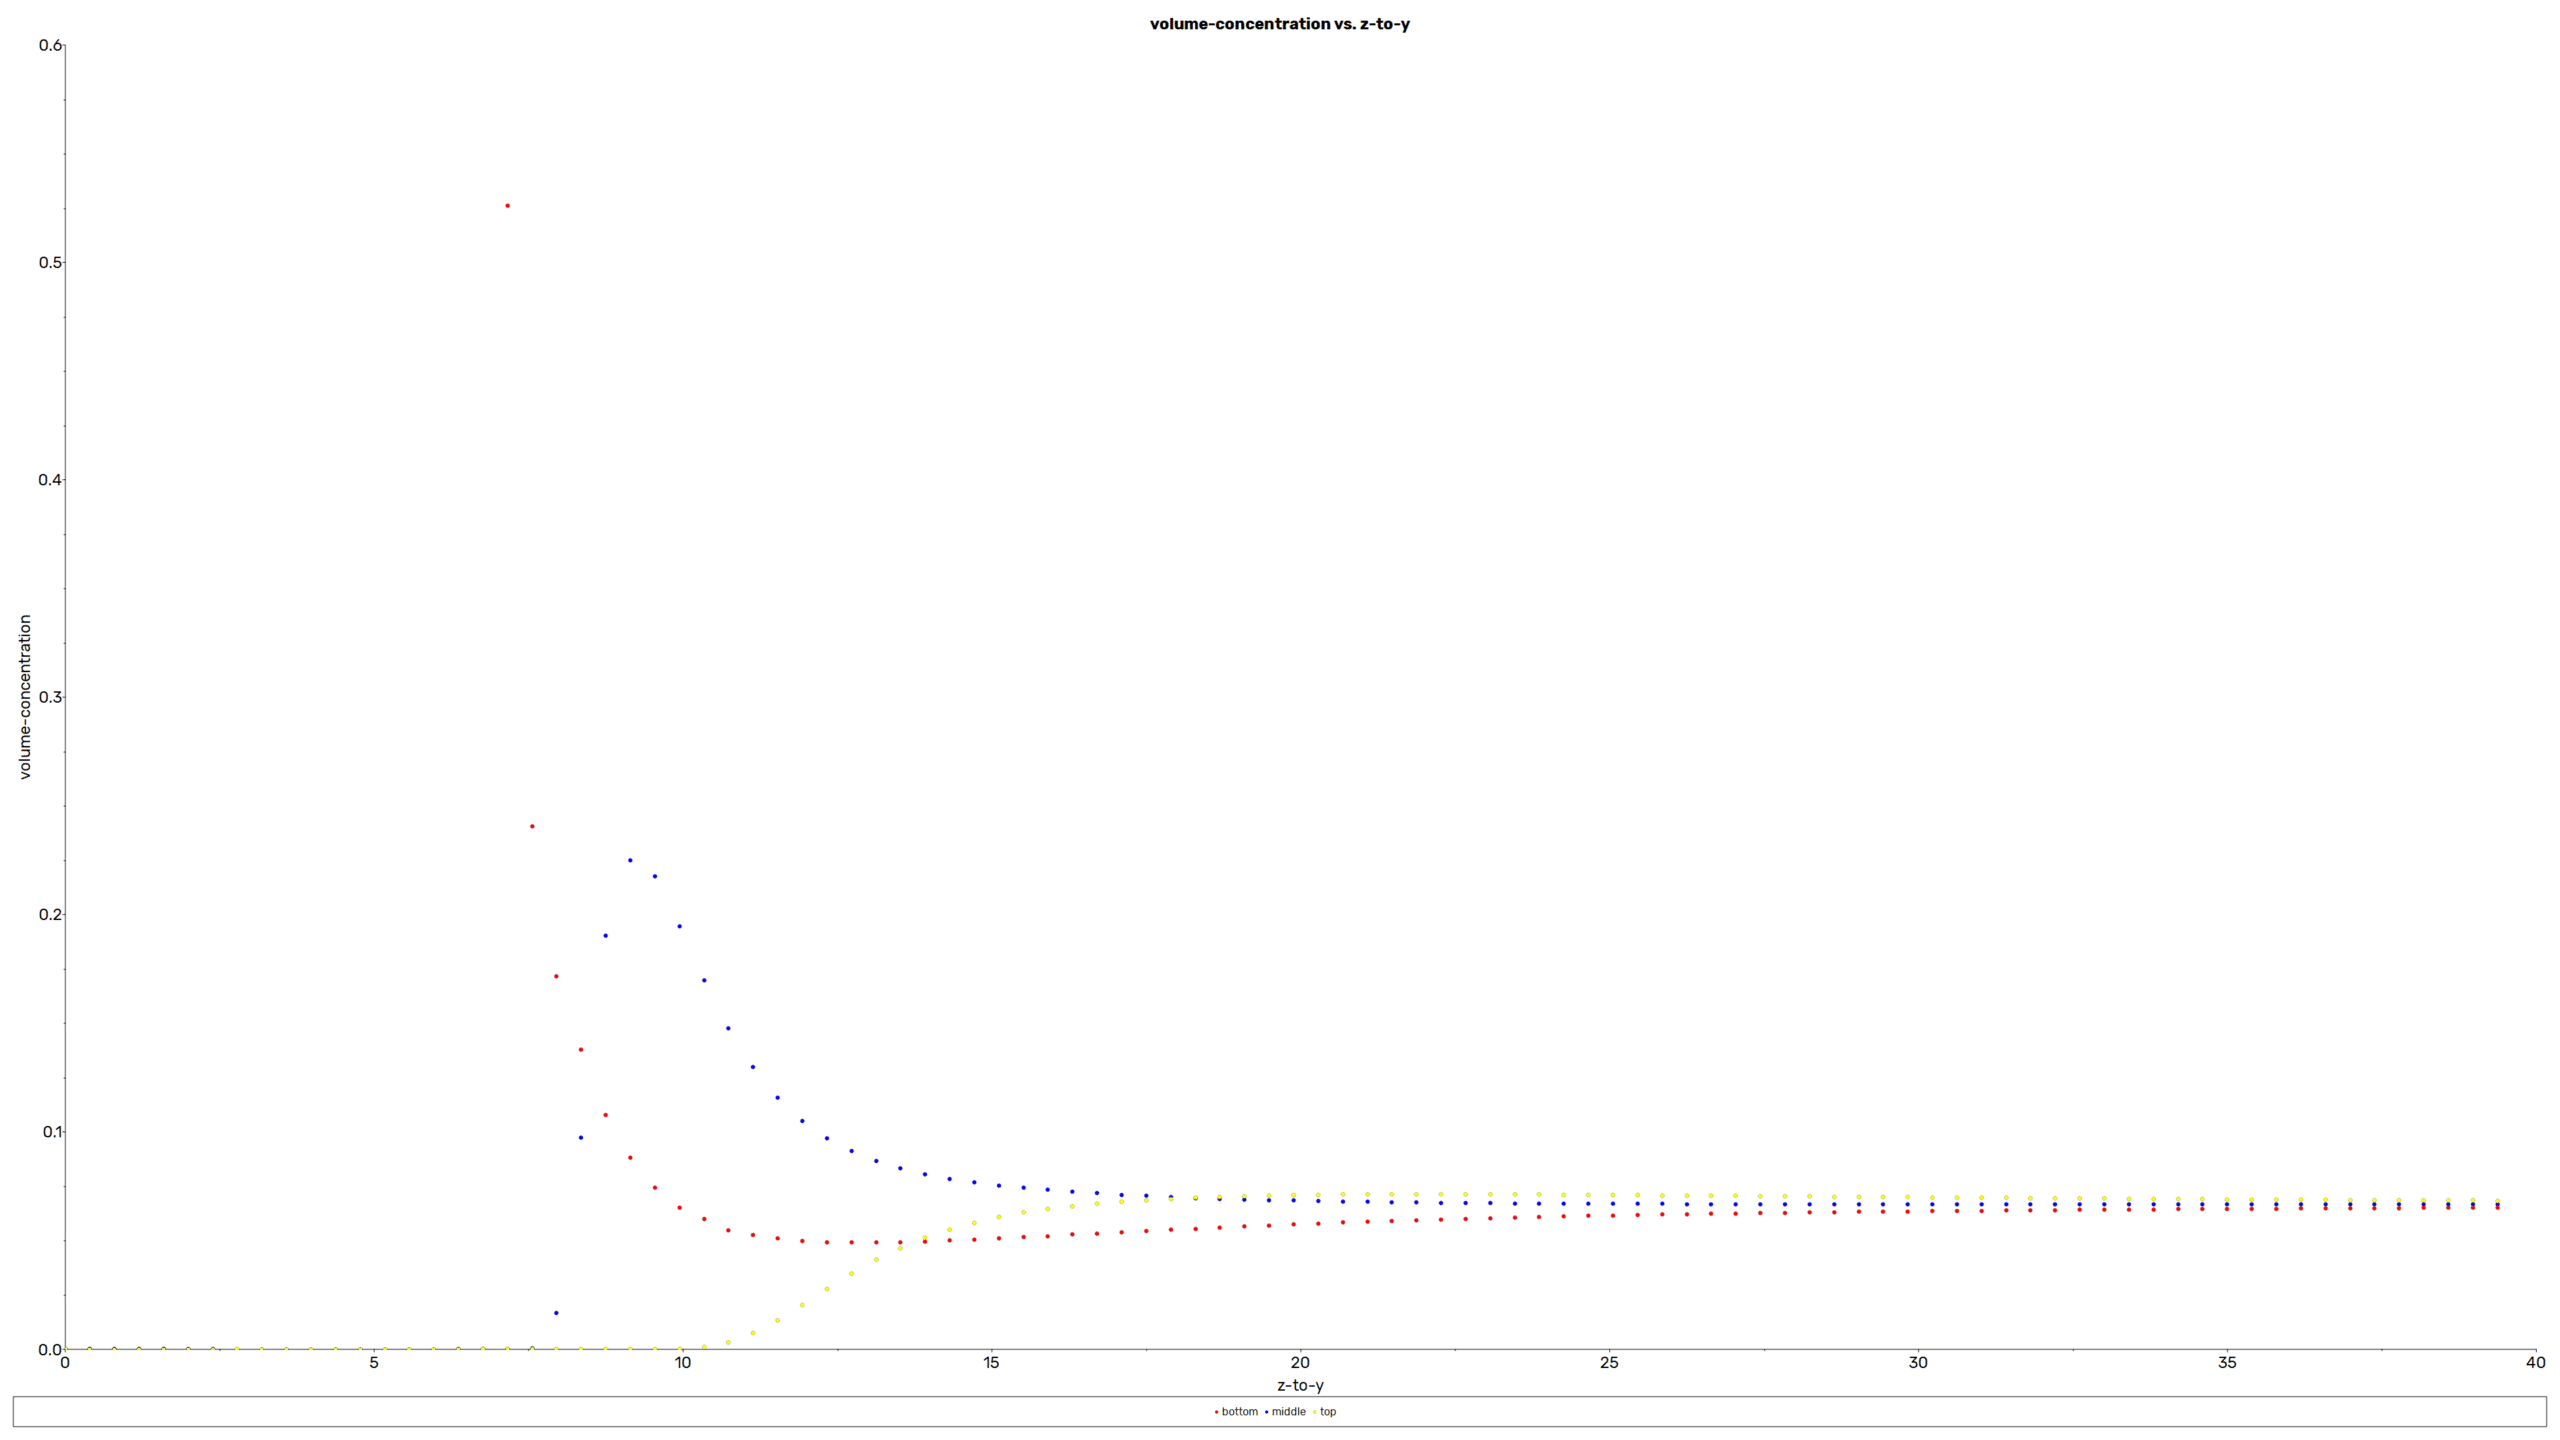
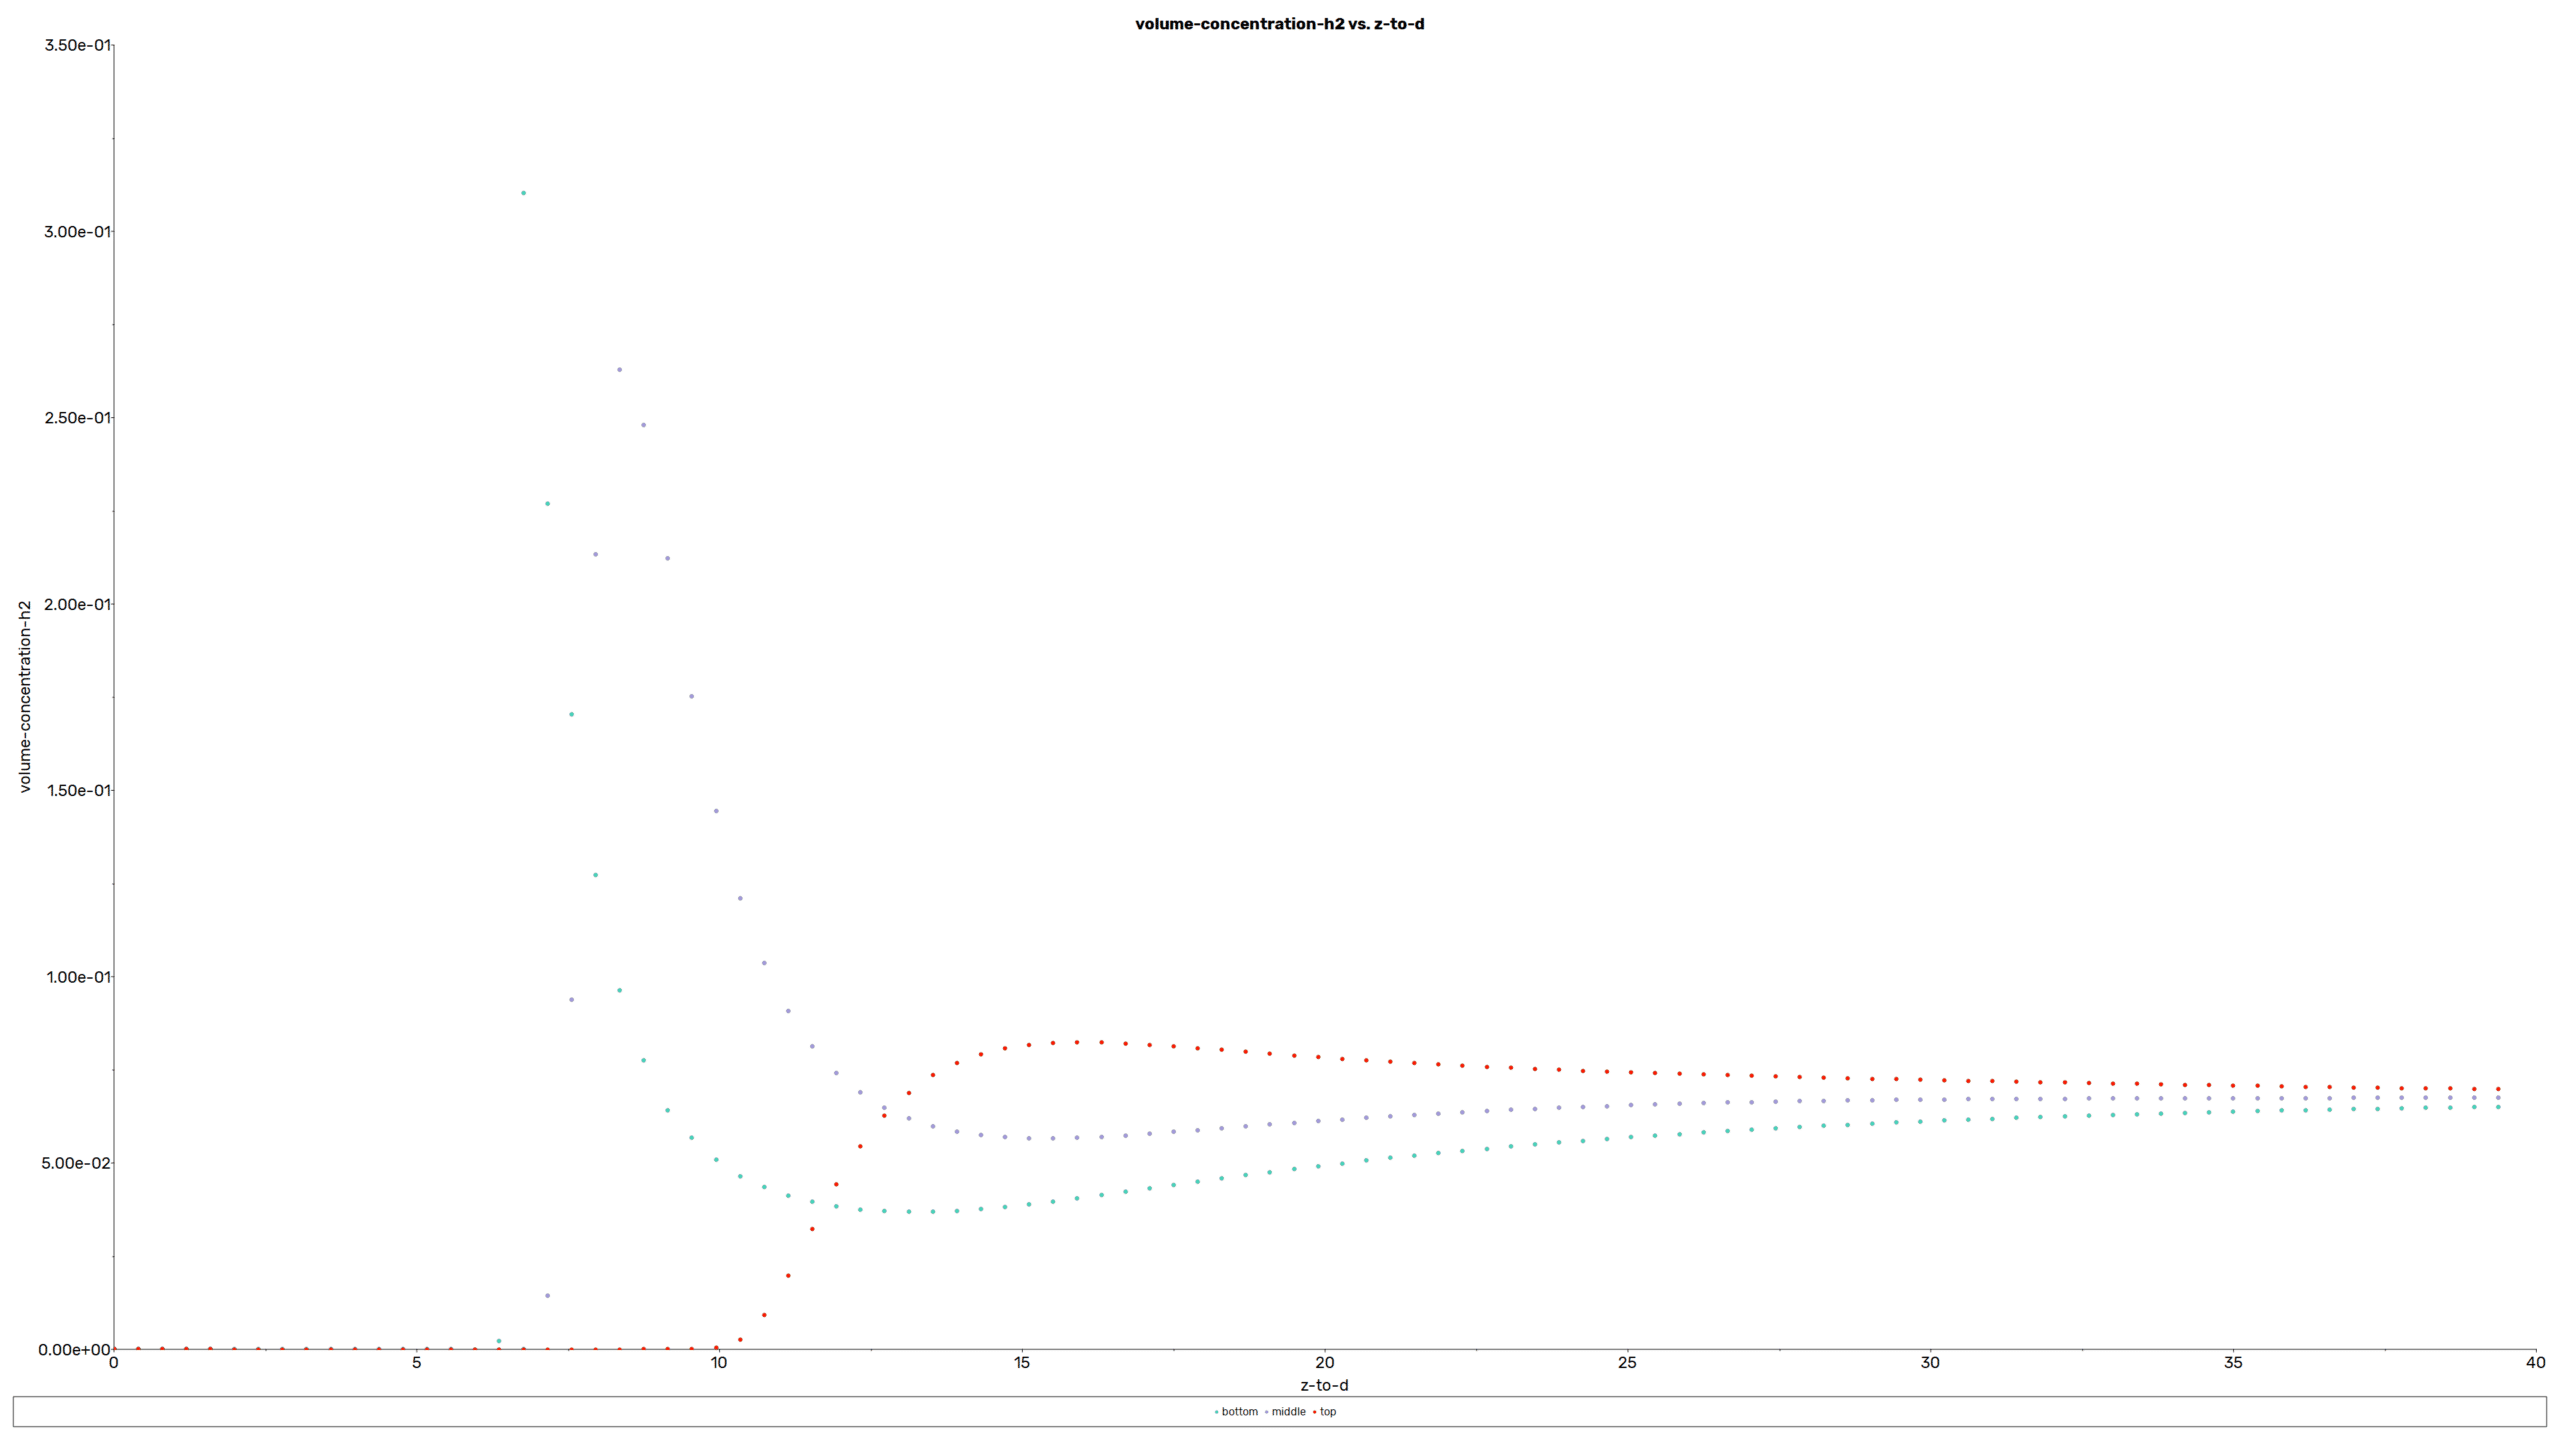
The volume concentration plot shows the evolution of species concentration along the pipe length at three different lines drawn at the bottom, middle, and top of the channel. There are rapid changes near the inlet and more stable concentrations towards the outlet.
The simulation results demonstrate the complex interactions between fluid flow and species transport in the junction configurations. The Y-junction appears to promote slightly better mixing due to the angled entry of H2, but at the cost of a higher pressure drop compared to the T-junction.
This analysis can be used to optimize junction designs for improved mixing efficiency in gas blending applications. Further studies could explore the effects of varying inlet velocities, different junction angles, or alternative gas compositions on the mixing process.


Reviews
There are no reviews yet.