Evaporation-Condensation Process in a Porous Heat Exchanger
$200.00 $100.00 Student Discount
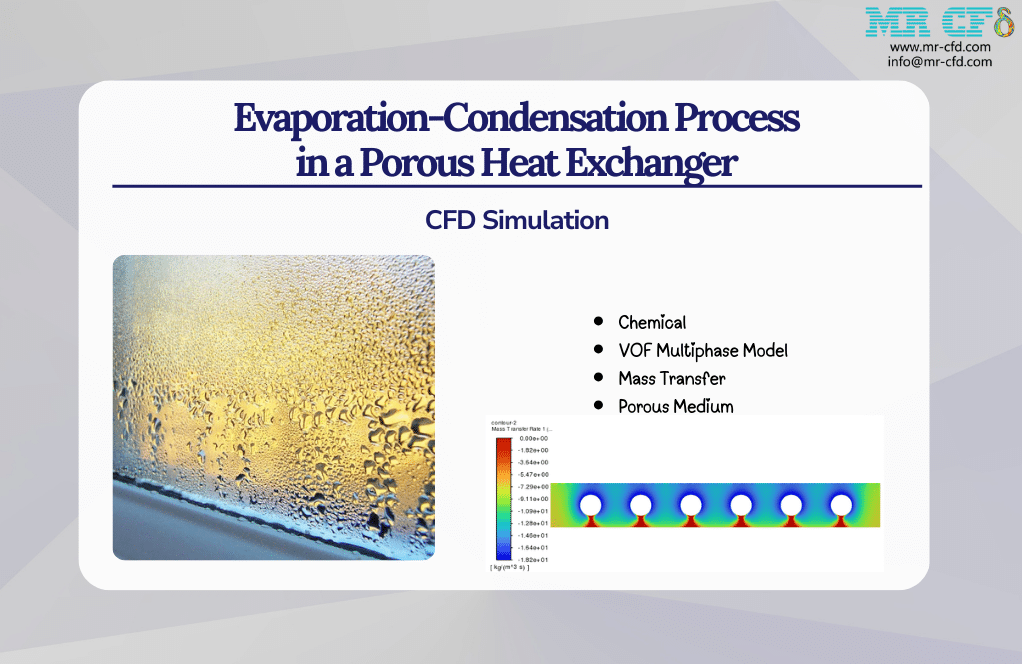
- The study investigates Evaporation-Condensation Process in a Porous Heat Exchanger using ANSYS Fluent.
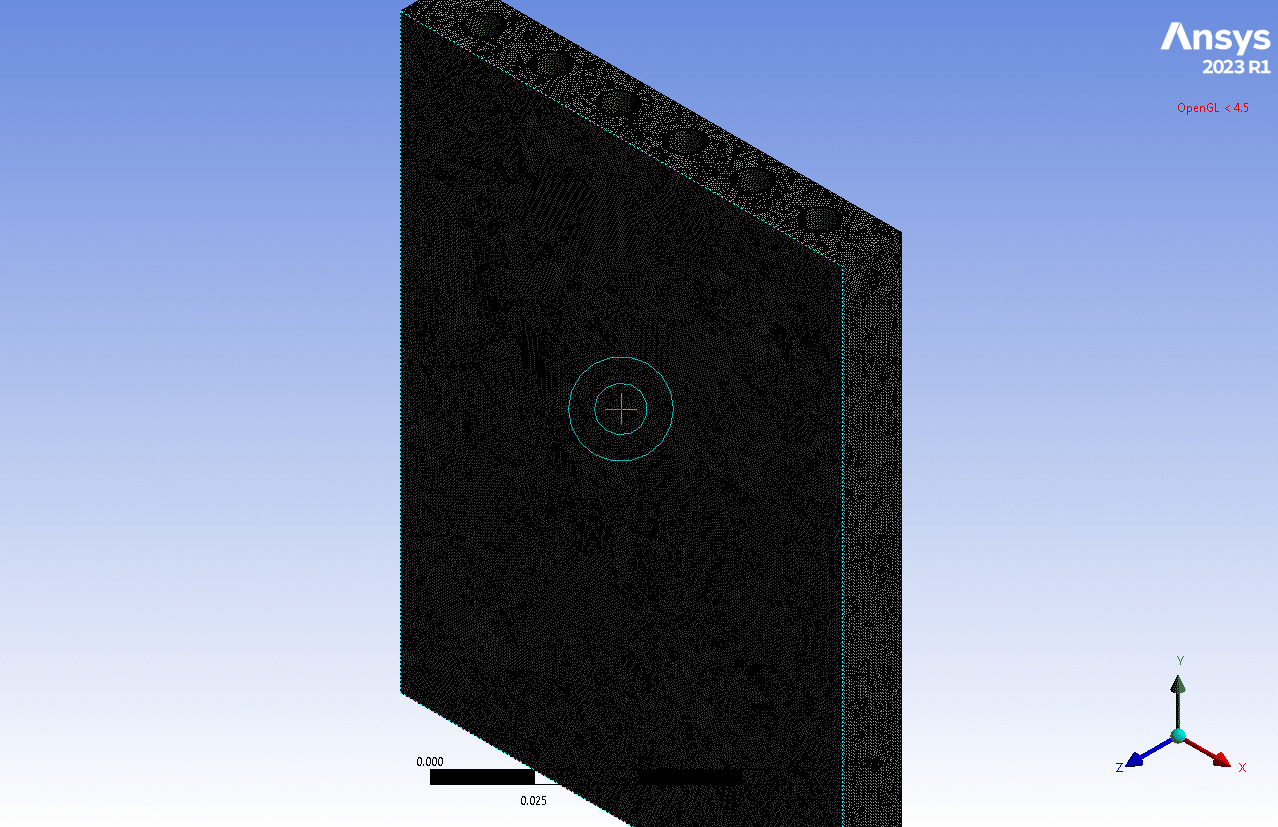
- The geometry is created in ANSYS Design Modeler, with a mesh of 8,777,268 elements generated using ANSYS Meshing.
- The simulation employs a pressure-based transient solver with the k-epsilon turbulence model and Volume of Fluid (VOF) multiphase model.
- It conducts a time-dependent analysis with enabled condensation in mass transfer mechanisms to simulate phase change from vapor to liquid water.
- Also, the domain is considered to be porous.
To Order Your Project or benefit from a CFD consultation, contact our experts via email (info@mr-cfd.com), online support tab, or WhatsApp at +44 7443 197273.
There are some Free Products to check our service quality.
If you want the training video in another language instead of English, ask it via info@mr-cfd.com after you buy the product.
Description
Introduction
This study investigates the performance of a porous heat exchanger using Computational Fluid Dynamics (CFD) simulation, focusing on the evaporation-condensation process. The simulation was conducted using ANSYS Fluent, a powerful CFD software package. The study aims to analyze the complex multiphase flow, heat transfer, and phase change phenomena occurring within the heat exchanger, providing valuable insights into its operation and efficiency.
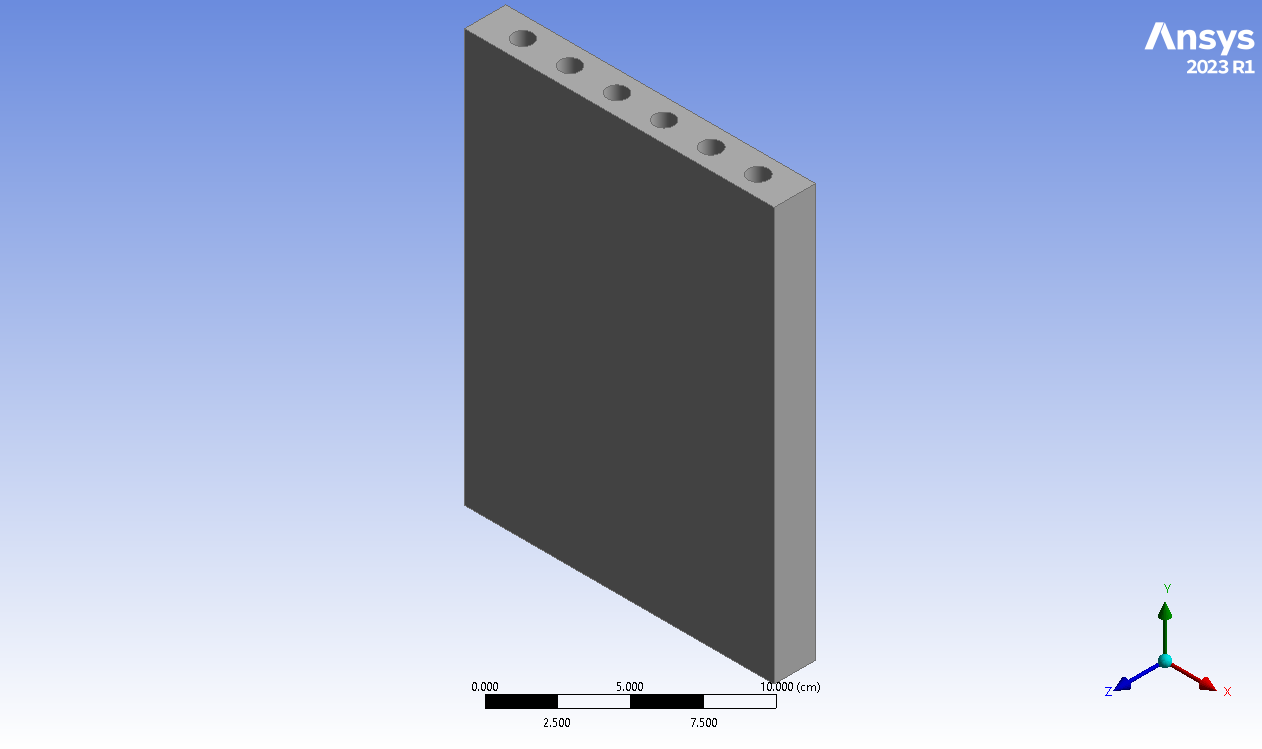
The geometry of the heat exchanger, consisting of a series of circular pipes within a rectangular domain, was created using ANSYS Design Modeler. The computational domain was then discretized using ANSYS Meshing, resulting in a high-resolution mesh of 8,777,268 elements, ensuring accurate capture of the flow and heat transfer phenomena.
Methodology
The simulation setup included a pressure-based solver in a transient state, allowing for time-dependent analysis of the flow and heat transfer processes.
The Volume of Fluid (VOF) multiphase model was employed with implicit formulation to capture the interaction between water and vapor phases. The evaporation-condensation mechanism was enabled to simulate the phase change process.
For turbulence modeling, the standard k-epsilon model with standard wall function was selected, providing a robust approach for capturing the complex flow patterns around the pipes. The energy equation was solved to account for heat transfer throughout the domain.
The domain was modeled as a porous medium to represent the complex internal structure of the heat exchanger. This approach allows for a more realistic representation of the flow resistance and heat transfer characteristics within the exchanger.
Results
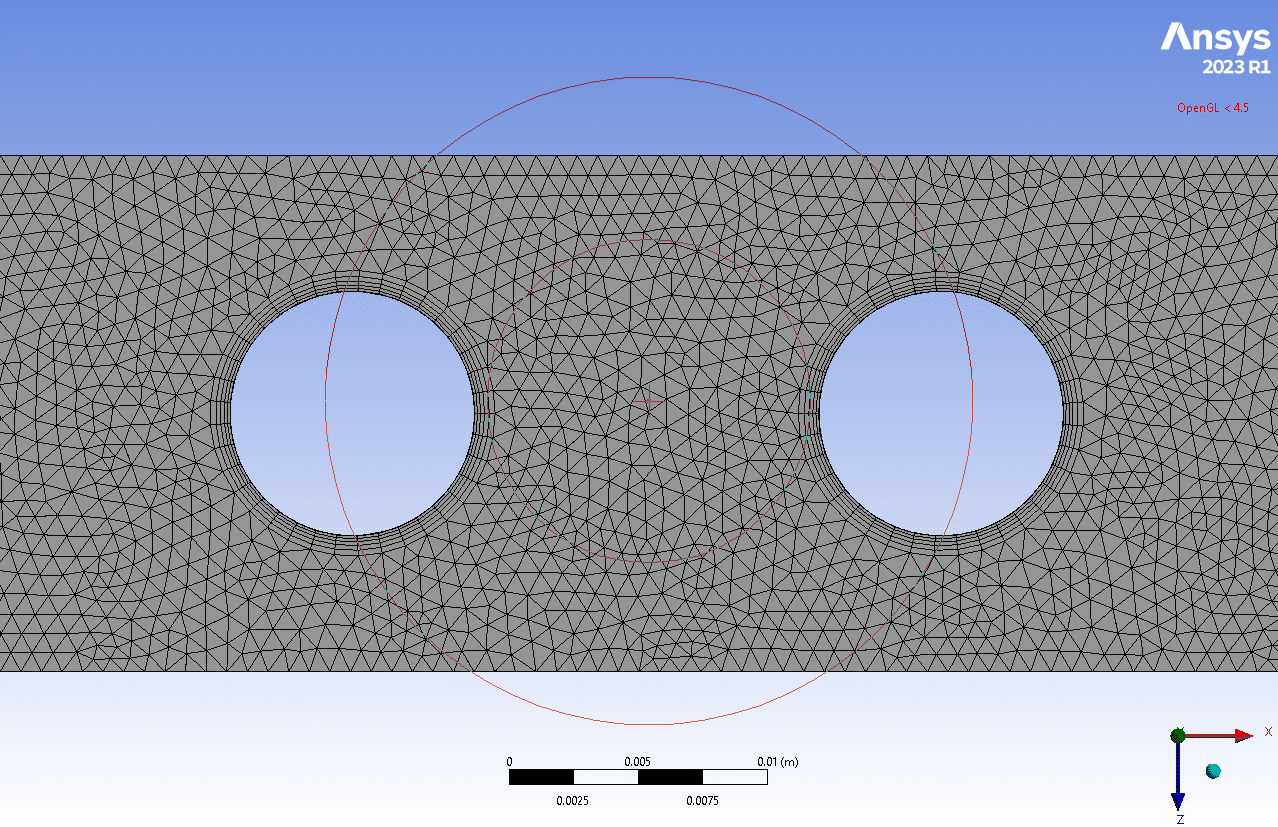
The mesh visualization demonstrates a well-structured grid with refinement near the pipes to capture the complex flow and heat transfer features accurately. The high element count ensures that the simulation can resolve fine-scale phenomena critical to the evaporation-condensation process.
The mass transfer rate contour reveals significant activity around the pipes, indicating regions where phase change occurs. The red areas represent evaporation, while the blue areas indicate condensation. This pattern is consistent with the expected behavior in a heat exchanger, where the pipes act as condensing surfaces for the incoming vapor.
The static temperature contour shows a clear temperature gradient across the heat exchanger. The incoming fluid (likely steam) at higher temperatures (red) cools as it flows across the pipes, resulting in lower temperatures (blue) near the pipe surfaces. This temperature distribution drives the condensation process and illustrates the heat exchanger’s effectiveness in transferring thermal energy.
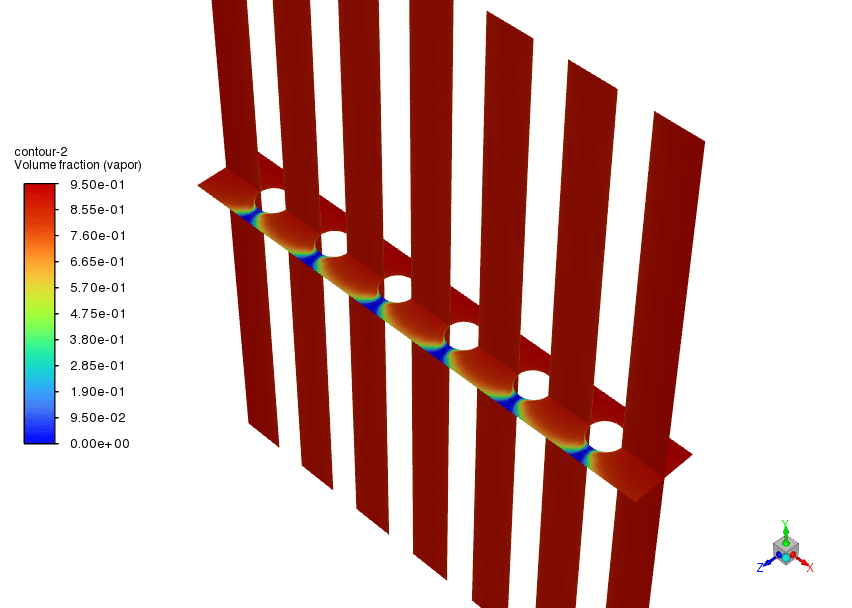
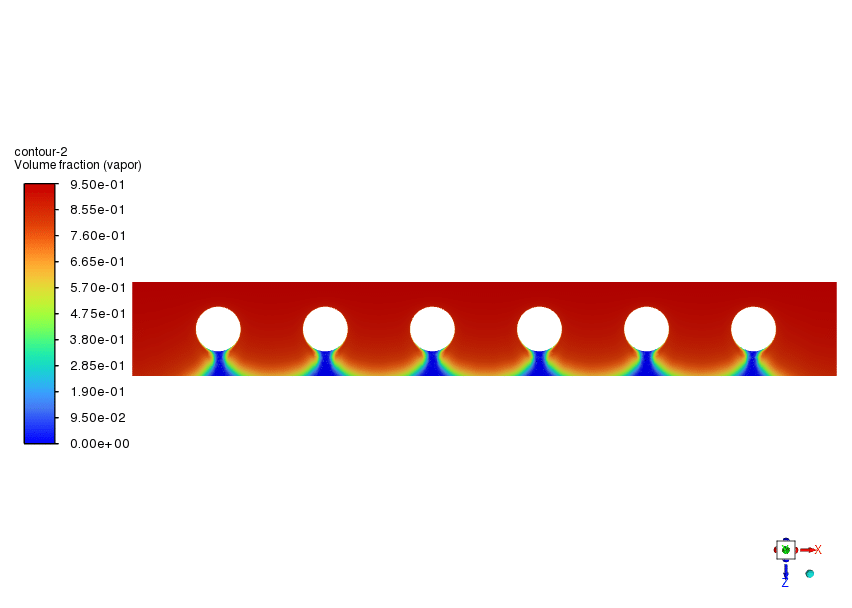
The vapor volume fraction plots provide insight into the phase distribution within the heat exchanger. The high vapor fraction (red) in the bulk flow region and the lower fraction (blue) near the pipes indicate where condensation is occurring. The 3D visualization of the vapor fraction further emphasizes the spatial distribution of the phase change process throughout the heat exchanger.
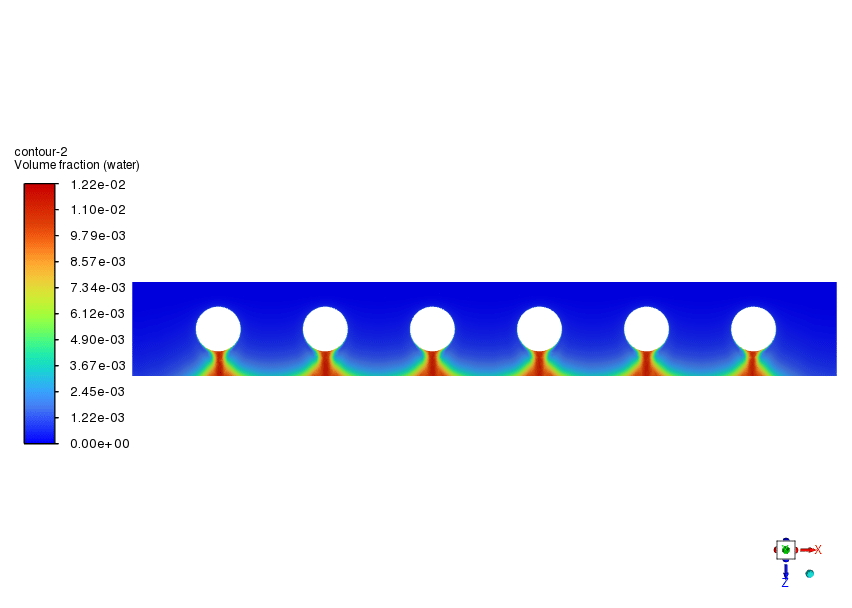
The water volume fraction contour complements the vapor fraction plot, showing the accumulation of liquid water near the pipe surfaces as a result of condensation. The higher water fraction (red) below the pipes suggests the collection of condensate due to gravity.
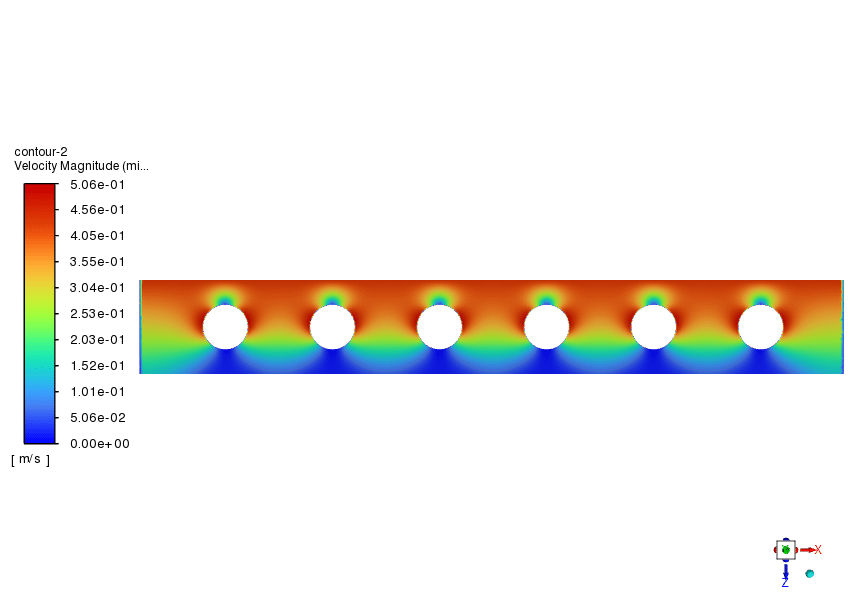
The velocity magnitude contour illustrates the flow behavior within the heat exchanger. Higher velocities (red and yellow) are observed in the spaces between the pipes, while lower velocities (blue) are seen near the pipe surfaces and in the wake regions. This flow pattern influences both the heat transfer and the condensation process, with potential for increased heat transfer in high-velocity regions and more condensate accumulation in low-velocity areas.
In conclusion, the CFD simulation successfully captured the complex multiphase flow and heat transfer phenomena in the heat exchanger. The results demonstrate the intricate interplay between fluid flow, heat transfer, and phase change processes. The study highlights the effectiveness of the heat exchanger design in promoting condensation and provides valuable insights for potential optimization of heat transfer efficiency and condensate management.




Reviews
There are no reviews yet.