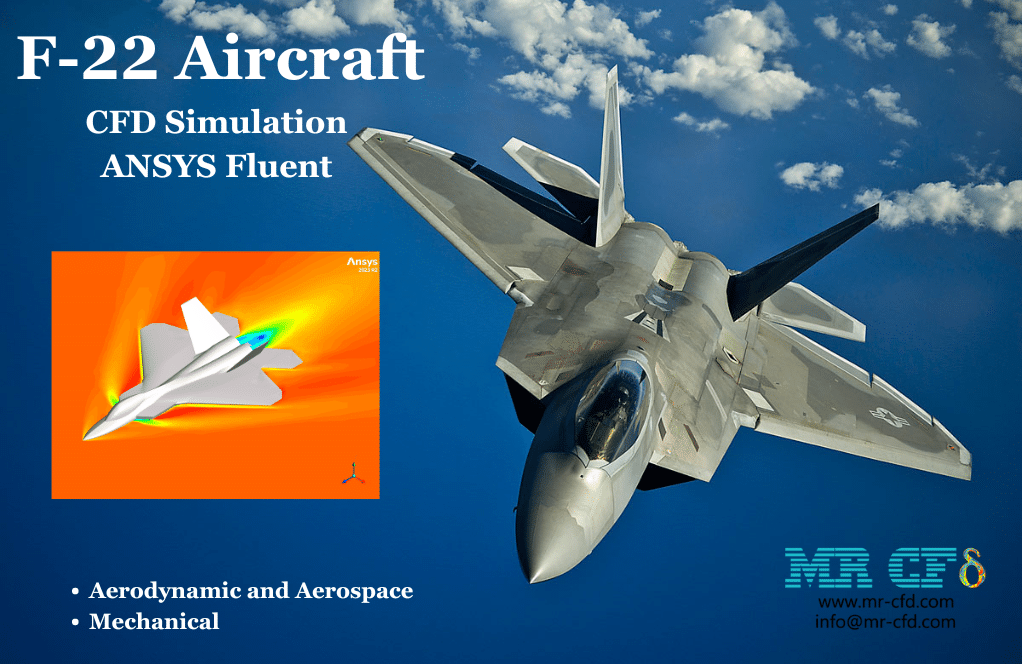
F-22 Aircraft CFD Simulation, ANSYS Fluent
$100.00 $50.00 Student Discount
- This problem simulates a F-22 aircraft using ANSYS Fluent software.
- The geometry is designed in SpaceClaim, and the meshing is performed using FLUENT Meshing.
- The simulation is carried out using the density-based solver.
- The turbulence model is set to k-ε Realizable.
To Order Your Project or benefit from a CFD consultation, contact our experts via email (info@mr-cfd.com), online support tab, or WhatsApp at +44 7443 197273.
There are some Free Products to check our service quality.
If you want the training video in another language instead of English, ask it via info@mr-cfd.com after you buy the product.
Description
Description
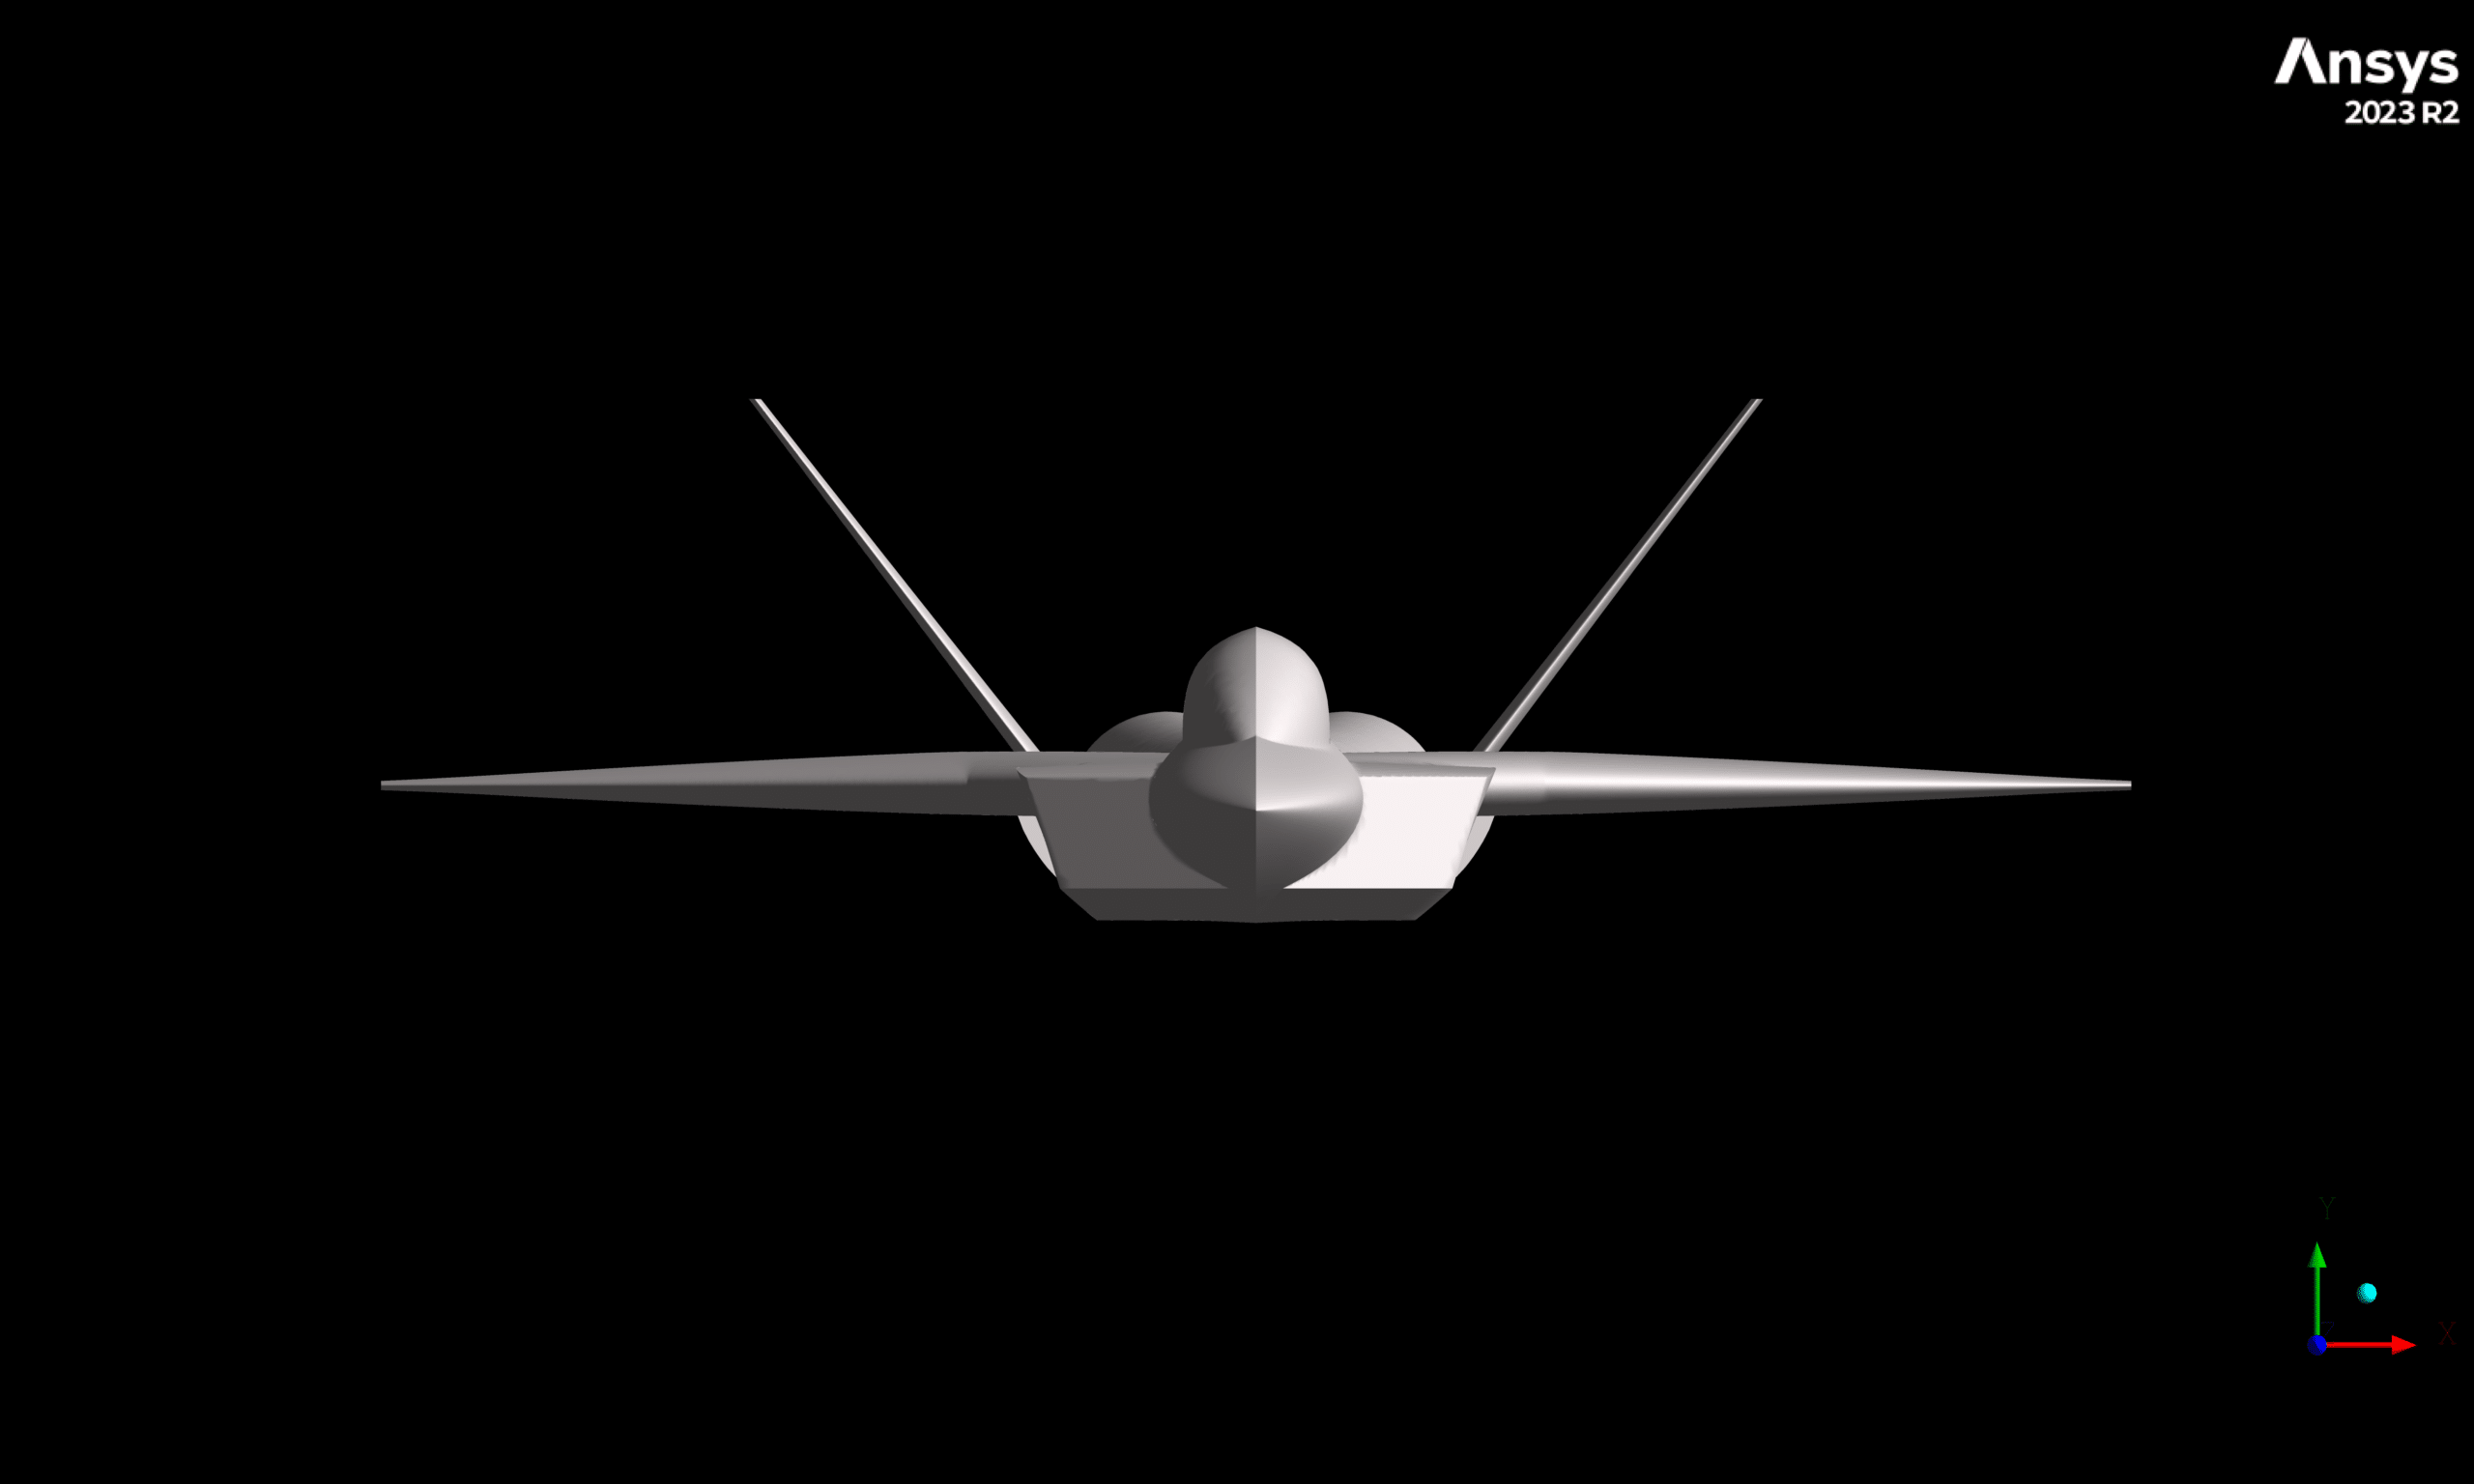
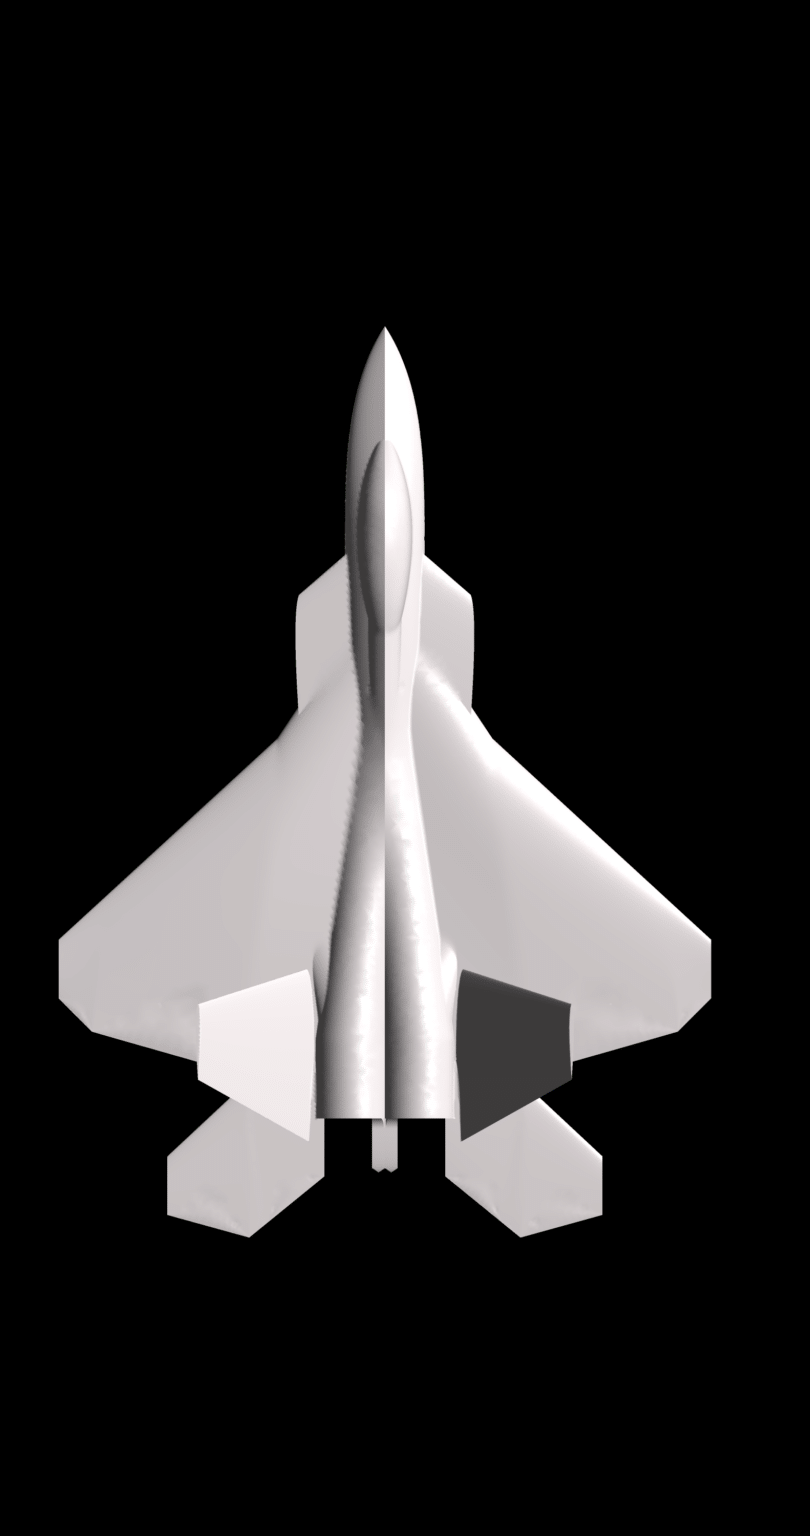
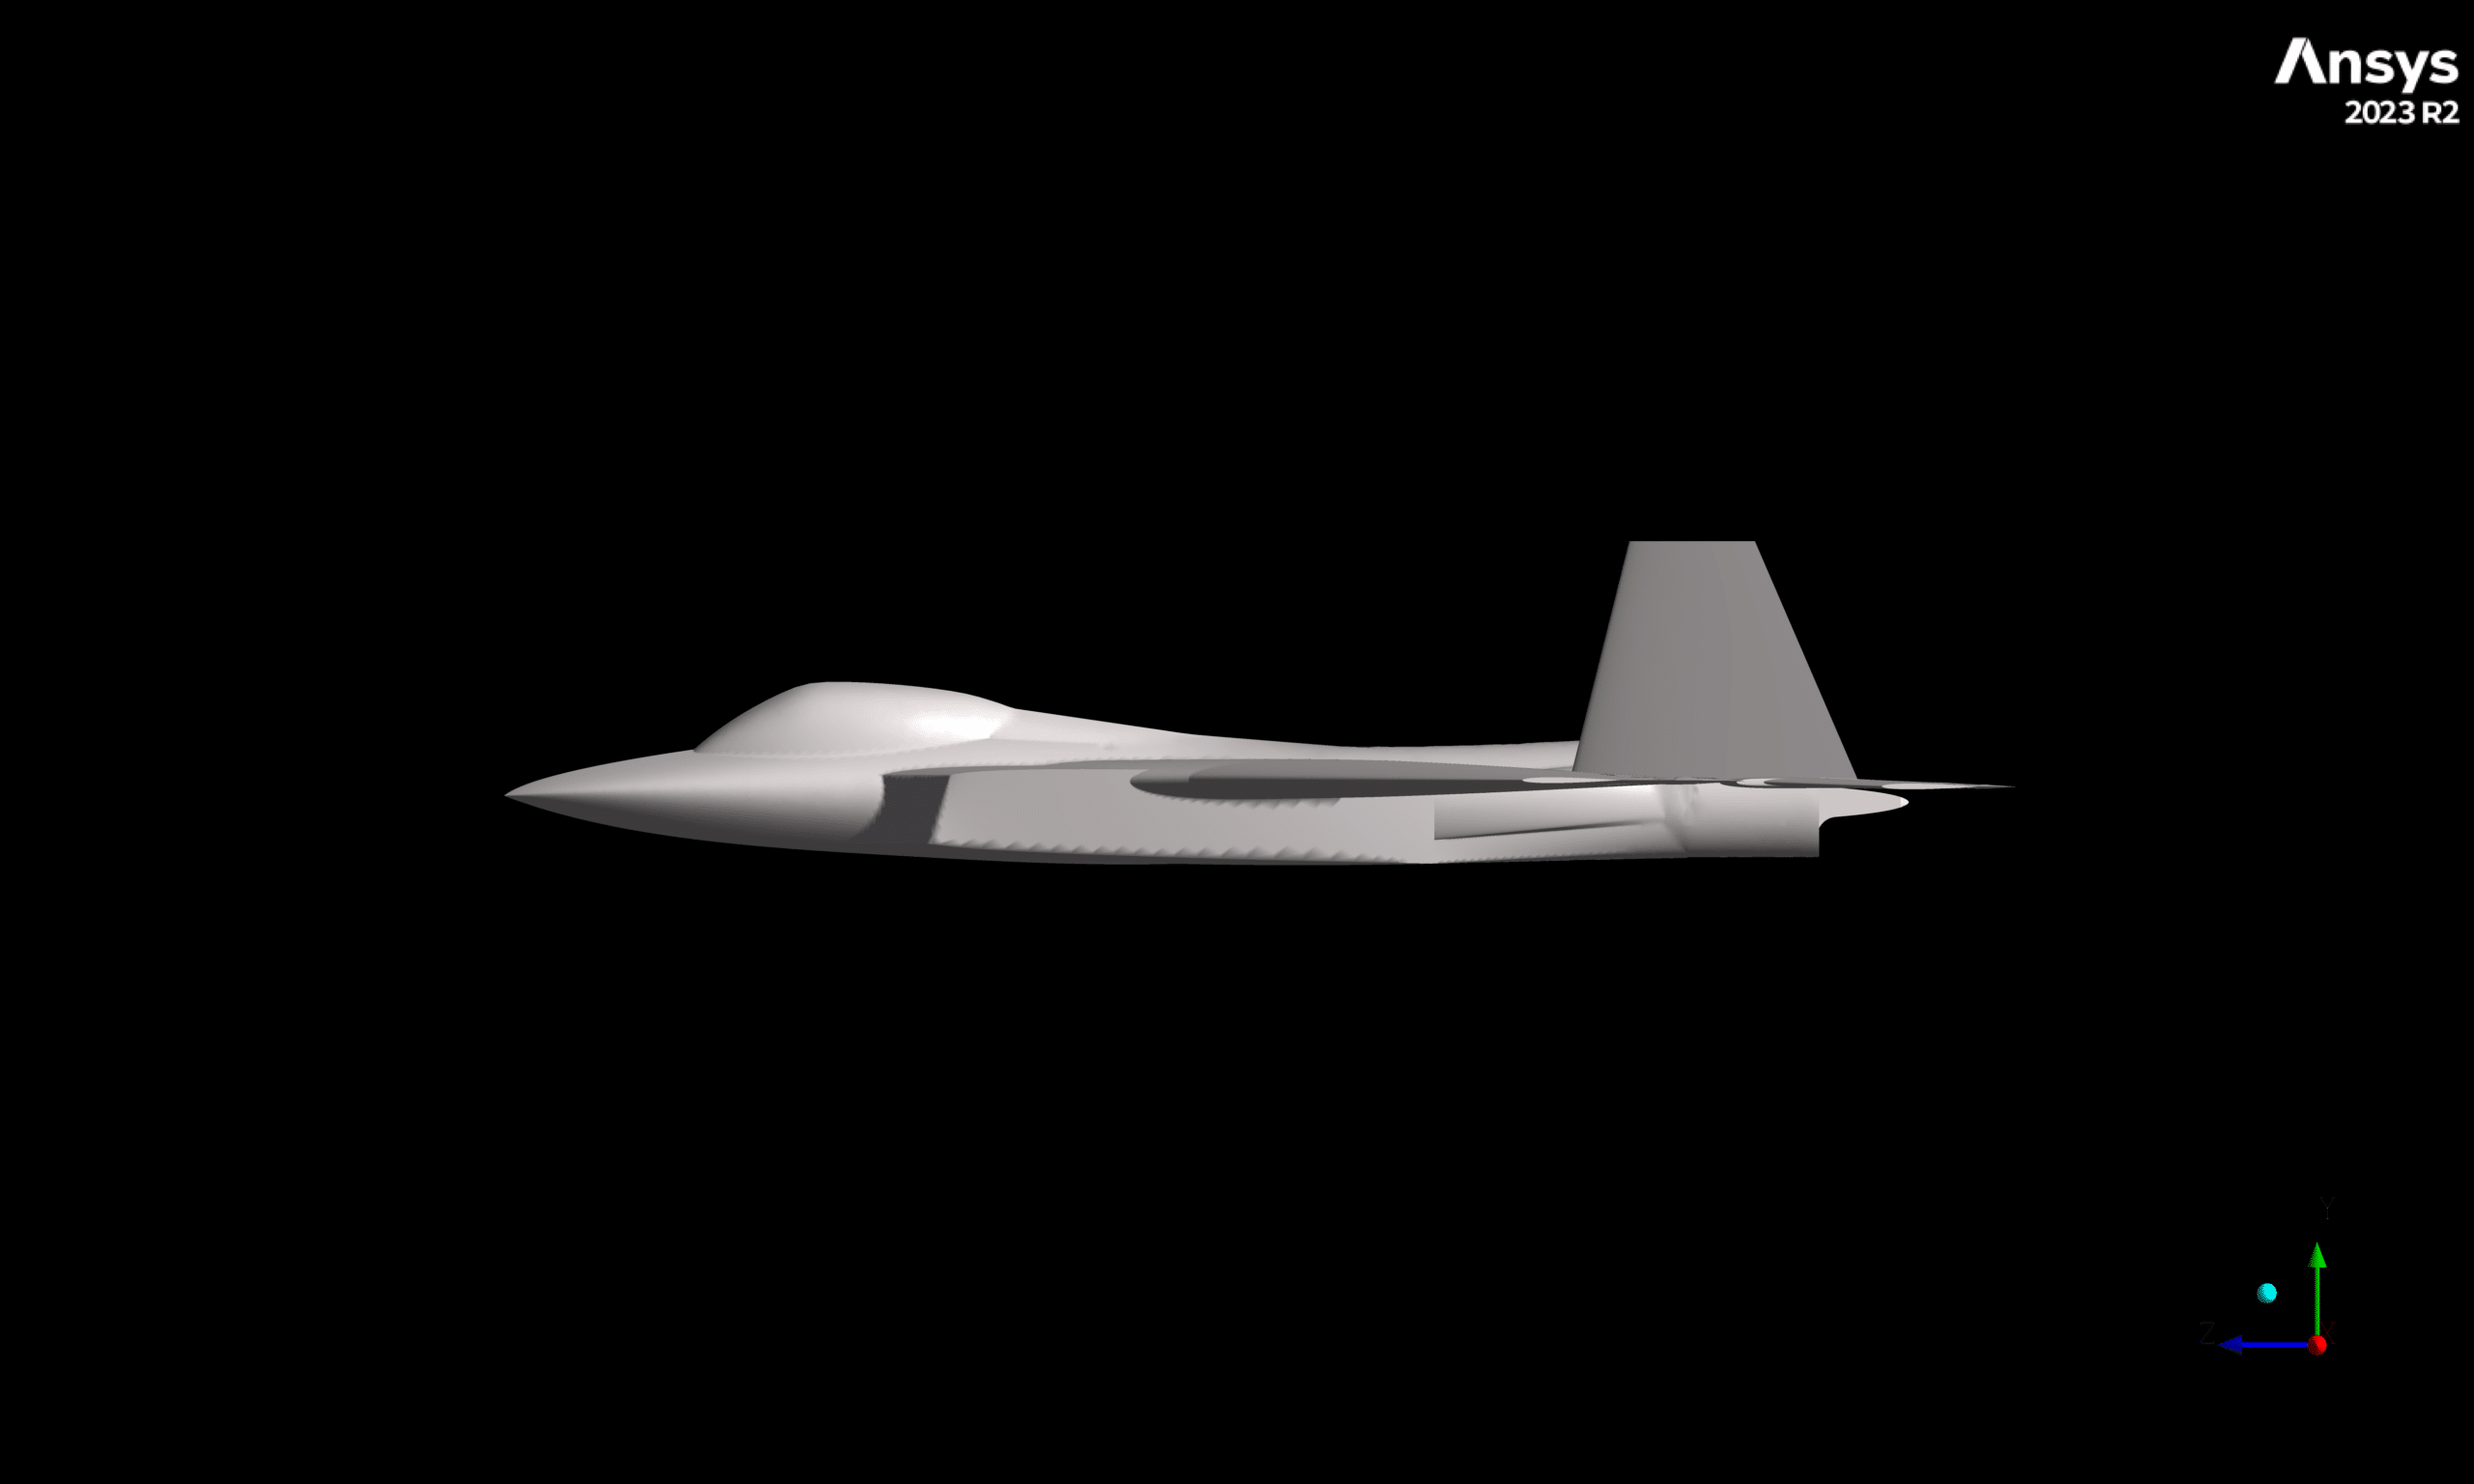
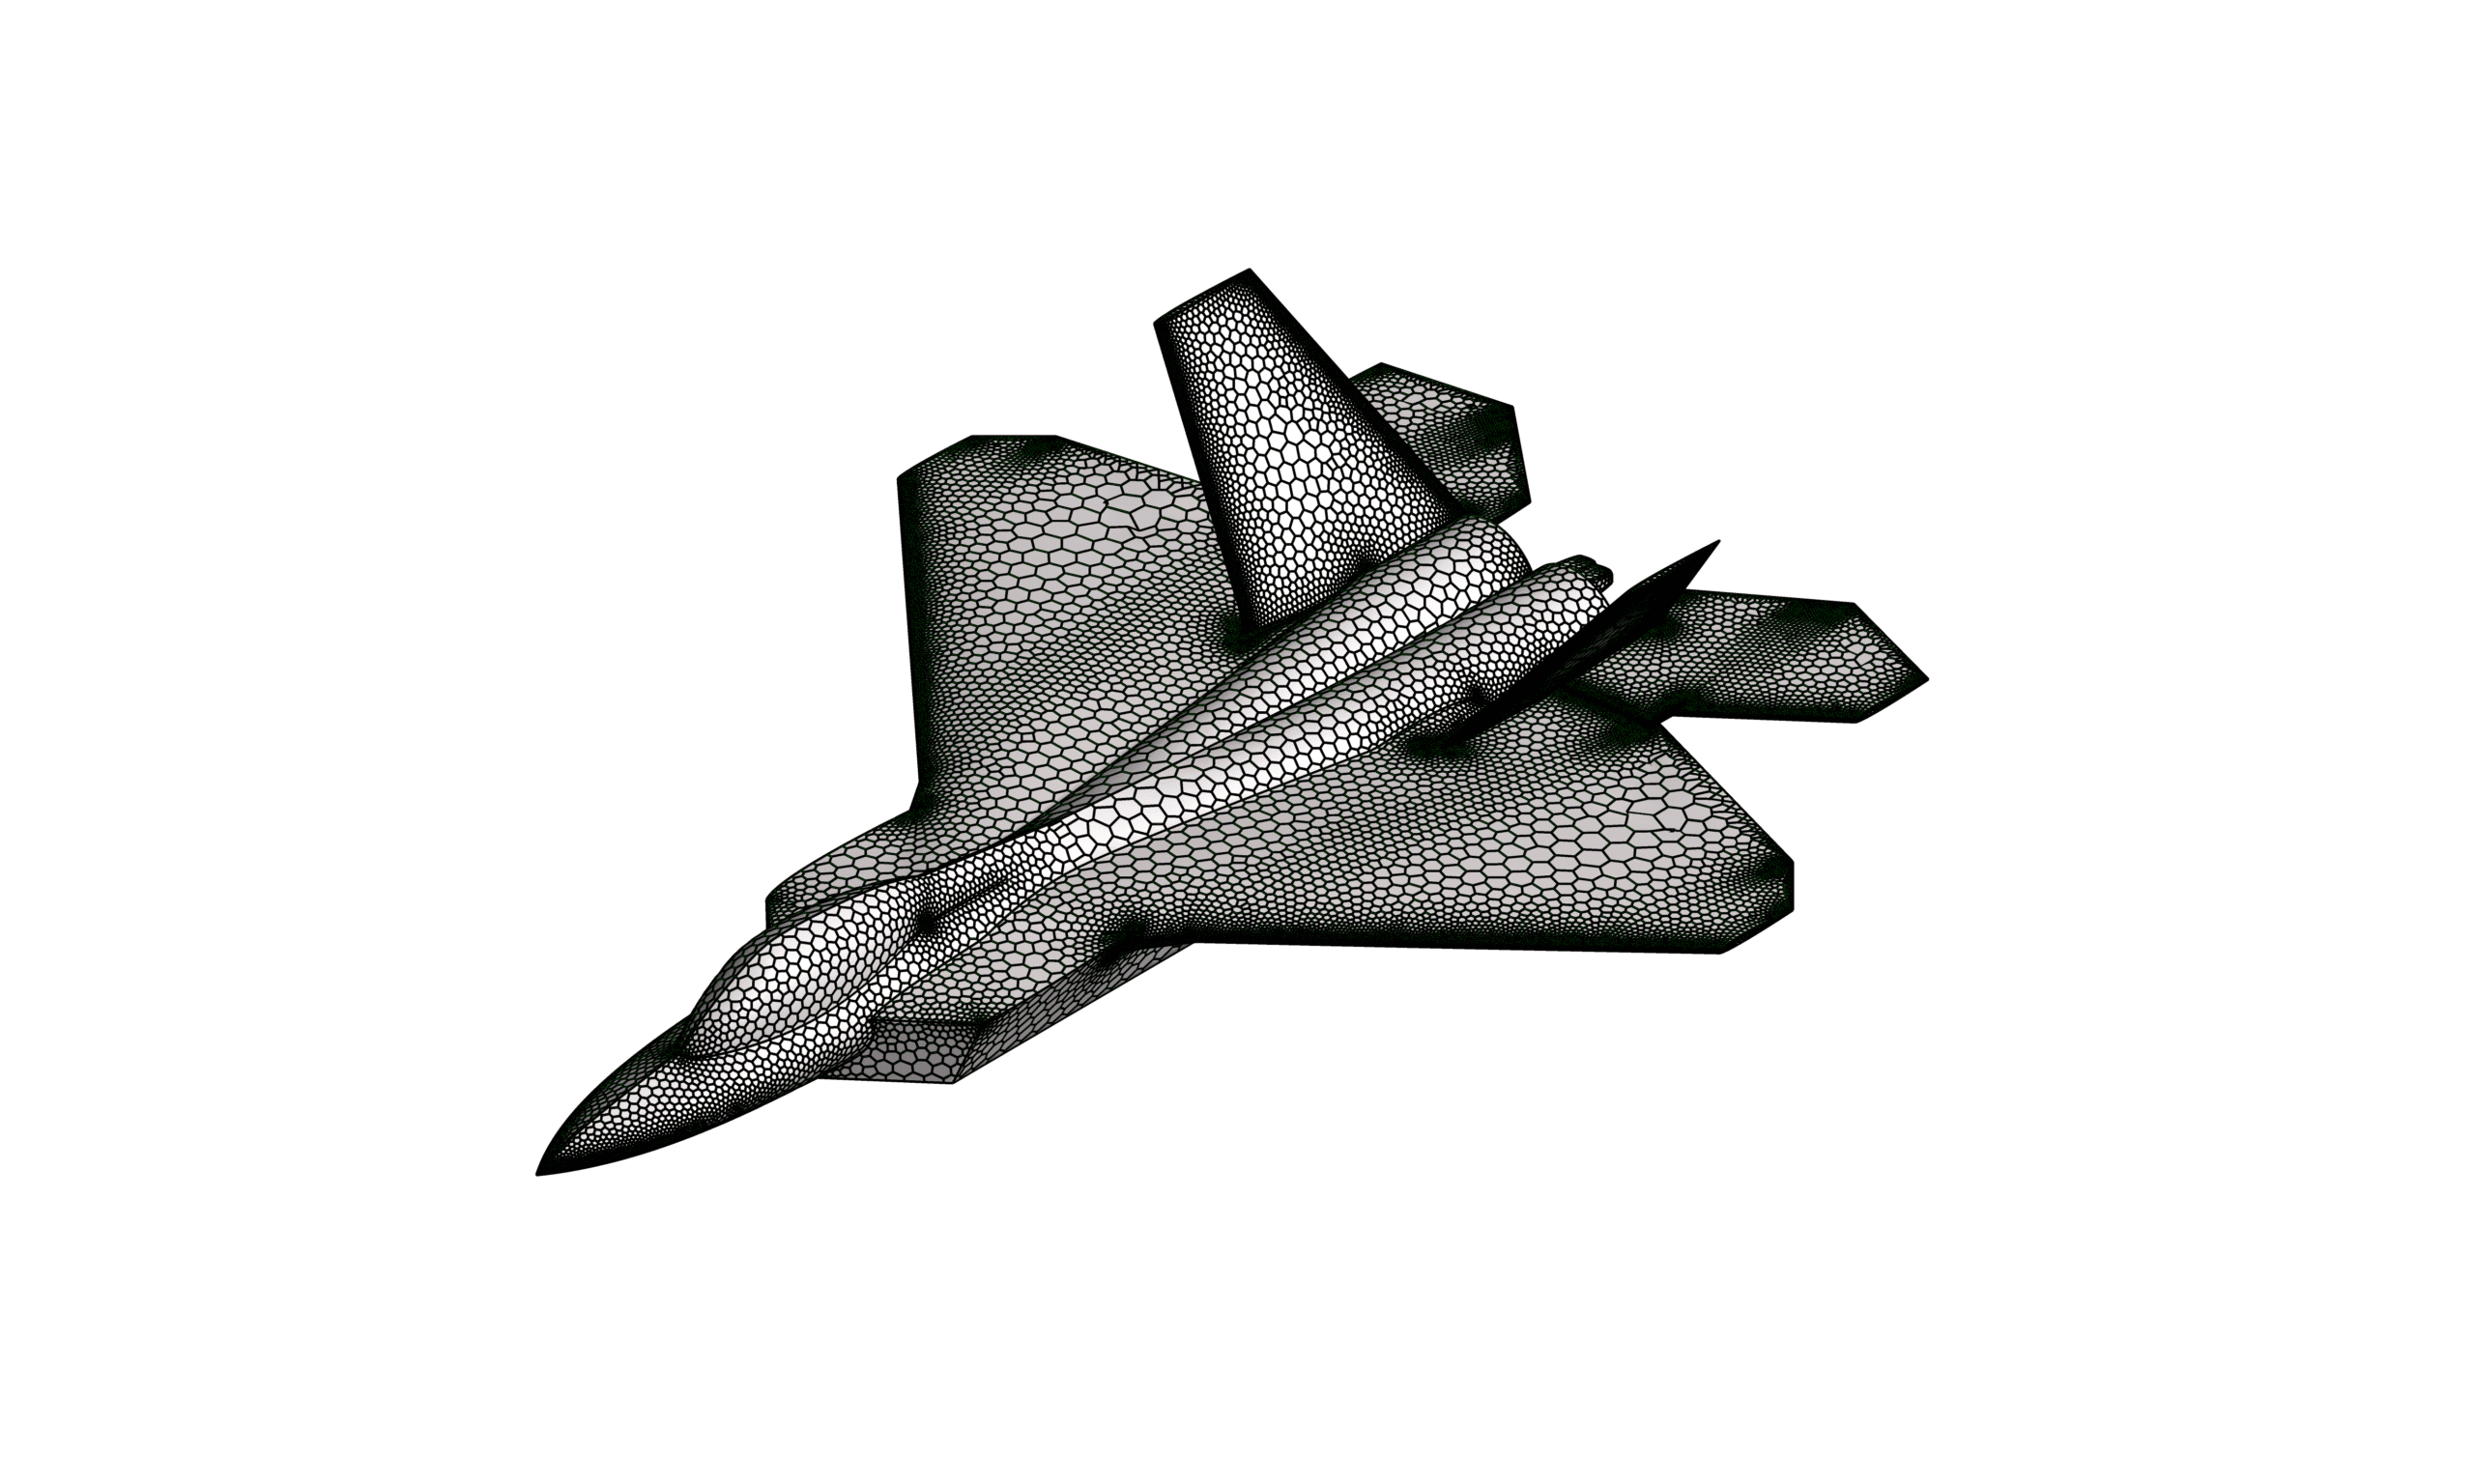
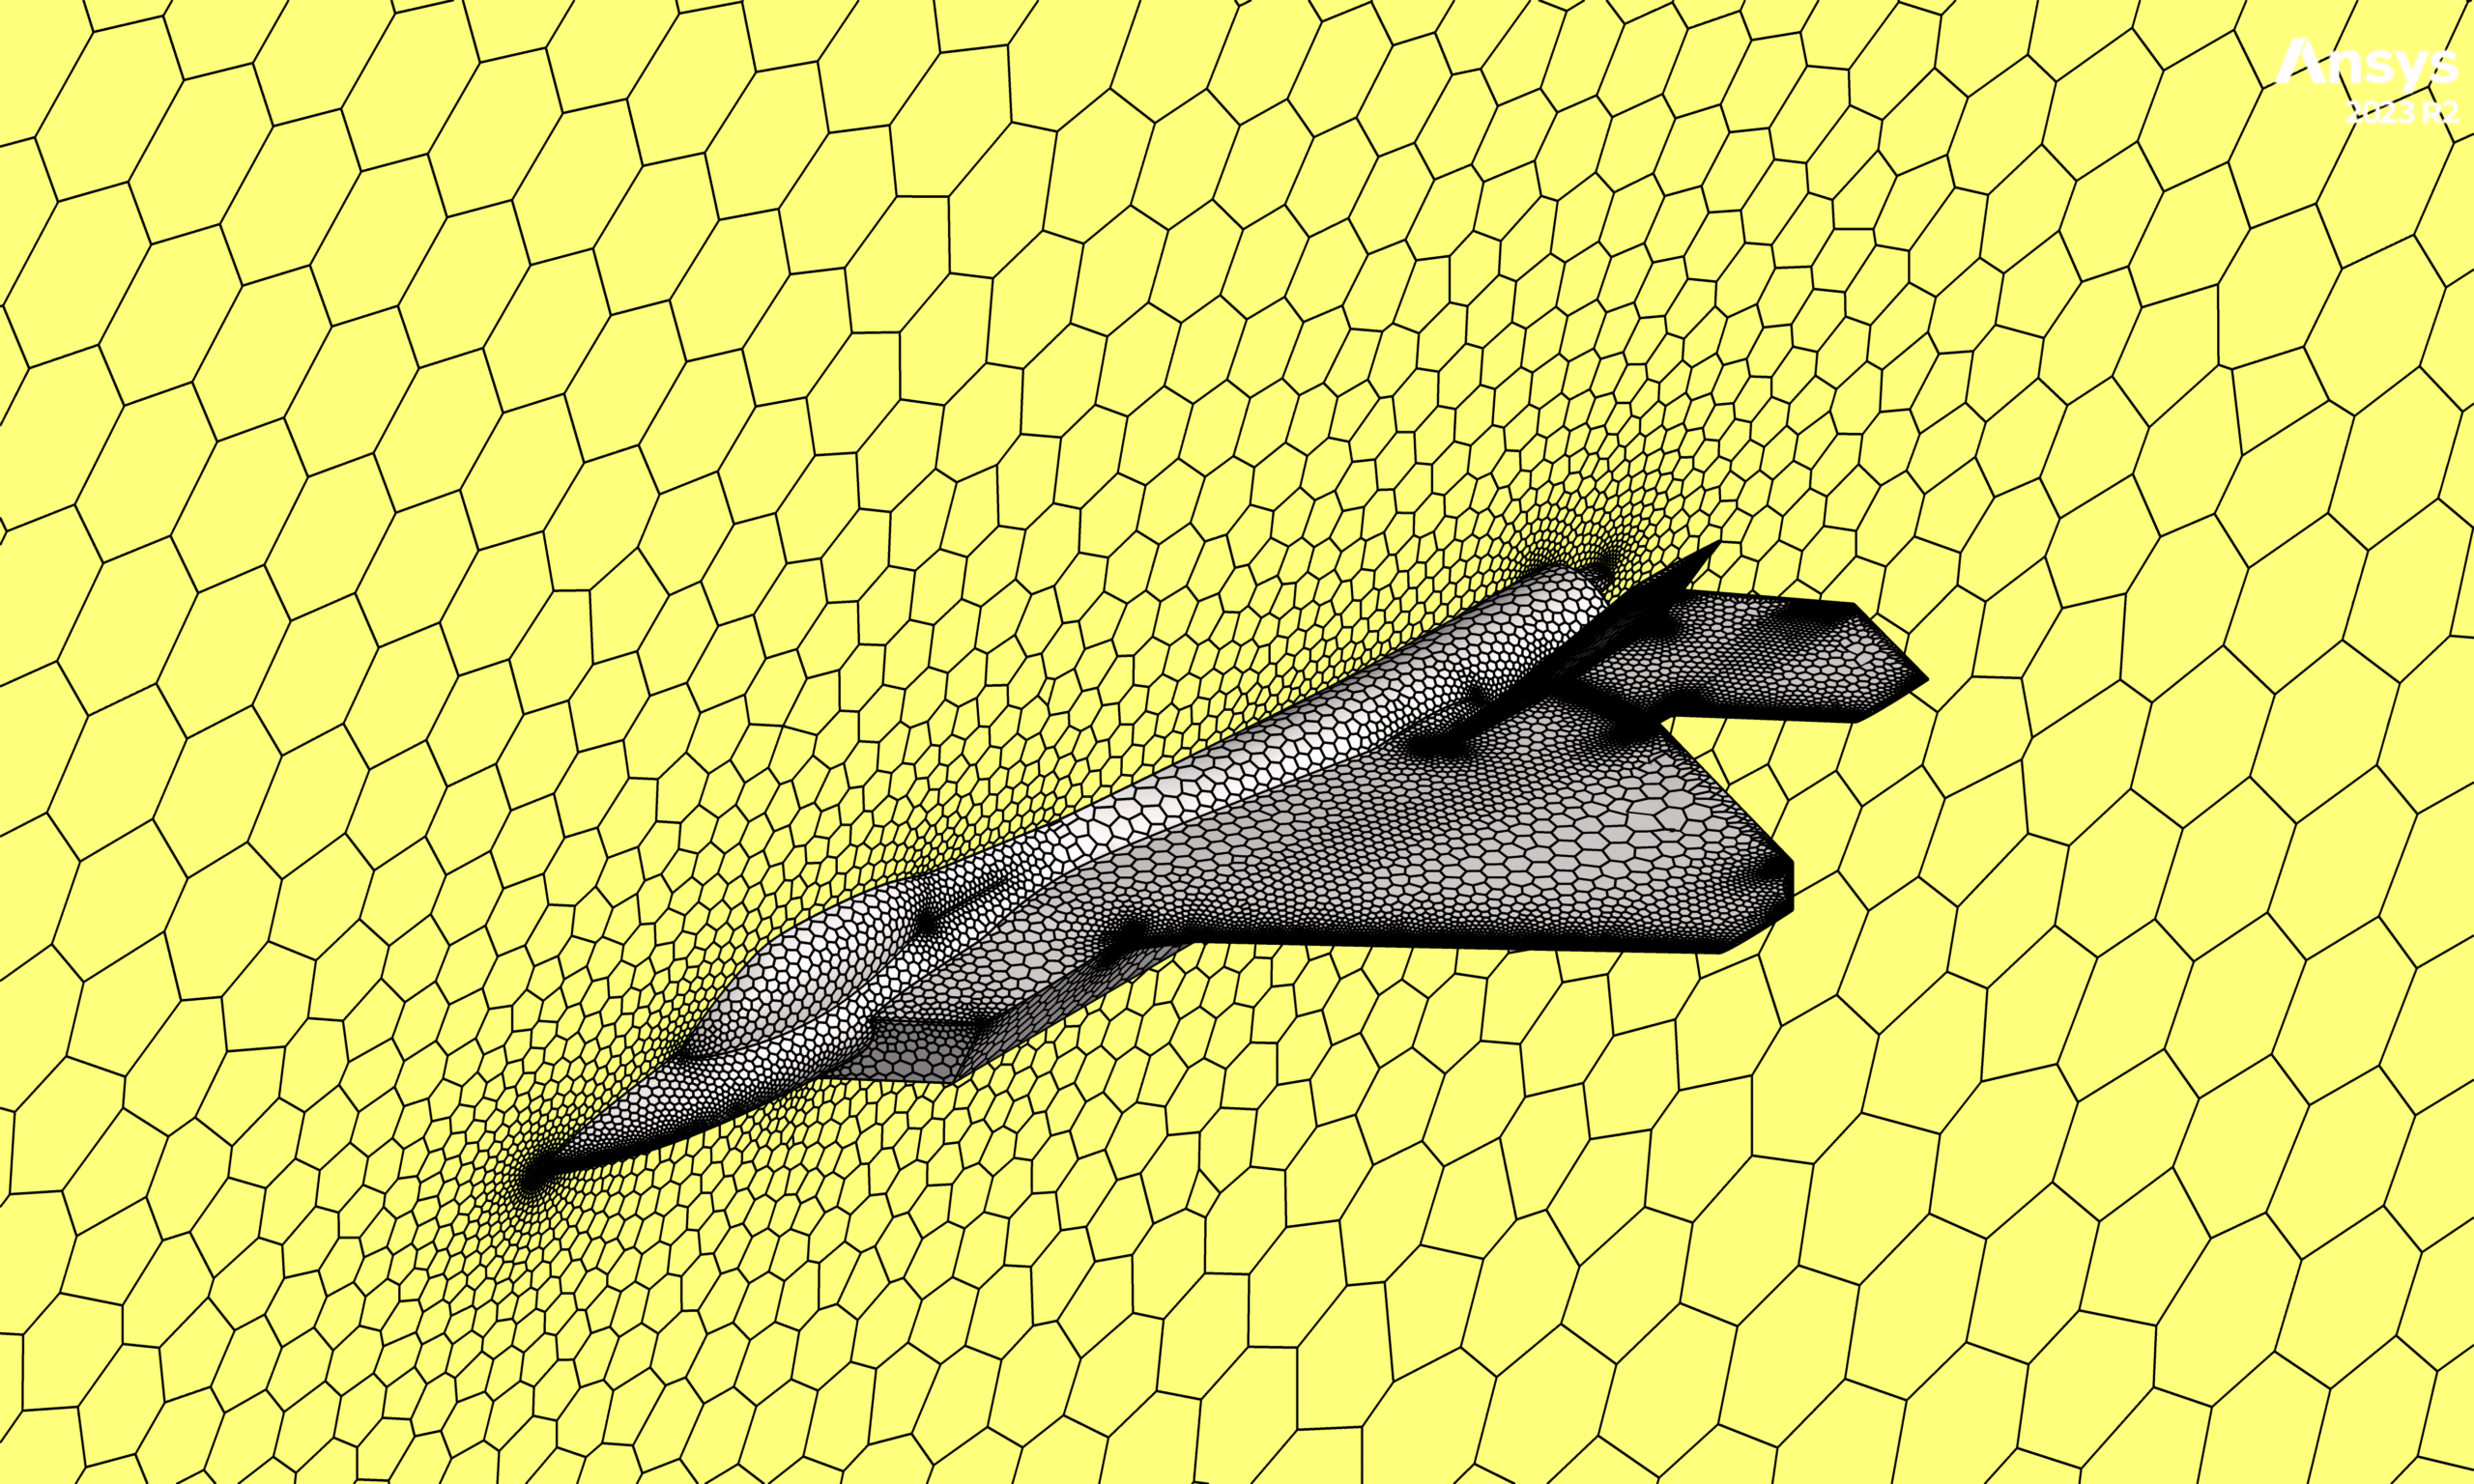
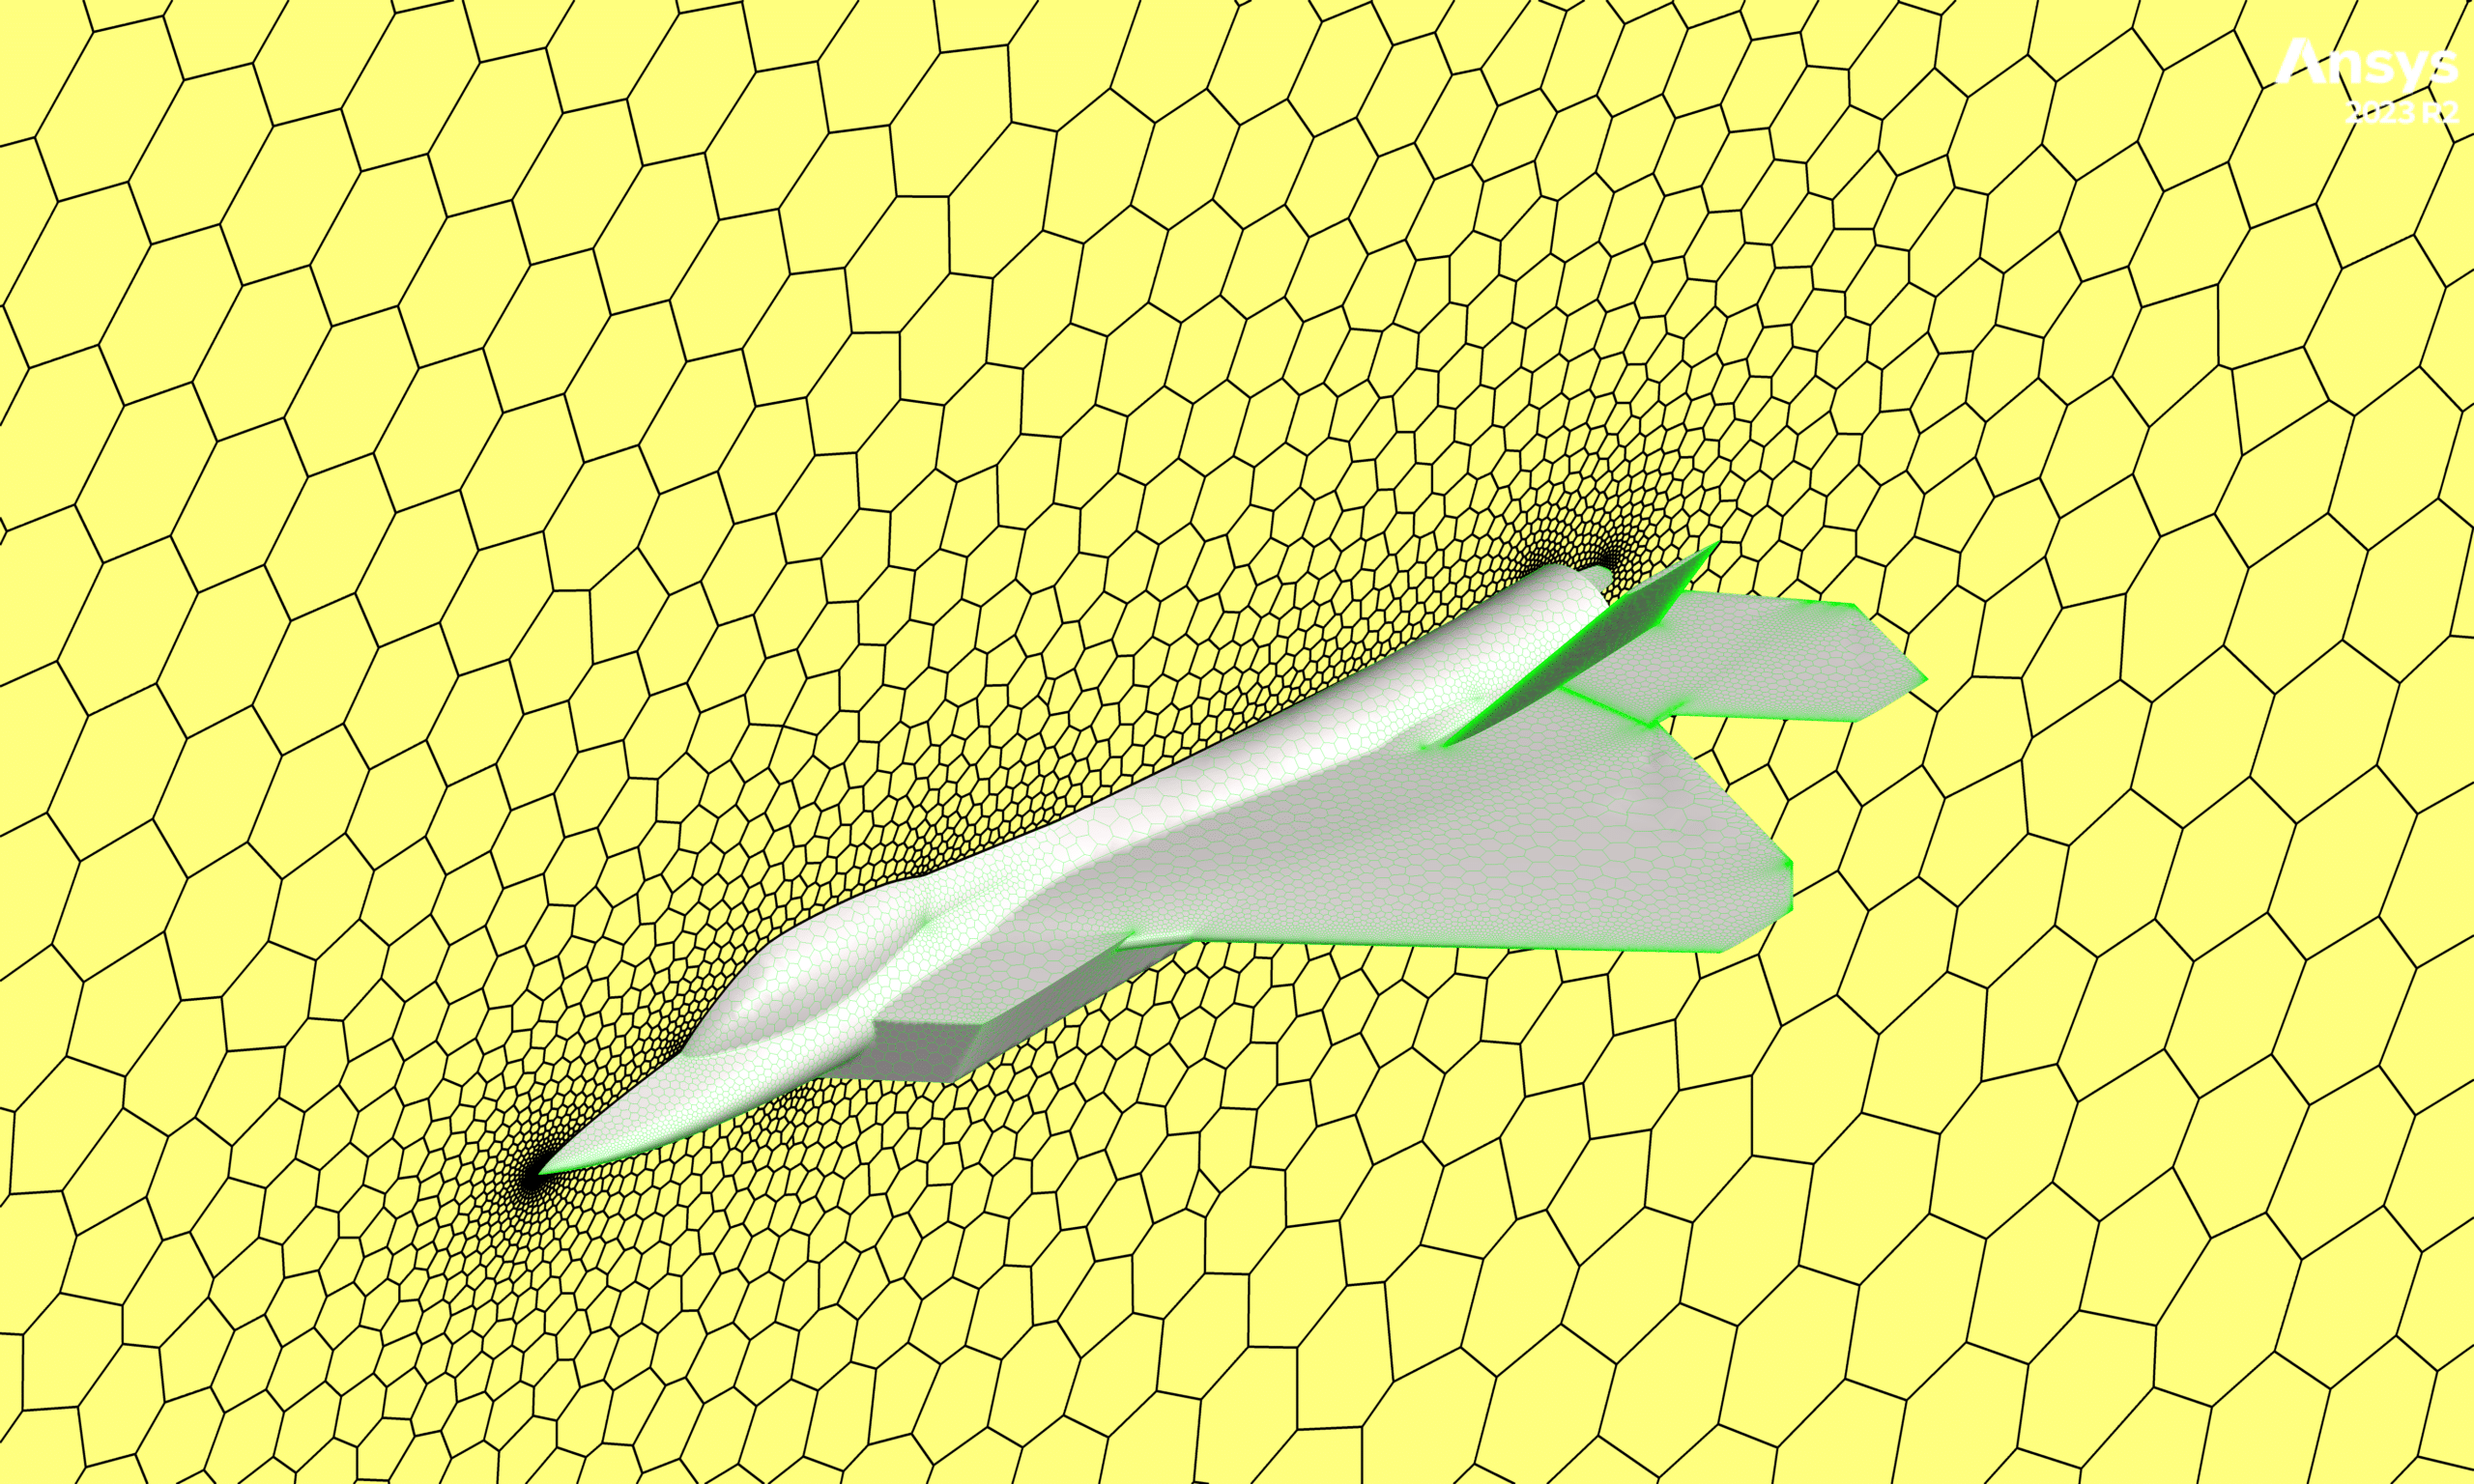
In this project, an F-22 aircraft simulation was conducted using ANSYS Fluent software. The geometry was designed in SpaceClaim, and the meshing was performed using FLUENT Meshing, generating approximately 5 million polyhedral mesh elements. Due to the high Mach number of 0.4, the simulation was carried out using the density-based solver, and the flow was assumed to be steady.
You can view the wing lift-to-drag ratio RBF-morph optimization simulation of this product from here.
Fig.1: Geometry
Fig.2: Mesh
Boundary Conditions
The boundary condition on the aircraft surface was set as a wall, while the remaining boundary conditions were set as pressure far-field with a Mach number of 2. The SIMPLE algorithm was used, and the explicit formulation was employed. The standard initialization method was utilized, and the turbulence model was set to k-ε Realizable. The working fluid was assumed to be an ideal gas (air).
Results
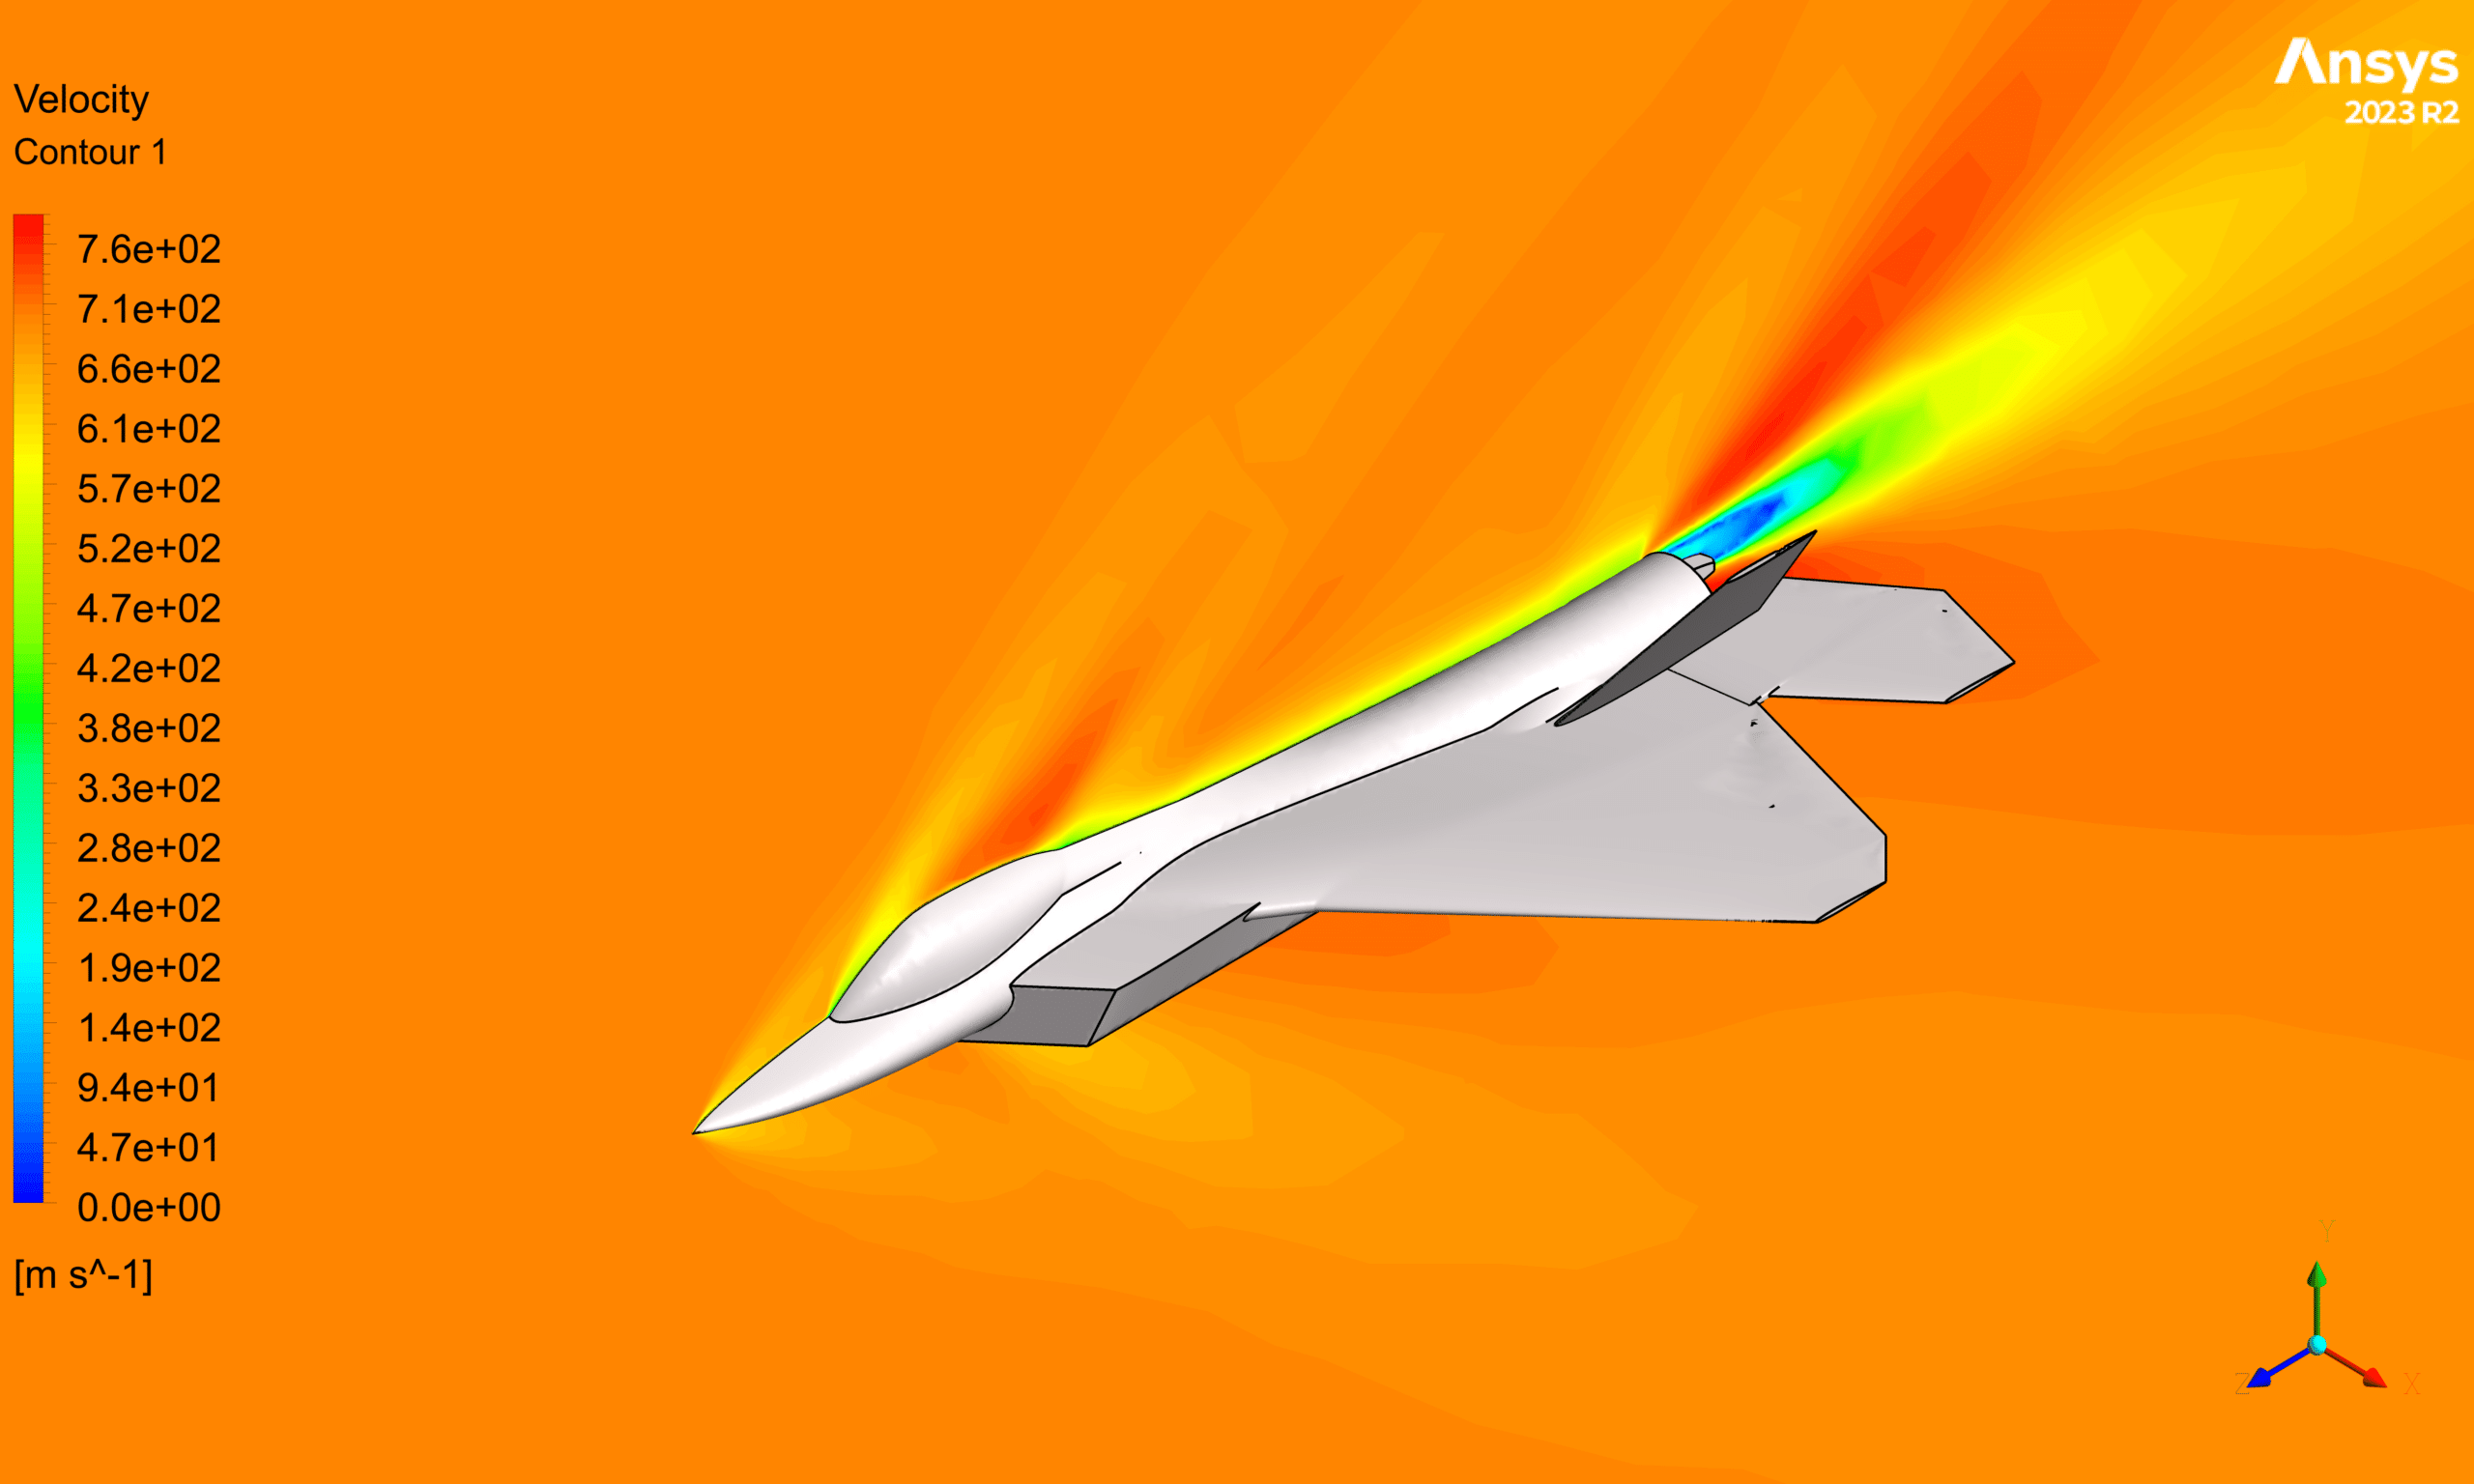
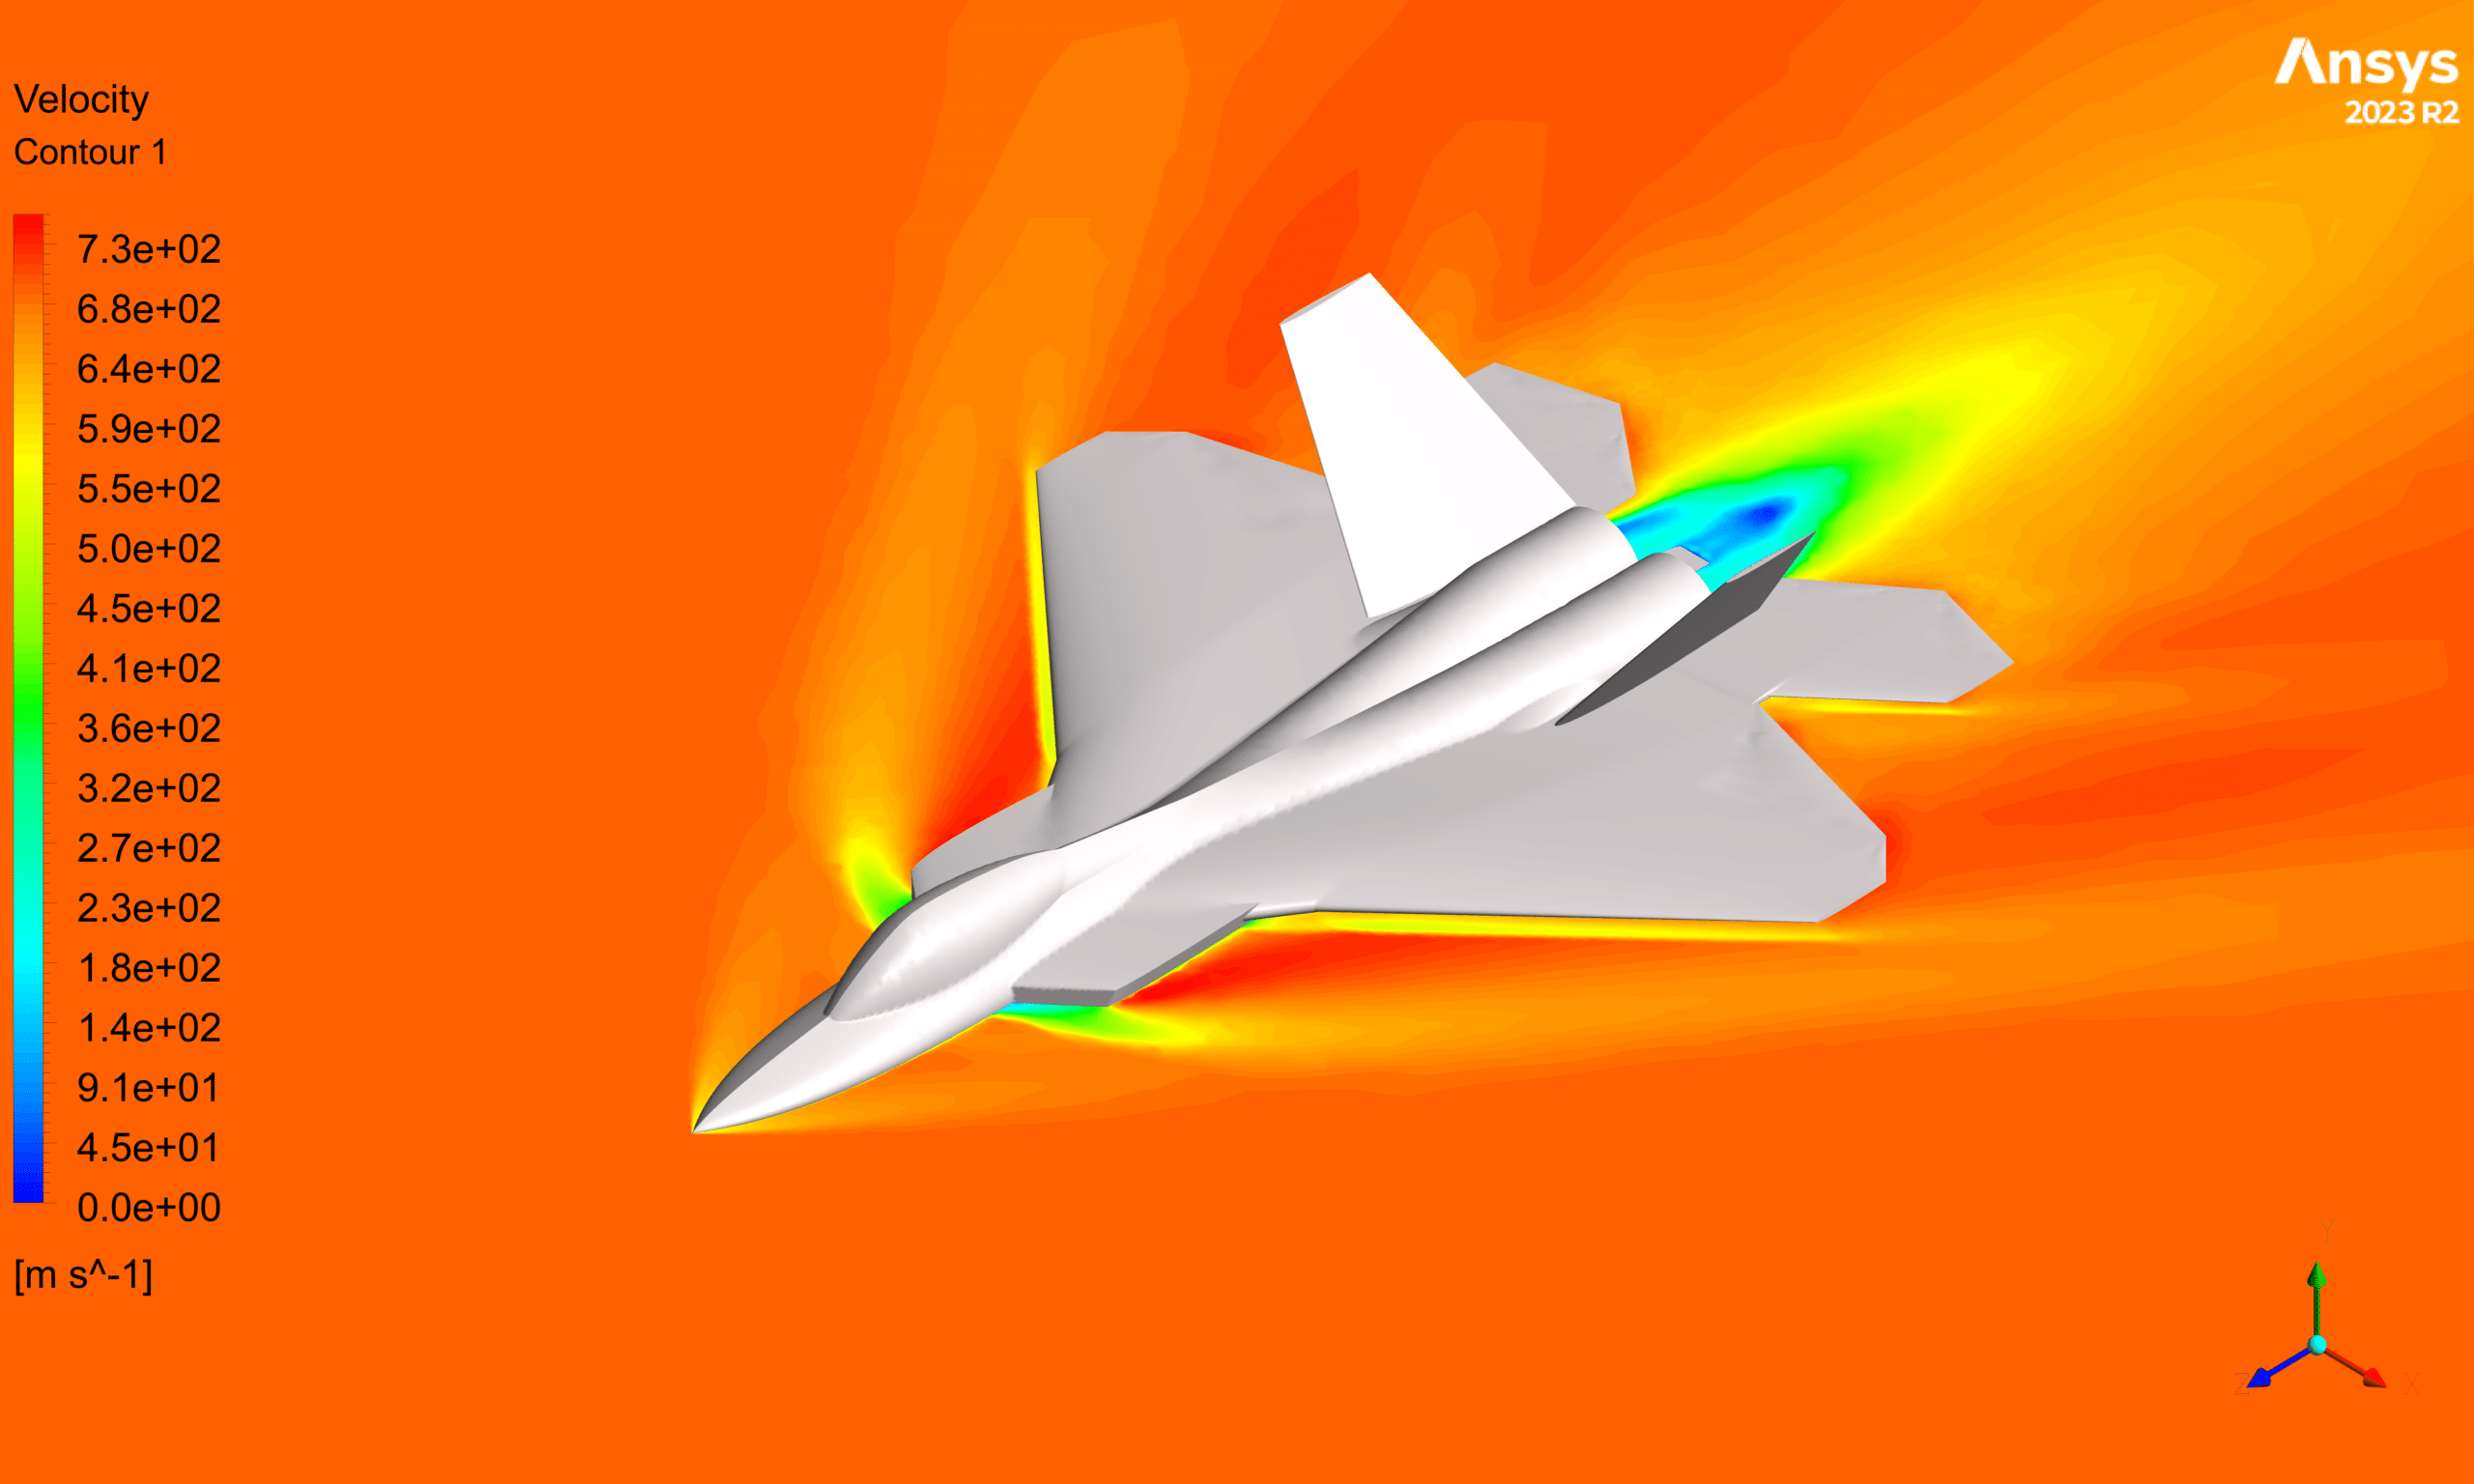
Several contours were obtained from the simulation, which are attached to this report. The drag force obtained from the simulation was 74.067622 KN. Since the simulation was performed using symmetry, multiplying this value by 2 yields a result close to 156 KN, which is approximately the thrust force of the F-22 engine. This indicates that the simulation is relatively accurate. The percentage error can be calculated as follows:
Percentage Error = (|Actual Value – Simulated Value| / Actual Value) × 100% = (|156000 – 148135.244| / 156000) × 100% = 5.04%
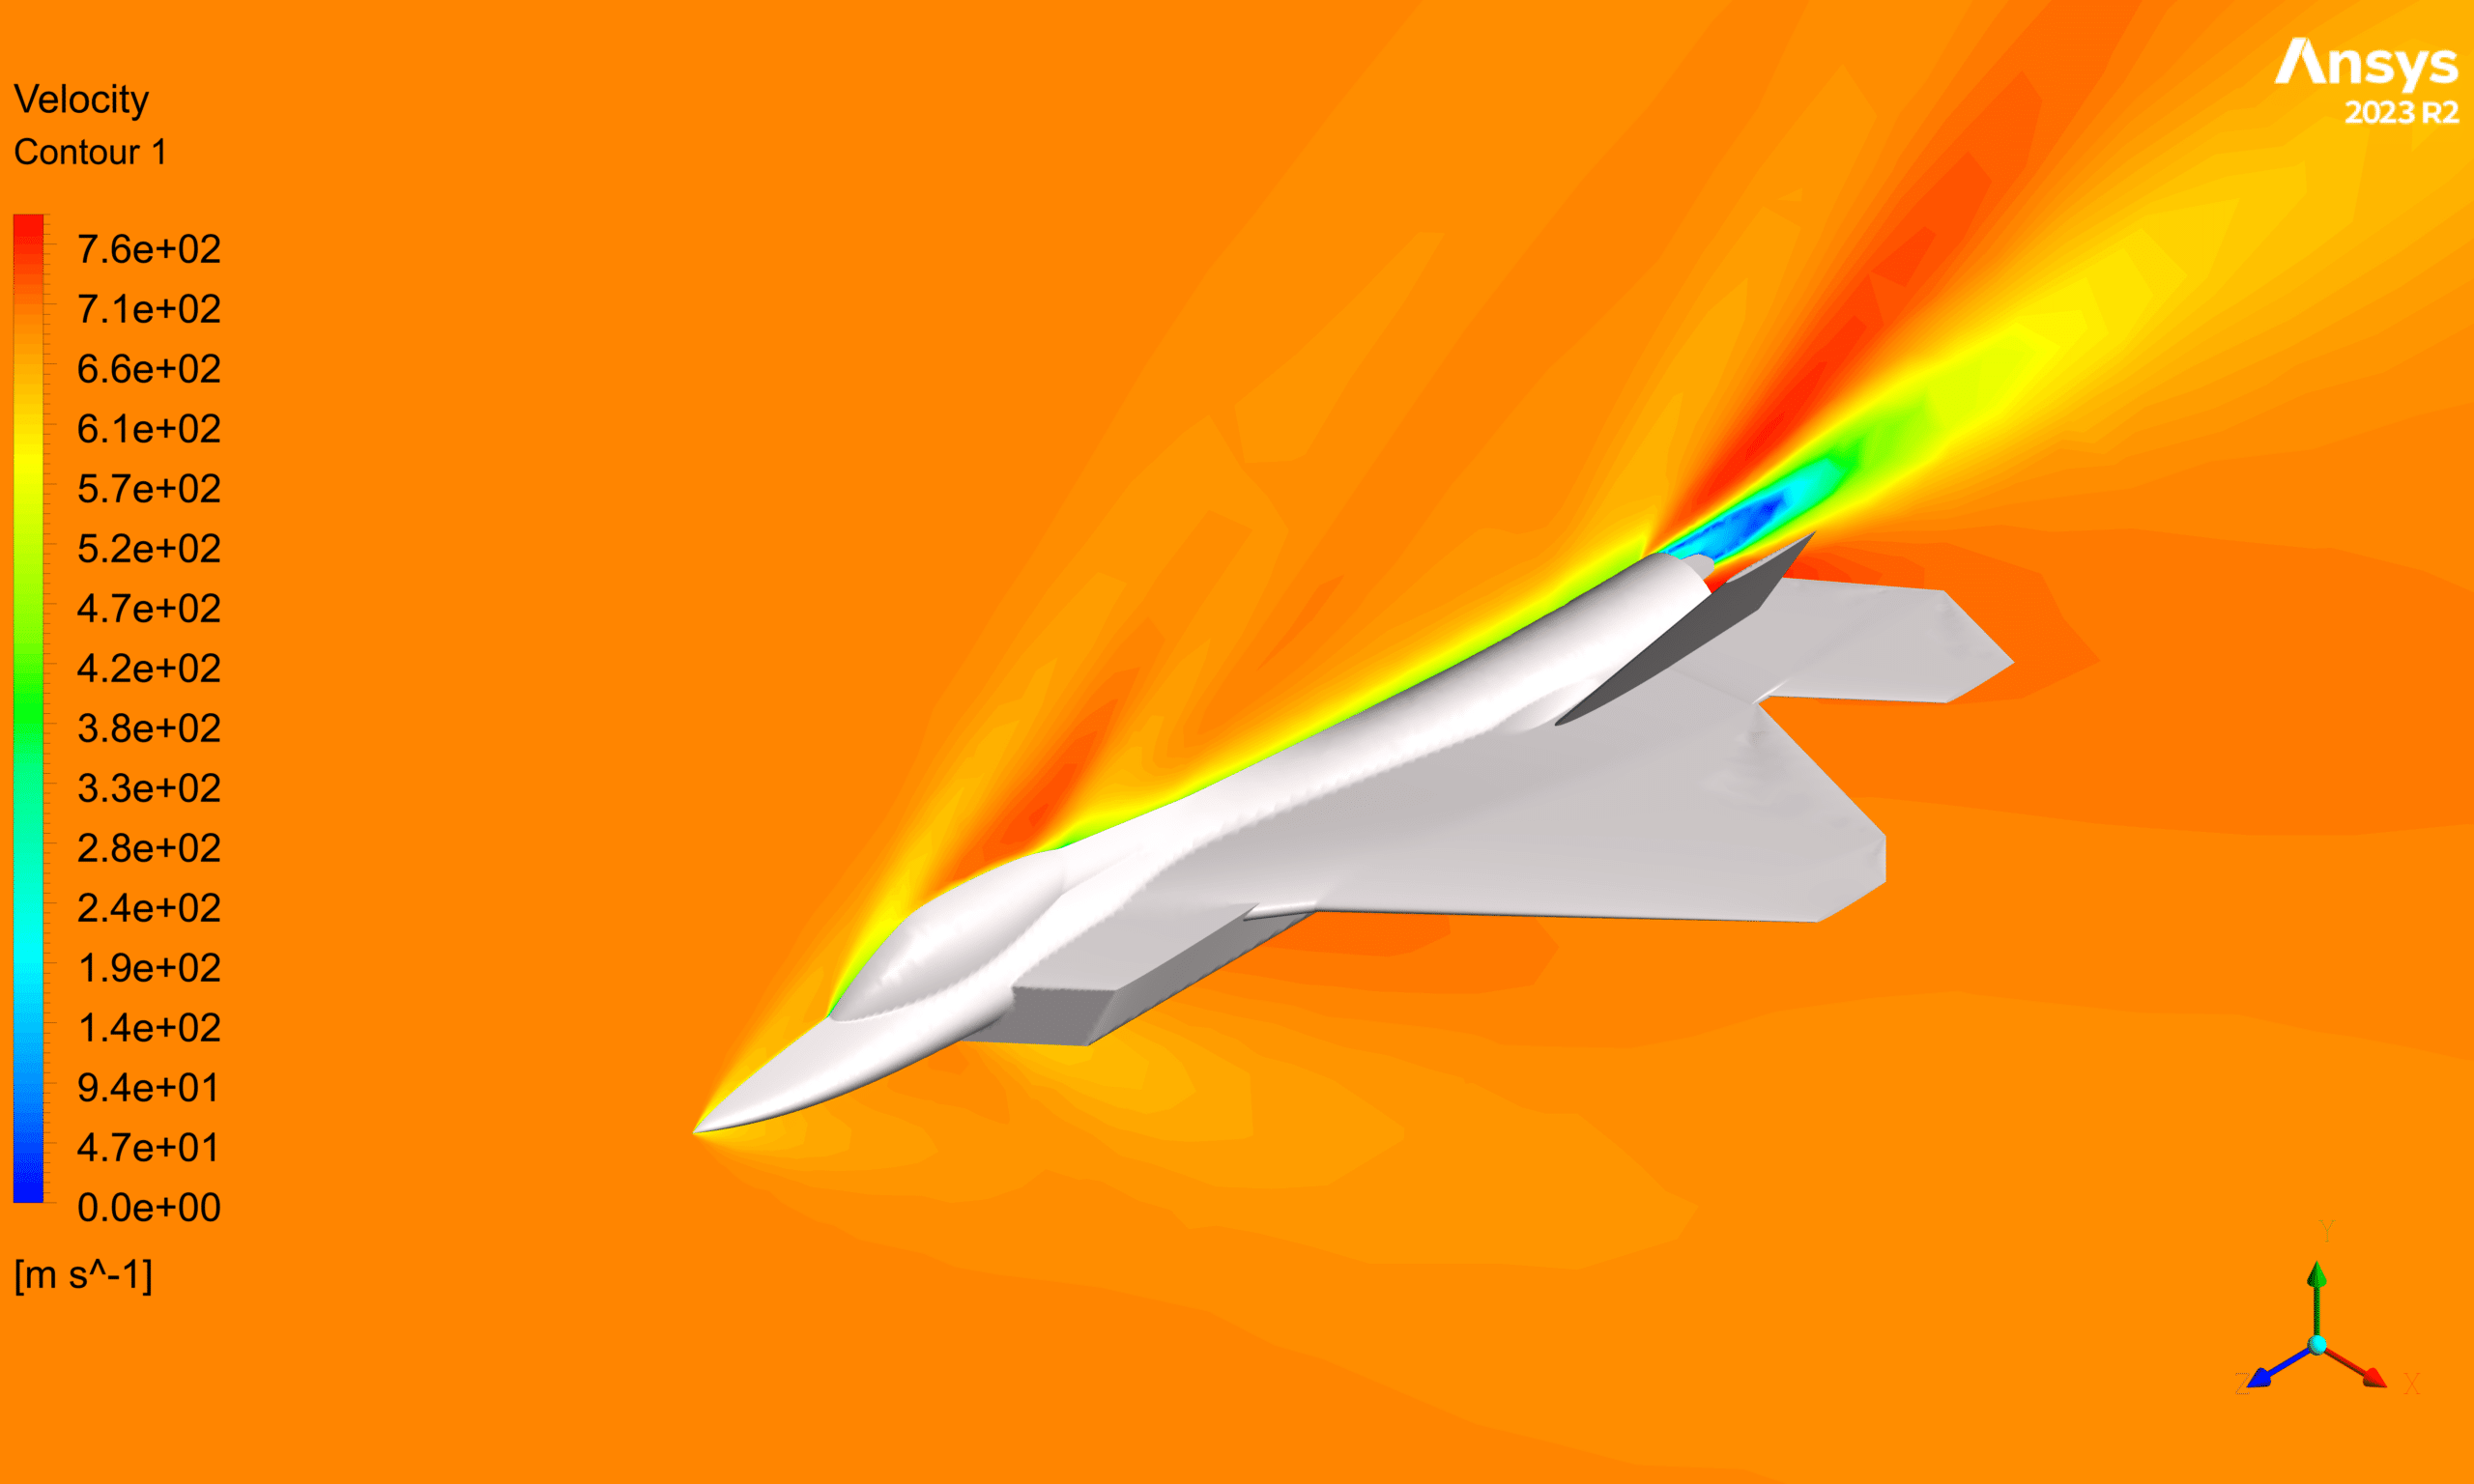
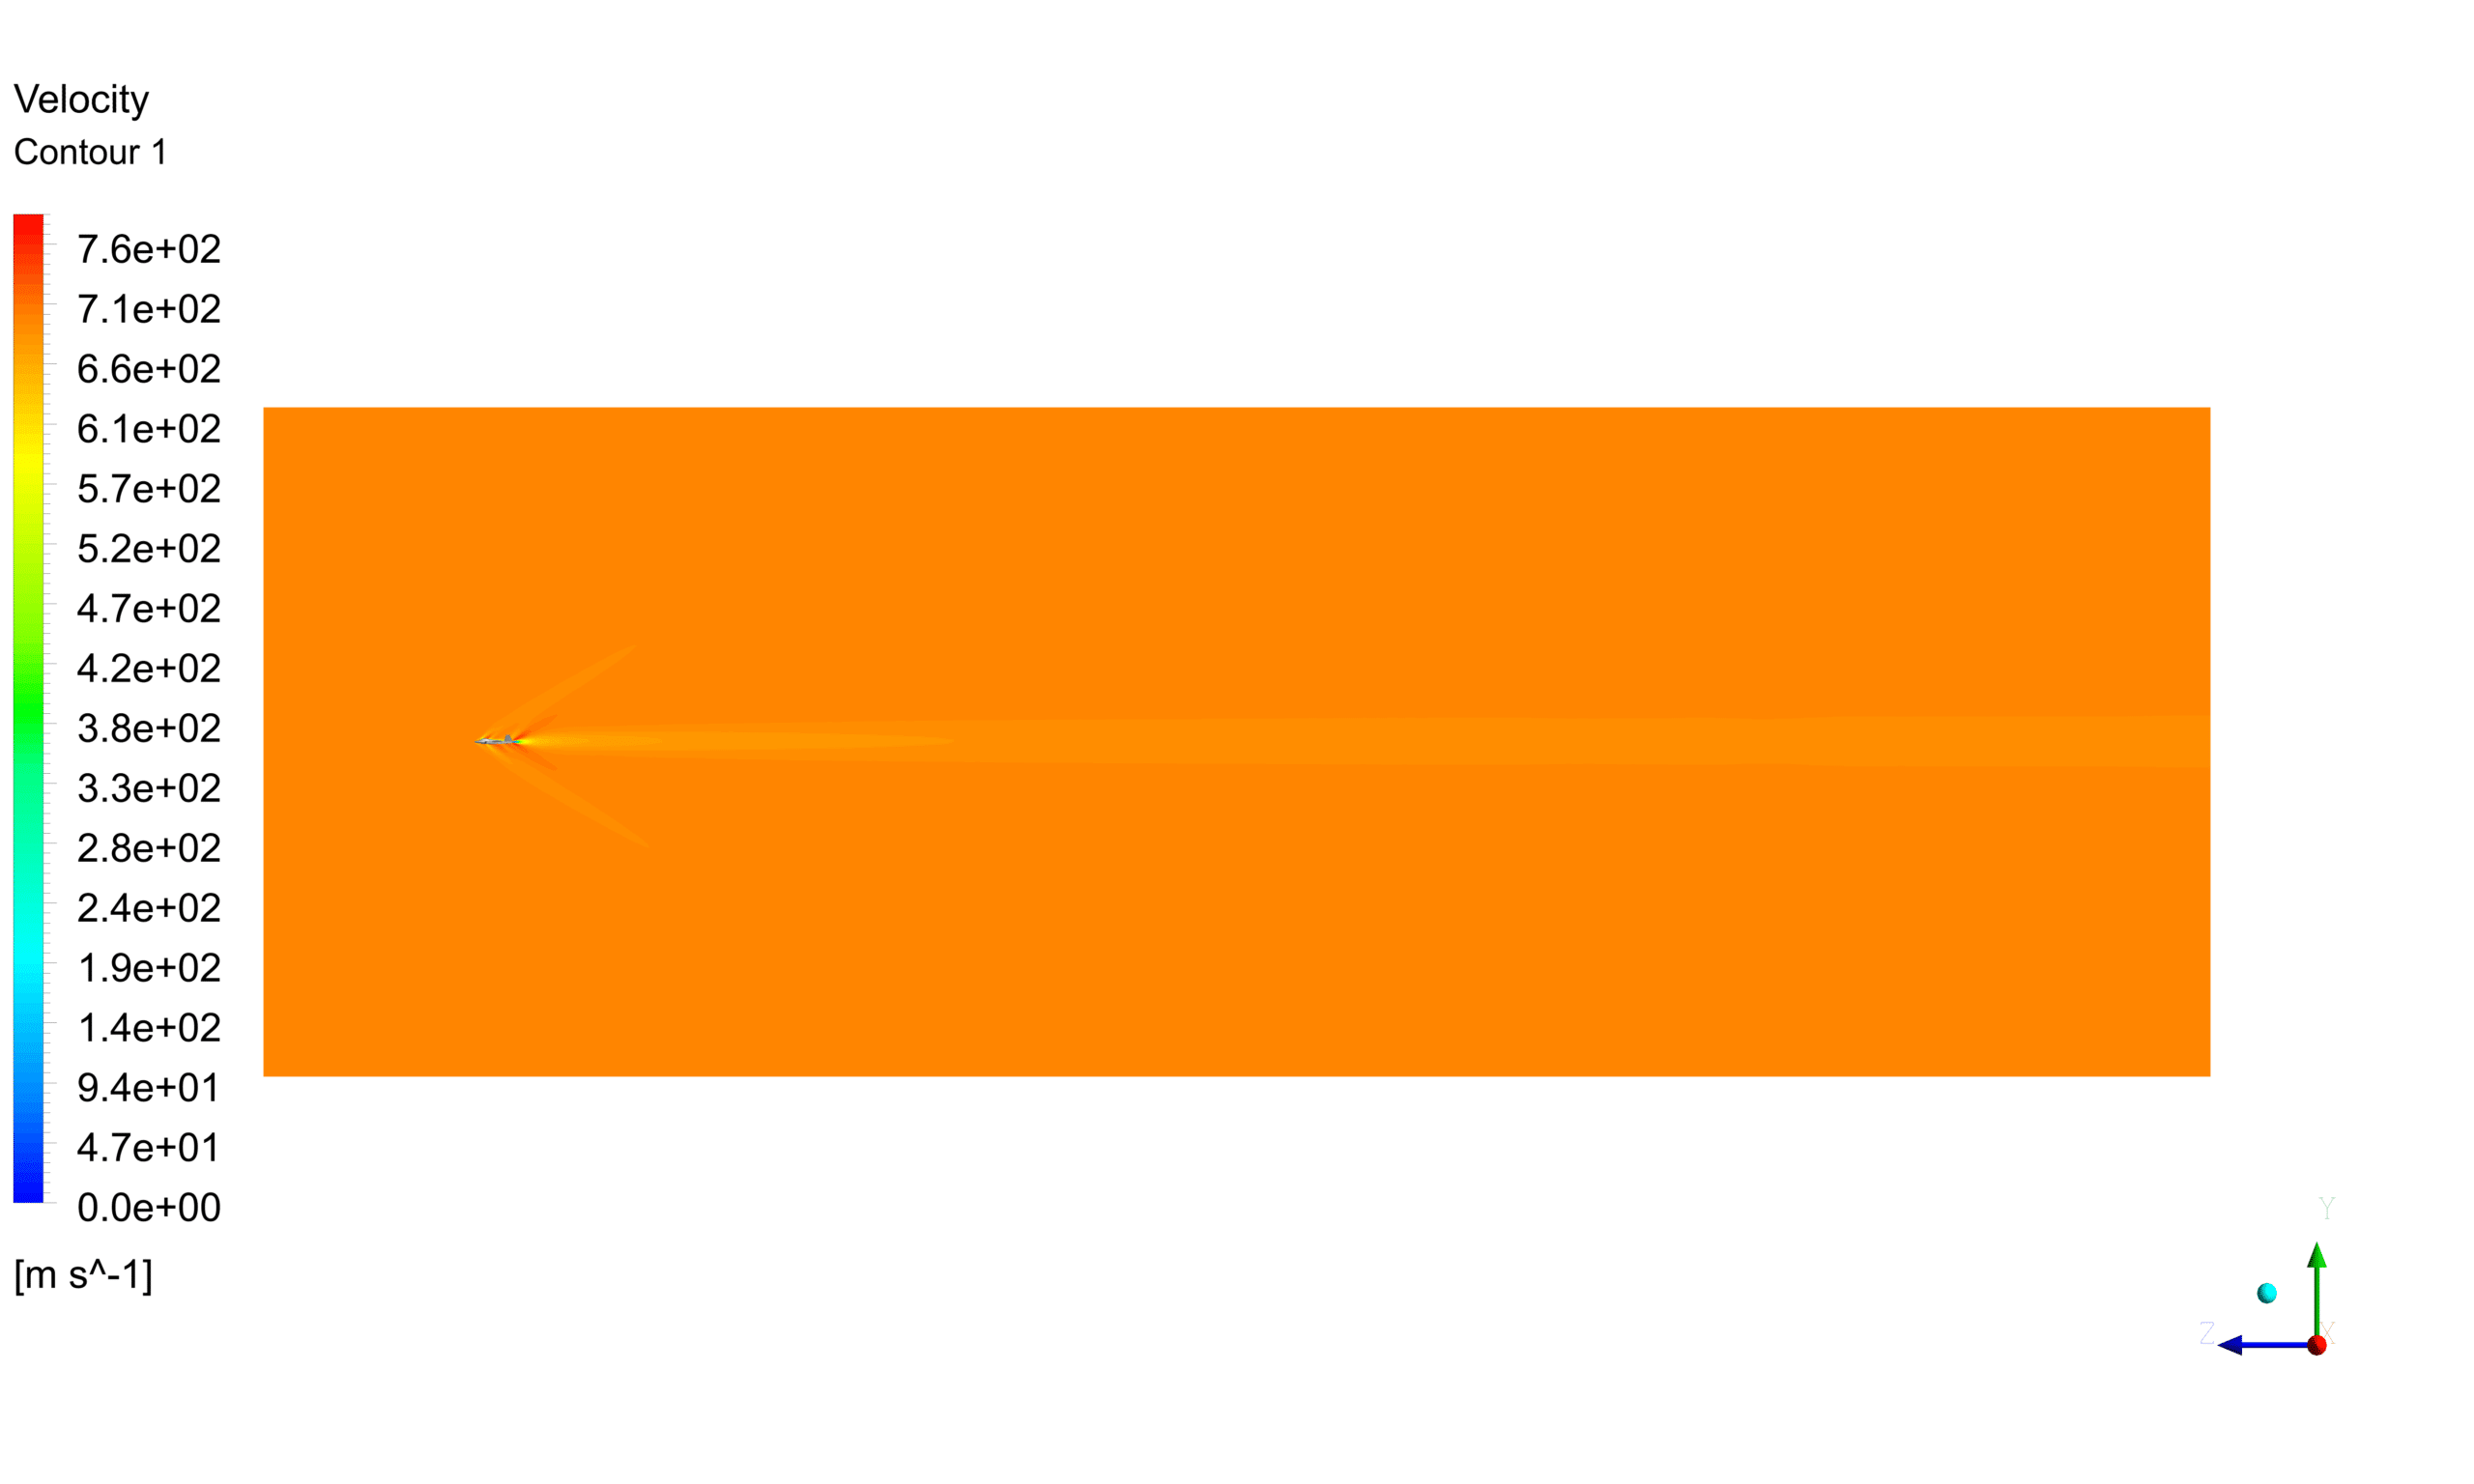
Therefore, the simulation has an error of approximately 5.04% compared to the actual thrust force of the F-22 engine. Velocity Contour (Fig. 3): The velocity contour plot shows the distribution of velocity magnitude around the F-22 aircraft. Higher velocities can be observed in the regions surrounding the aircraft, especially near the wings and tail.
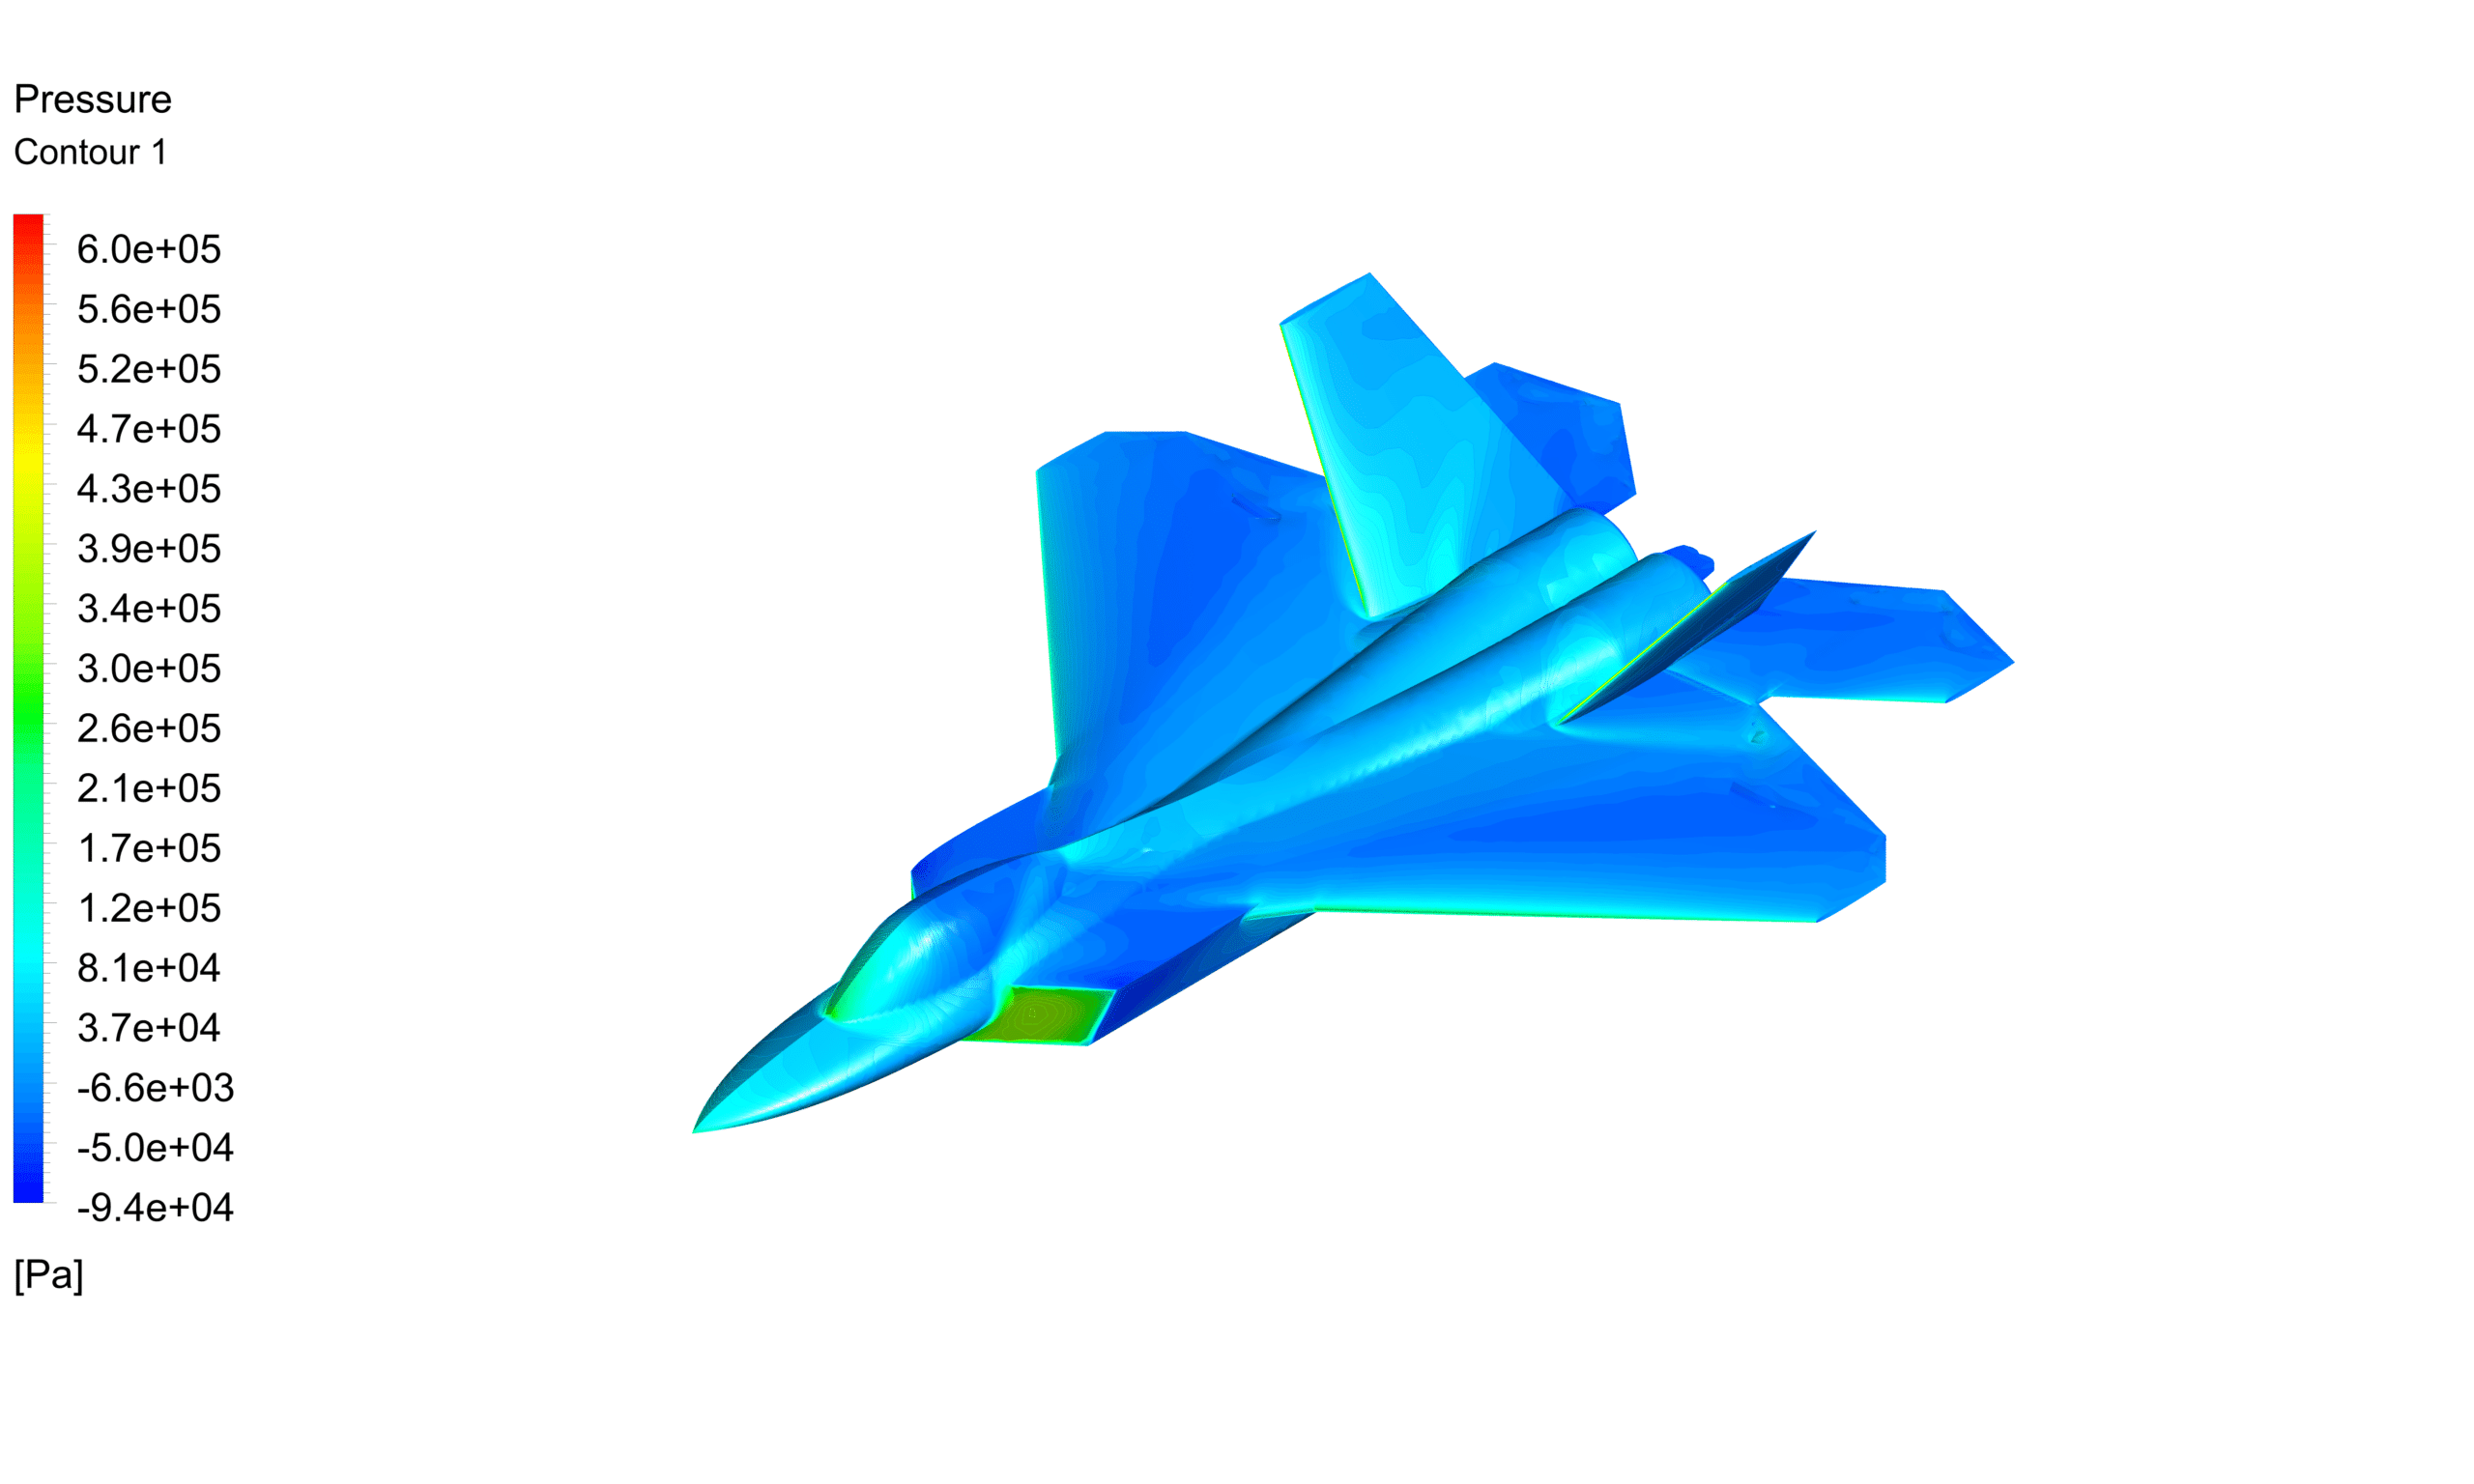
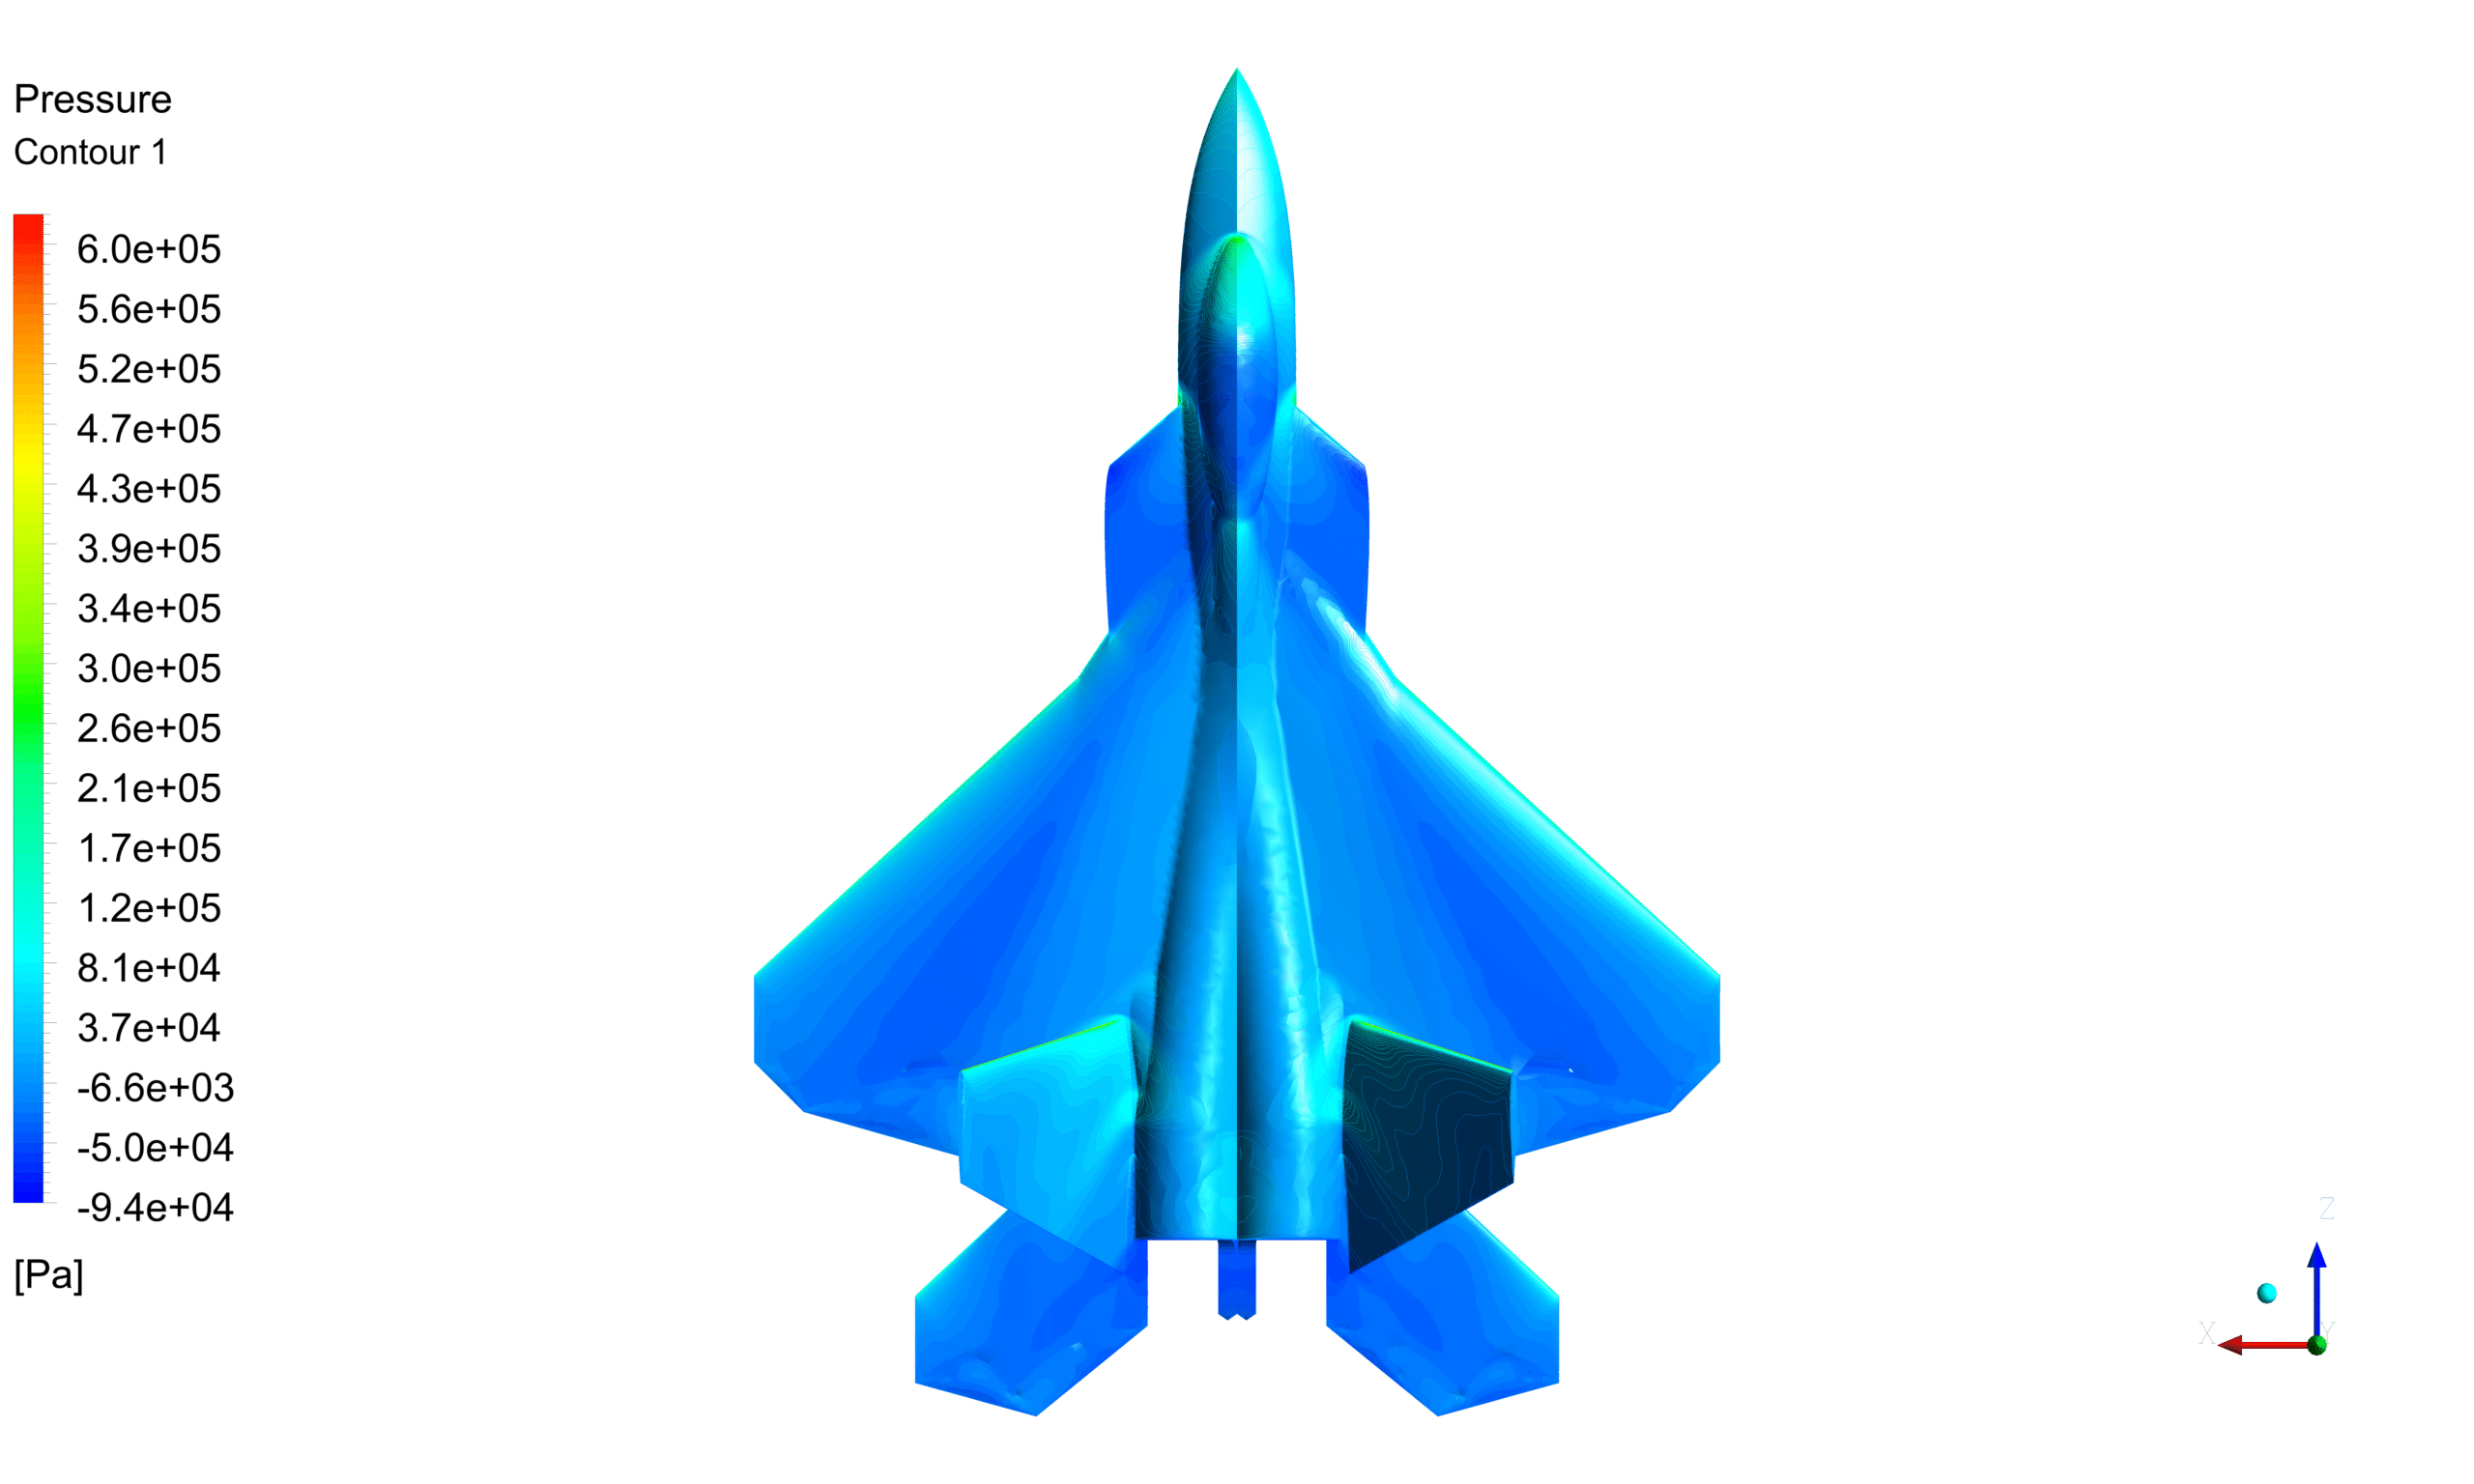
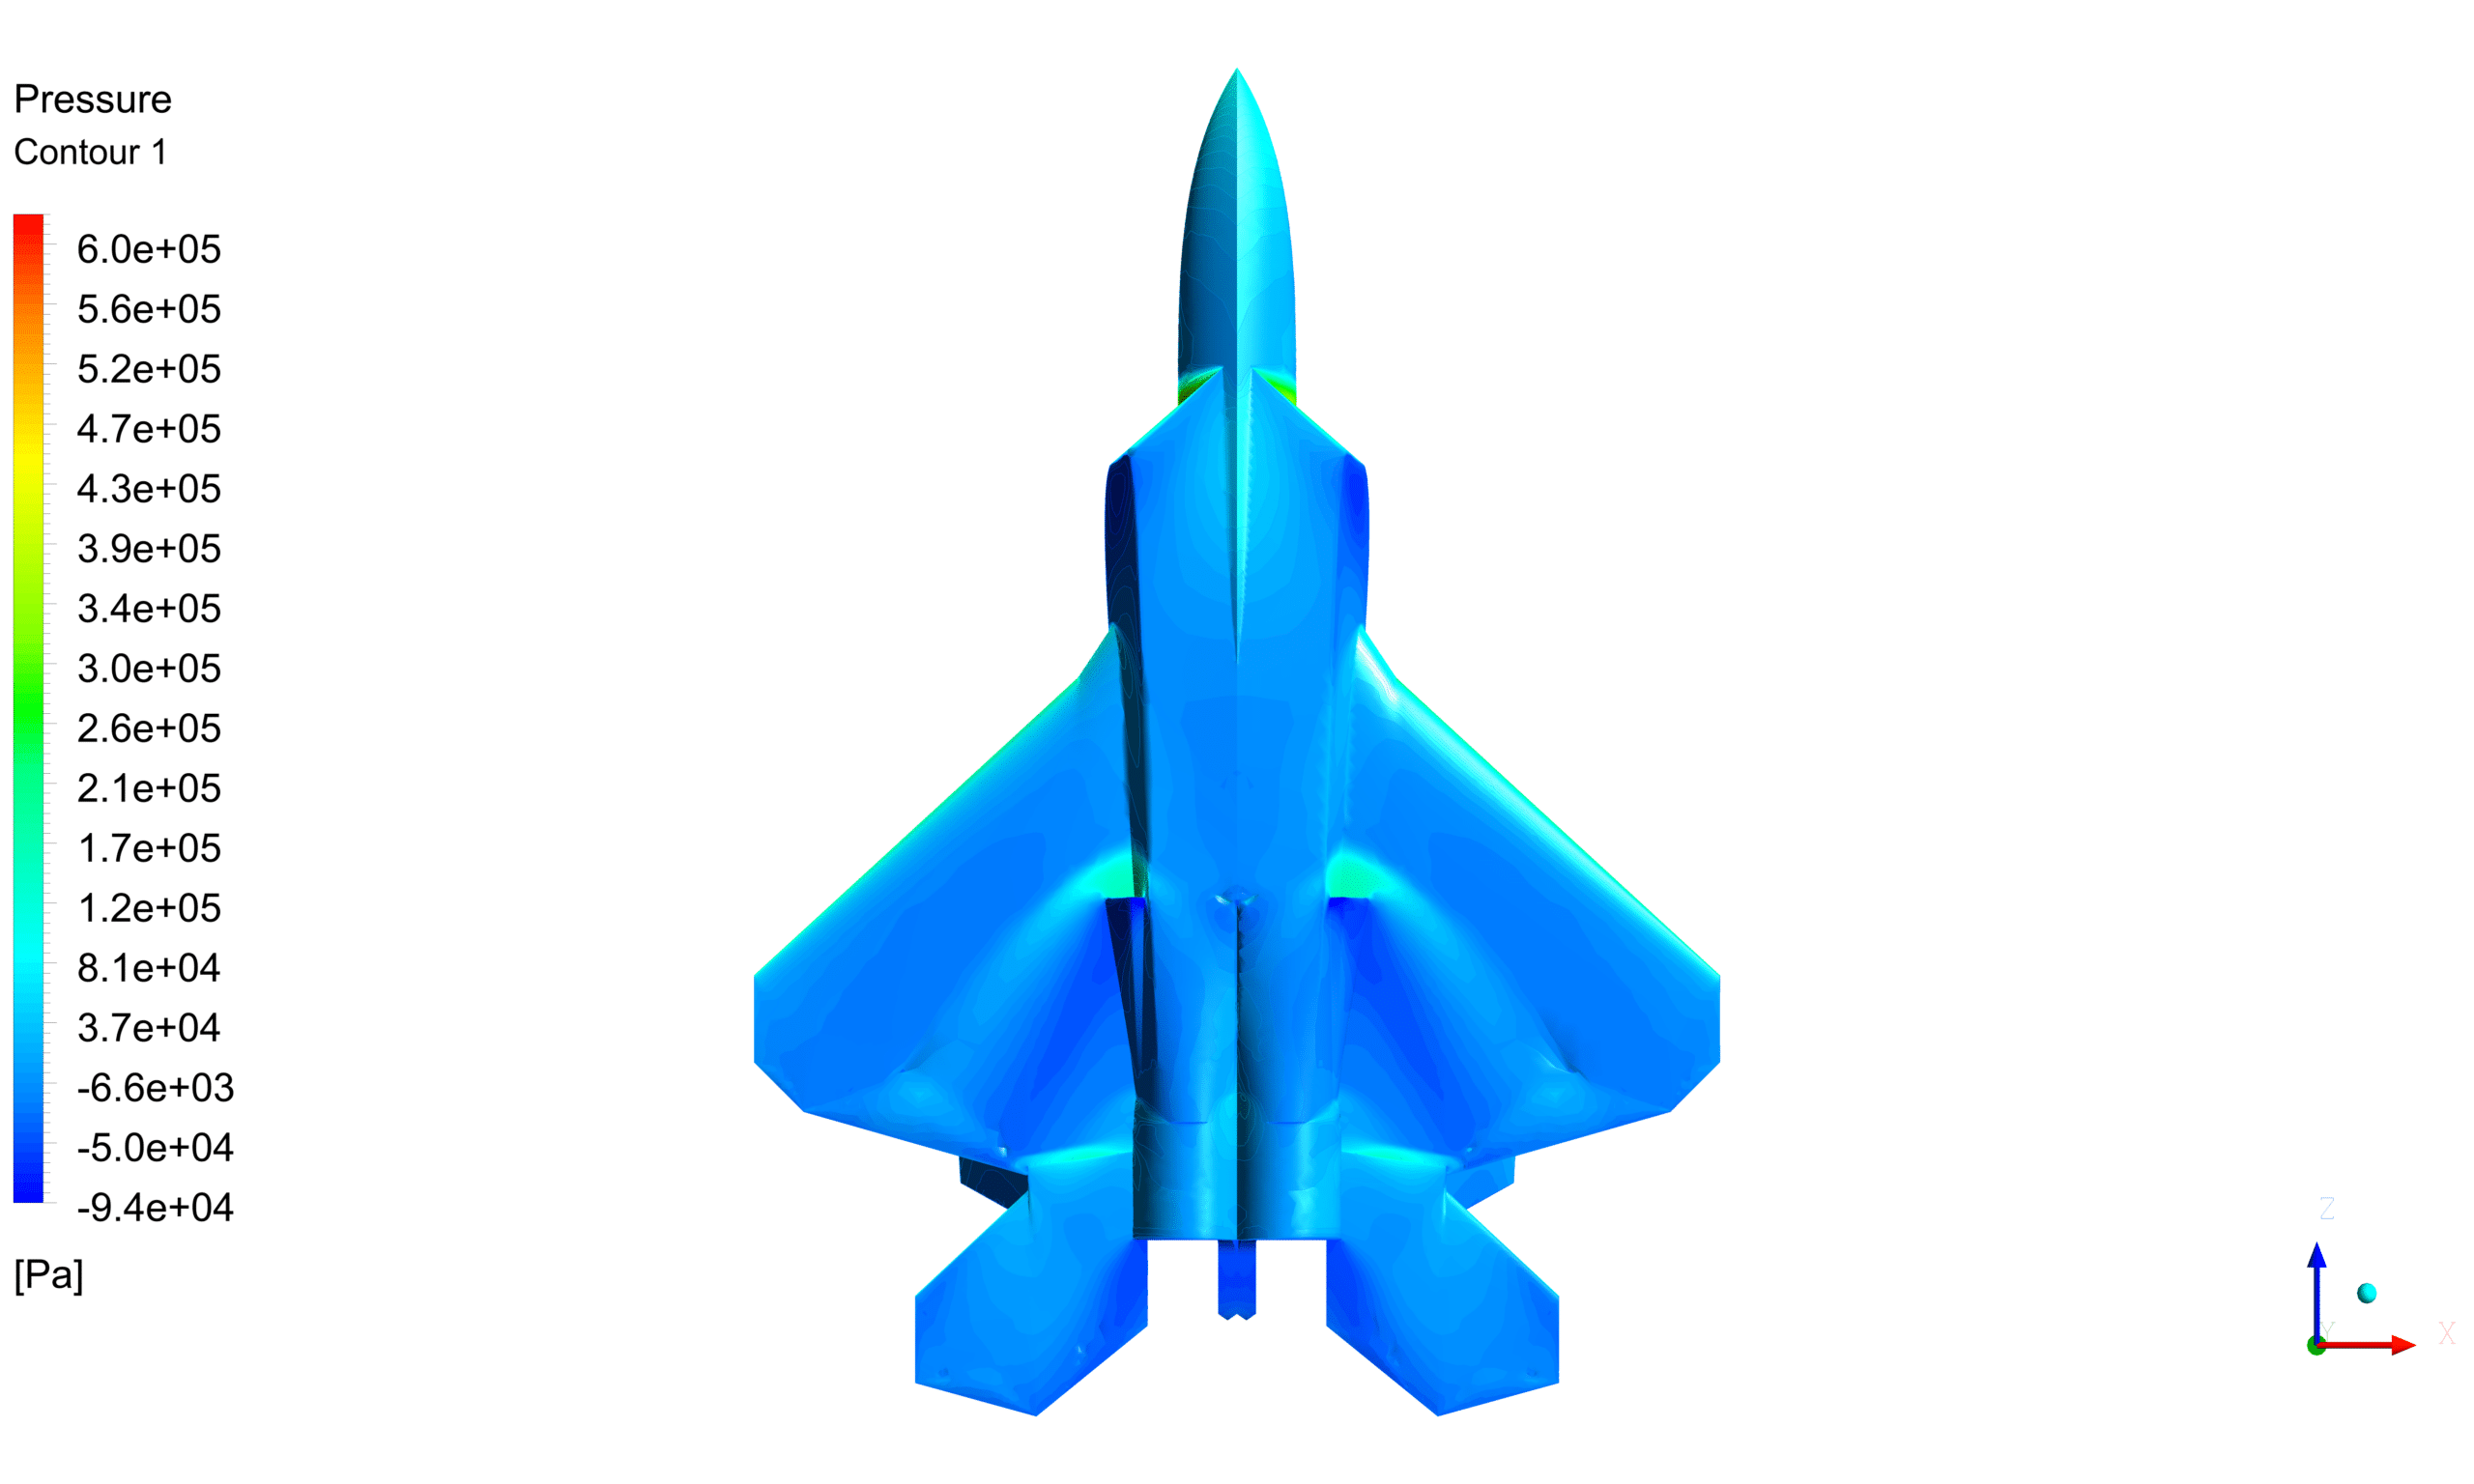
The pressure contour plot illustrates the pressure distribution around the F-22 aircraft. Higher pressure regions can be seen at the wings’ leading edges and nose, while lower pressure regions are visible on the upper surfaces of the wings and tail.
Fig. 4: Pressure
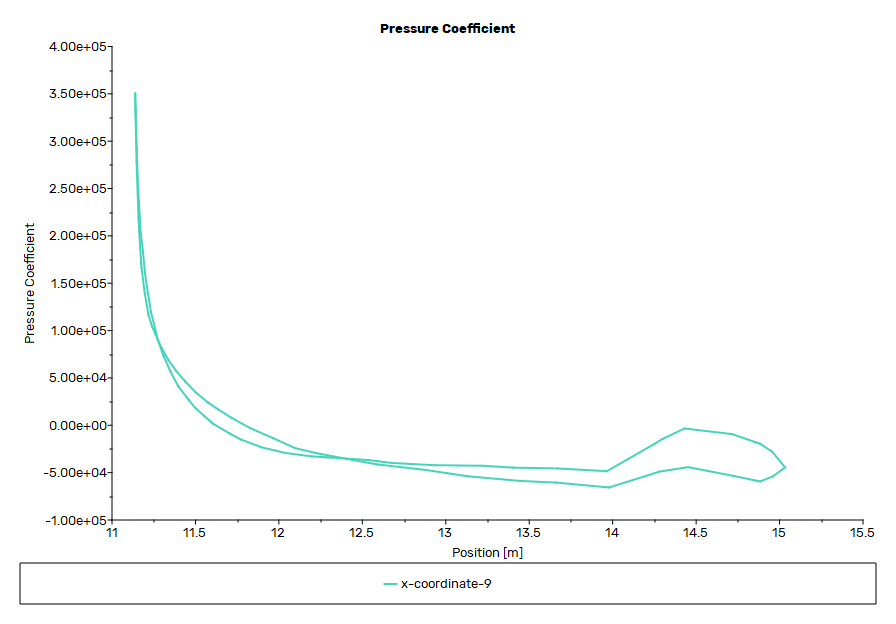
The pressure coefficient plot is displayed on a plane located 5 meters from the center of the aircraft, as indicated by the blue arrow. The pressure coefficient is a dimensionless quantity that represents the relative pressure distribution. The plot shows the variation of the pressure coefficient along the plane. Positive values indicate regions of high pressure, while negative values represent regions of low pressure relative to the freestream conditions.
Fig. 5: Pressure coefficient
Conclusion
The simulation of the F-22 aircraft using ANSYS Fluent provided valuable insights into the flow characteristics around the aircraft. The obtained drag force and its comparison with the actual thrust force of the F-22 engine demonstrate the accuracy of the simulation, with an error of approximately 5.04%. The contour plots of velocity, pressure, and pressure coefficient help visualize the flow behavior and pressure distribution around the aircraft. These results can be used for further analysis and optimization of the F-22 design.






Reviews
There are no reviews yet.