Fire and Smoke in a Factory Building, CFD Simulation Tutorial
$140.00 $70.00 Student Discount
- The present problem simulates the combustion reaction (Fire & Smoke) of a pressure tank in a factory via ANSYS Fluent software.
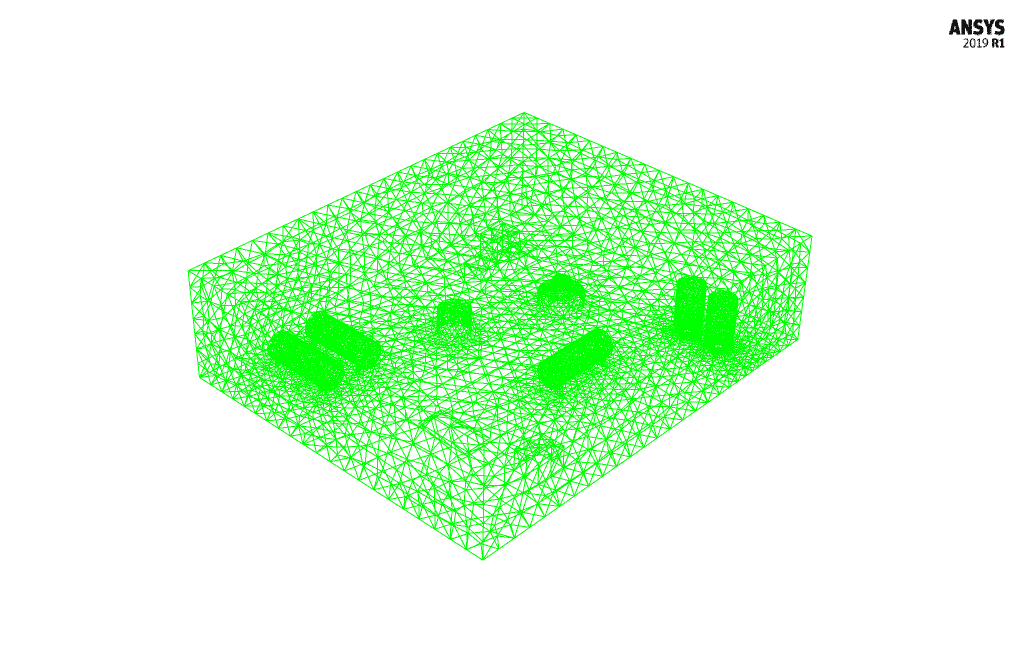
- We have designed the geometry using ANSYS Design Modeler software and created the mesh on this geometry using ANSYS meshing software. The mesh type is unstructured, with 124,162 cells.
- we use the Energy equation to capture the temperature.
- The Species Transport model is also used to define the Reaction model.
To Order Your Project or benefit from a CFD consultation, contact our experts via email (info@mr-cfd.com), online support tab, or WhatsApp at +44 7443 197273.
There are some Free Products to check our service quality.
If you want the training video in another language instead of English, ask it via info@mr-cfd.com after you buy the product.
Description
Fire & Smoke in a Factory Building, CFD Simulation Tutorial
Description
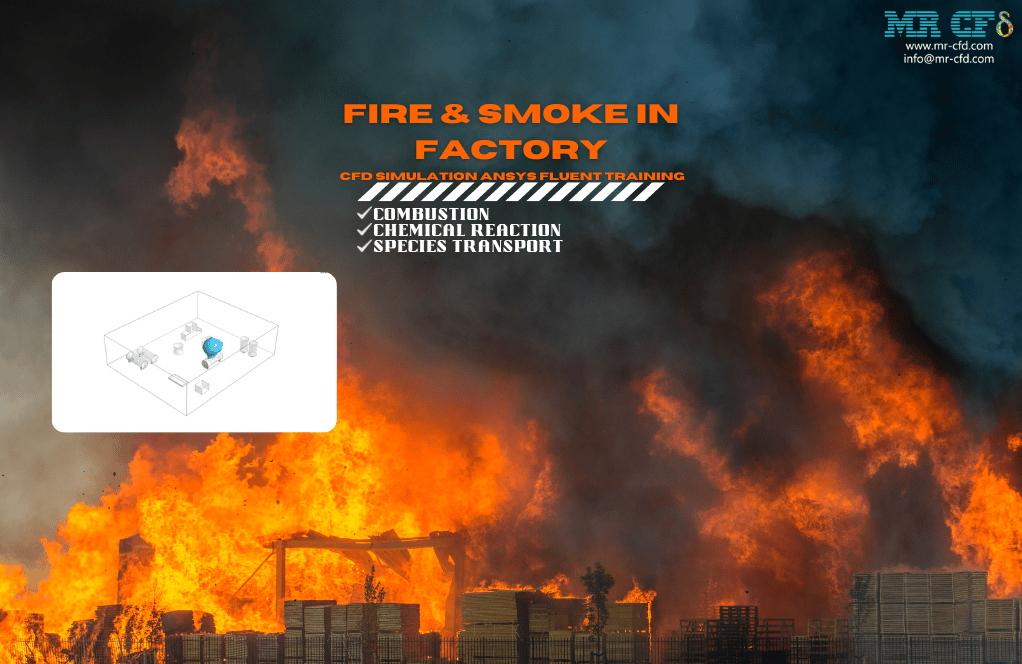
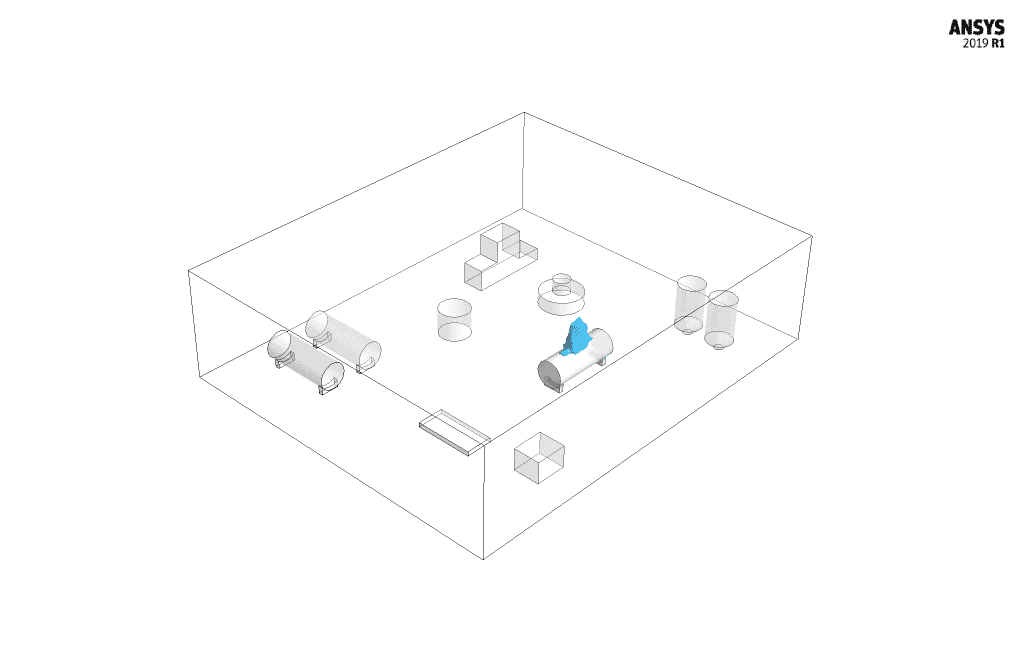
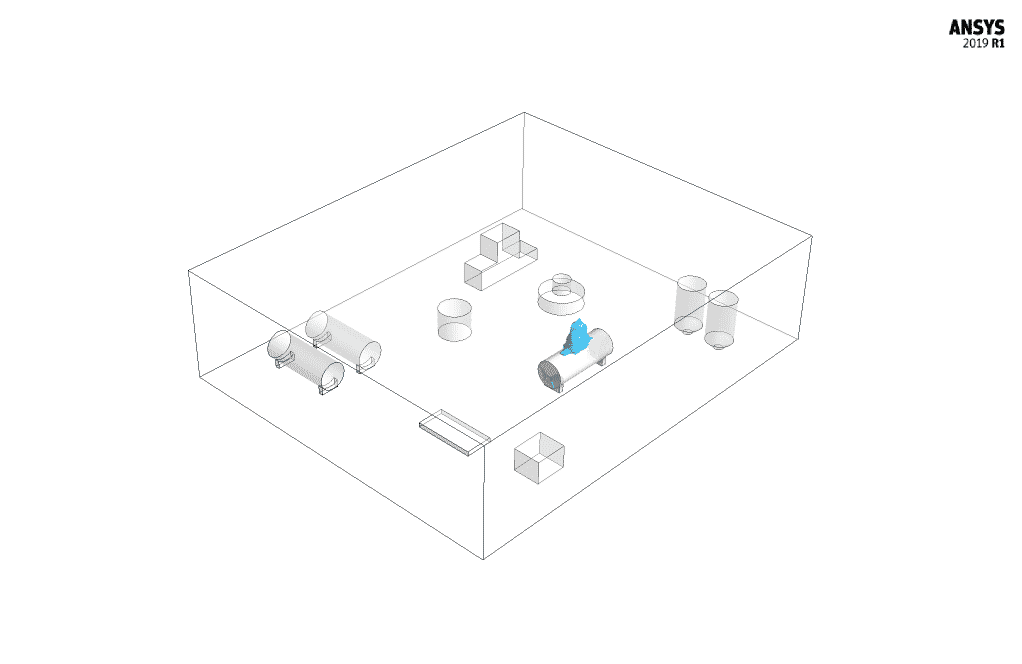
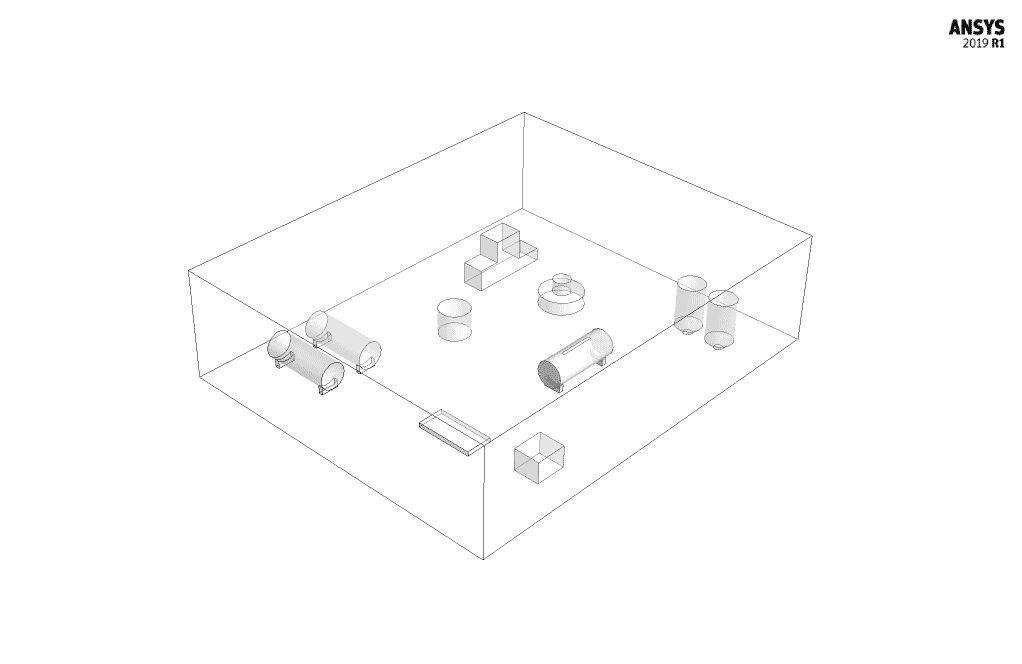
The present problem simulates the combustion reaction (Fire & Smoke) of a pressure tank in a factory via ANSYS Fluent software. A factory is modeled as a computational zone. Several elements have been modeled within this space, including tanks, plates, boxes, etc. A cylindrical pressurized tank leaks, and flammable methane gas leaks into the tank’s outer environment. At this time, the contact of free ambient airflow with methane leads to reaction.
This project aims to investigate the behavior of the combustion flame and the path of smoke emission from combustion over time. So this simulation is done in a time-dependent manner.
This simulation is done in two steps. The first step only investigated methane leakage from inside the tank to the outside environment.
In this case, methane is released into the interior space over time. In the second step, this leaked gas reacts with air and ignites. As a result of the combustion reaction, flame and smoke or carbon dioxide gas are produced.
In the first step, there is no need to define the chemical reaction; only air and methane are defined without the reaction occurring.
The air inside the factory and the methane inside the tank is under pressure. The groove at the top of the tank is modeled as the leakage center, and defining a higher initial pressure for methane inside the tank under pressure leads to the release of methane to the outside environment.
After the release has fully occurred, it is time to define the combustion reaction between methane and free air. So with stoichiometric coefficients, a chemical reaction including methane and oxygen as reactants and carbon dioxide and vapor as products are defined.
Also, a spark is defined in the groove section of the tank to help the combustion occur.
The present geometry is designed in a 3D model via Design Modeler, and the mesh has been done via ANSYS Meshing software. Mesh is done unstructured, and the number of production cells equals 124,162.
Methodology: Fire & Smoke in a Factory Building
The viscous model used in the solution is RNG k-epsilon with a standard wall function. The solver is Transient, and the Energy equation is enabled to capture the temperature. Also Species Transport model simulates the combustion reaction.
Conclusion
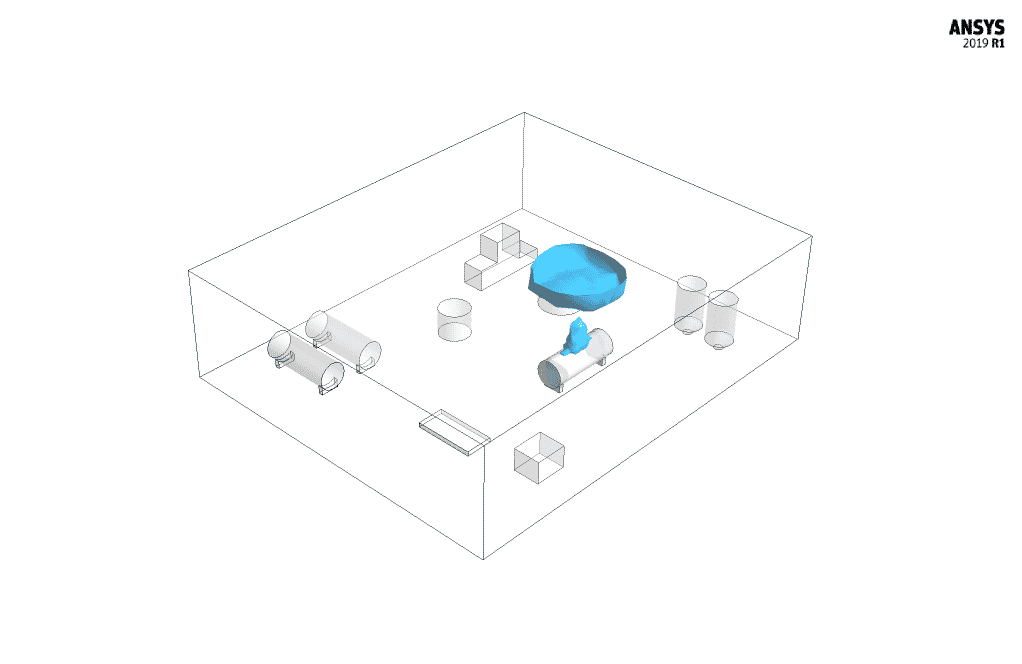
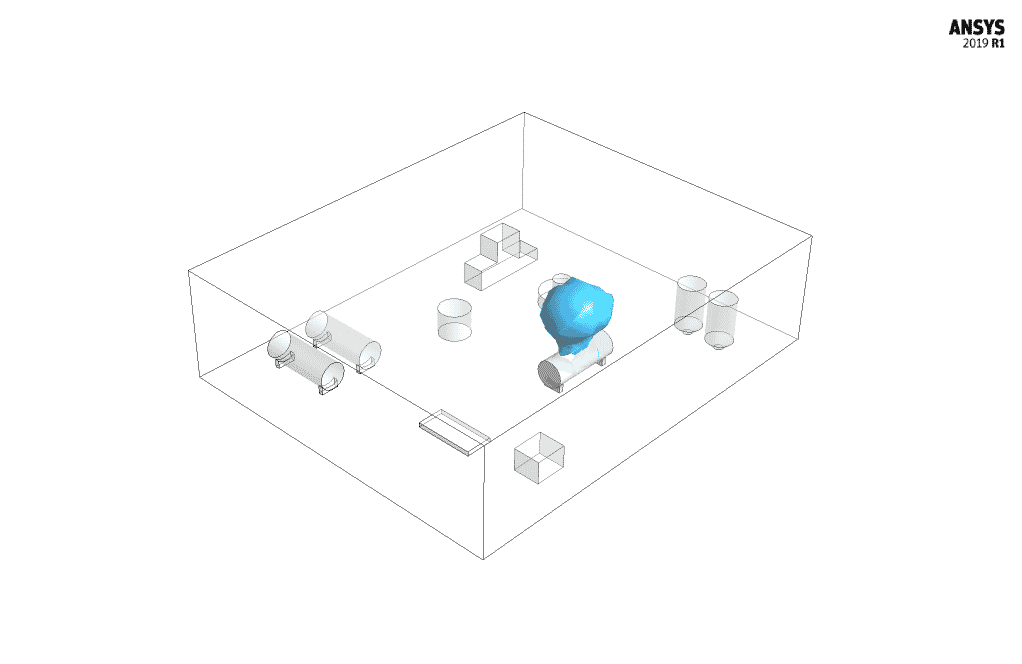
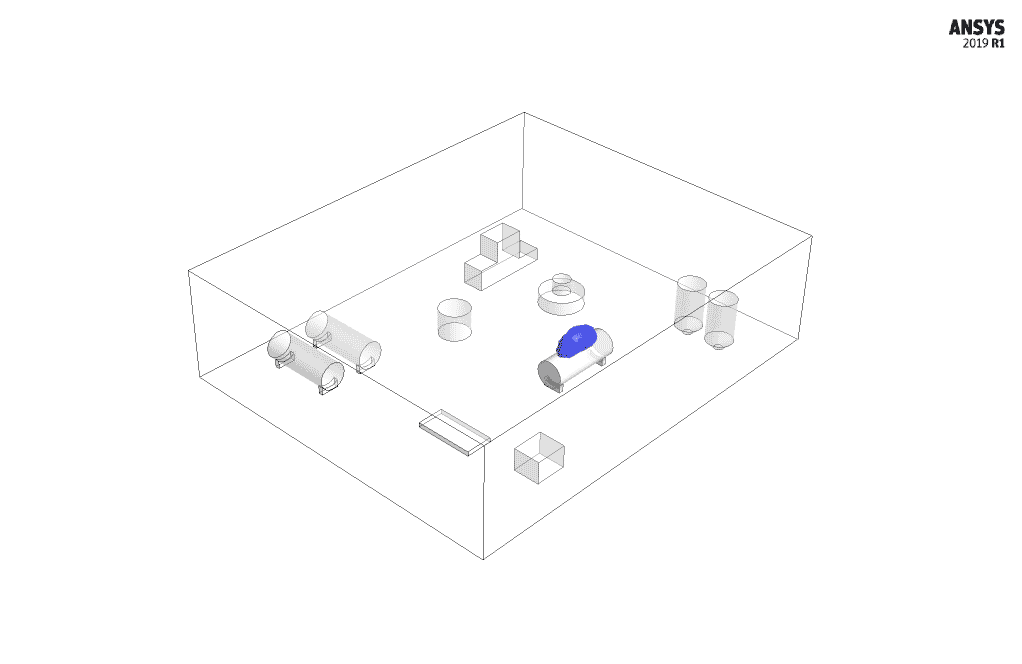
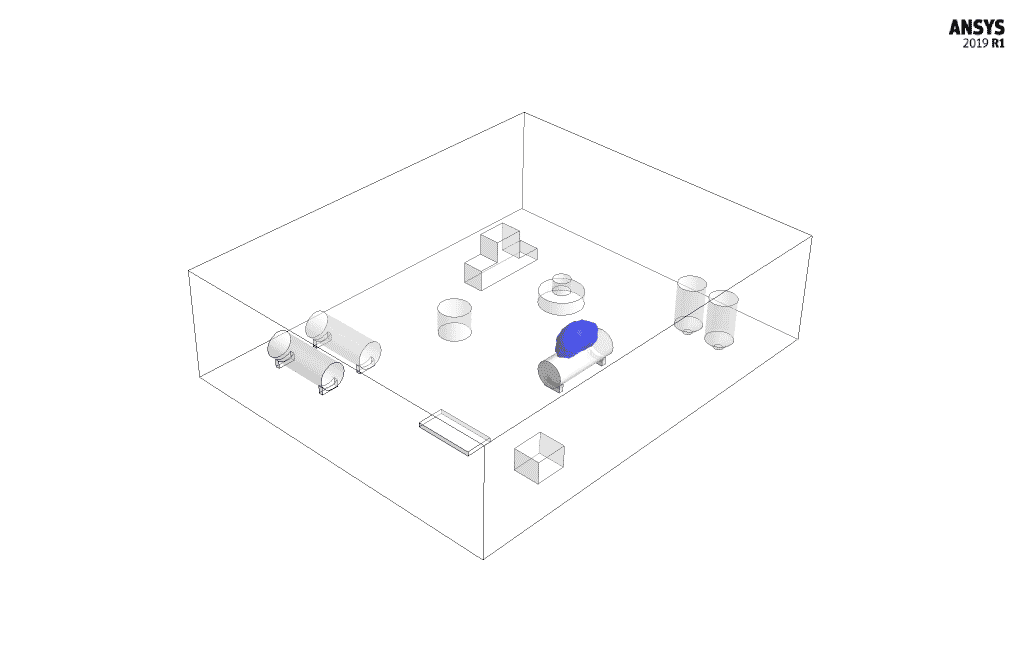
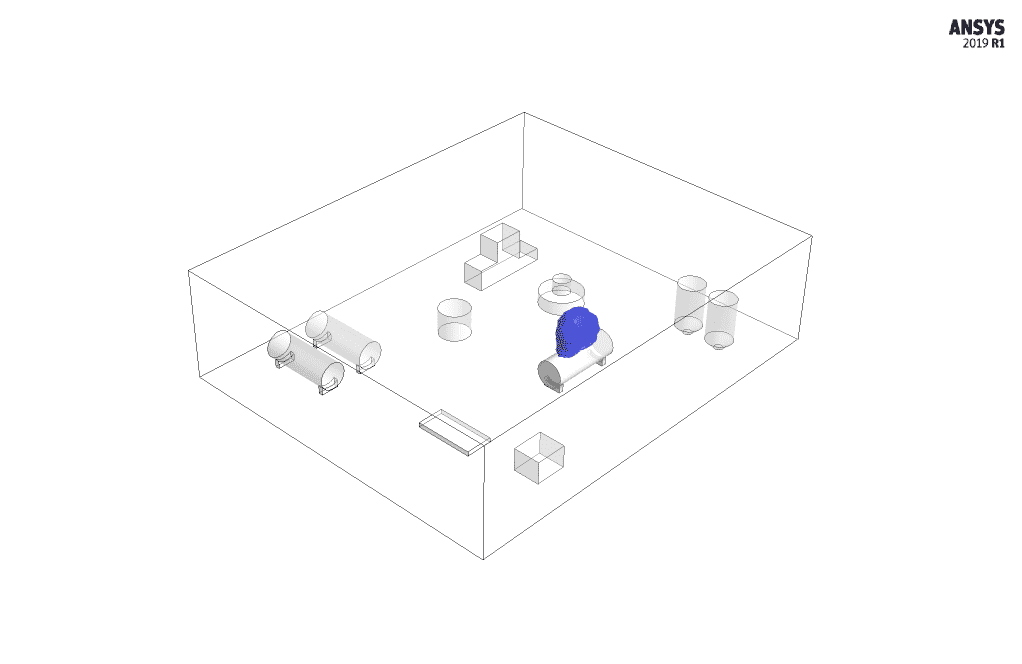
After simulation, the behavior of the reactants and reaction products has been investigated. To study the behavior of the flame, the iso-surface has been used at a constant temperature. The flame temperature is determined as a measure to represent the level of the flame.
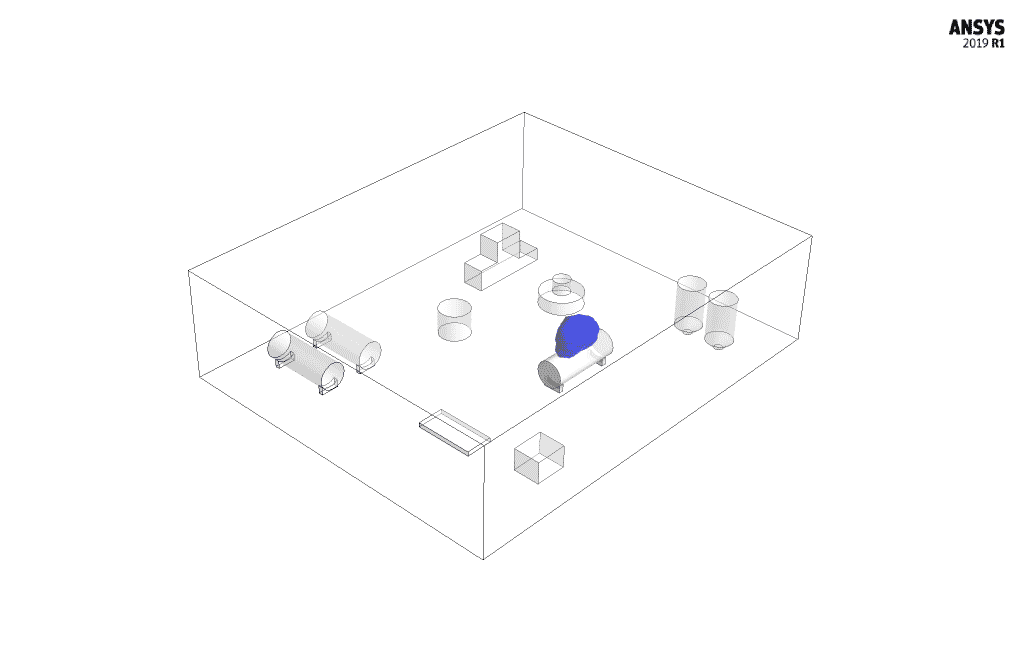
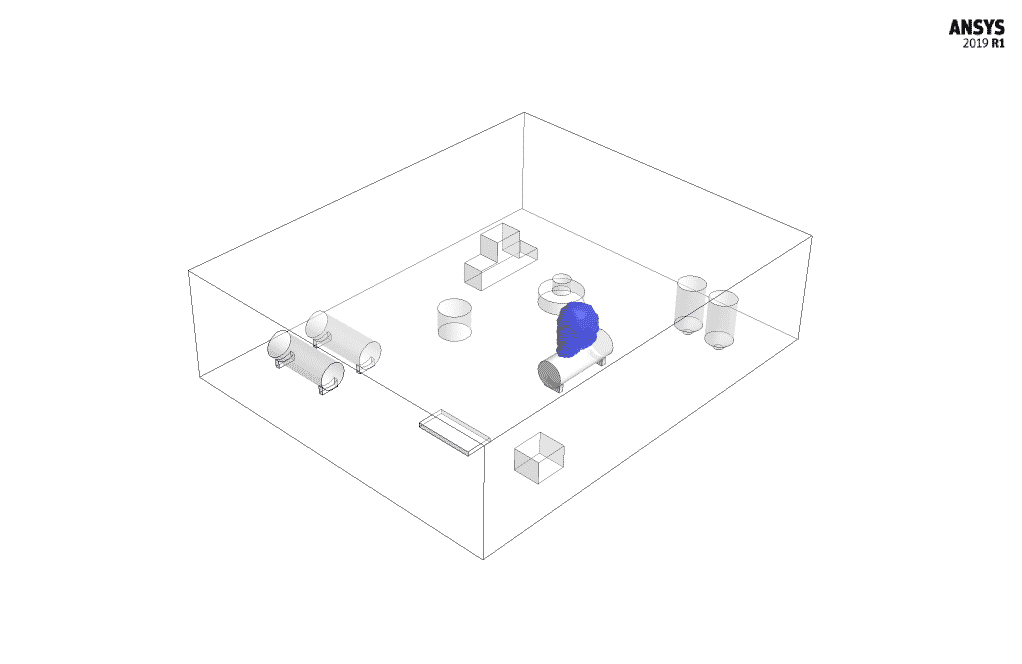
In investigating the smoke resulting from combustion, the behavior of carbon dioxide gas has been examined; Because this gas is defined as a product of the combustion reaction. Carbon dioxide gas mass fraction is determined as a measure representing the iso-surface.
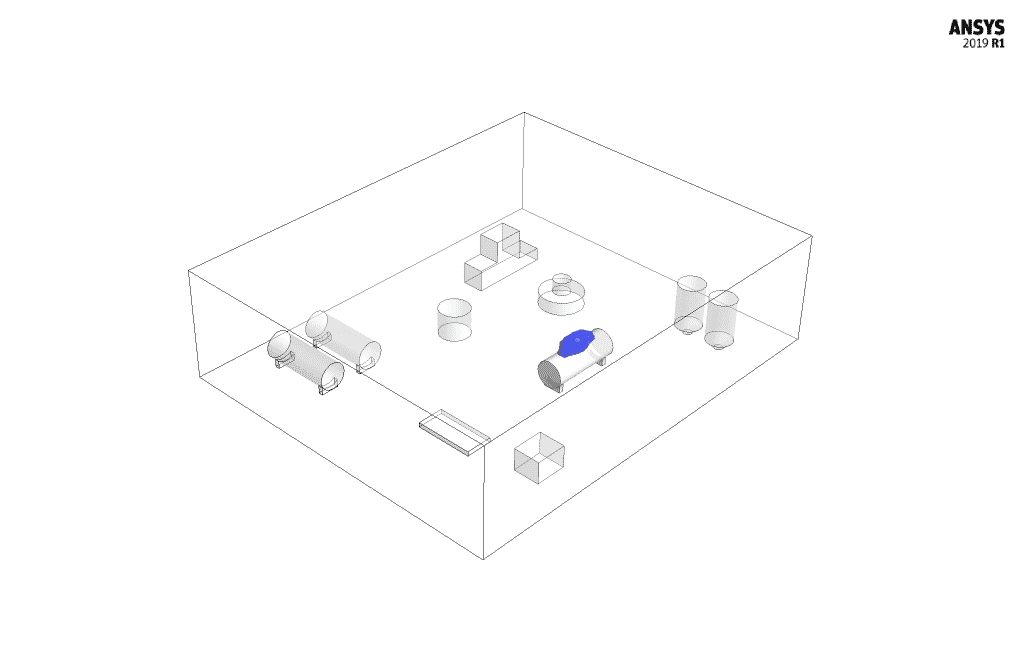
To investigate the behavior of methane caused by leakage, its mass fraction has been determined as a measure of the iso-surface display. Investigation of methane leakage before combustion and combustion flame and carbon dioxide emission after combustion has been done.
This review has been done at different times and presented by animation. In the first step of the simulation, the results show the tank leakage process well. First, methane fills the pressure tank; But when a leak occurs, methane is released into the outside environment at high pressure. In the second step of the simulation, the results are presented as the occurrence of the combustion reaction.
The temperature rises significantly, which is caused by the explosion. The flame grows at the beginning of combustion and begins to fade over time. Carbon dioxide gas is also produced in space. This indicates the combustion incidence; this gas is considered the product of this chemical reaction. Carbon dioxide gas also erupts at the beginning of ignition, and its volume decreases with time.

Dr. Charlene Fritsch –
The tutorial sounds comprehensive, but I’m wondering if the temperature effects on surrounding materials were also modelled or if the focus was exclusively on the fire and smoke dynamics?
MR CFD Support –
The focus of the simulation was primarily on fire dynamics, including flame spread and smoke dispersions due to the combustion of methane, but the energy equation was enabled, allowing for temperature predictions too. Surrounding materials’ thermal responses may not be directly modeled in this case unless specified.
Heather Bayer –
Is it possible to visualize how the combustion process evolves over time in the simulated space?
MR CFD Support –
Yes, it is possible to visualize the combustion process over time using the animations of simulation results. These include representations of temperature for flame behavior and mass fractions for smoke and methane gas distributions.
Jeremy Kreiger –
The tutorial was exceptionally detailed! The step by step progression from methane leakage to the combustion reaction really highlighted the dynamic capabilities of ANSYS Fluent. Especially, the visualization of carbon dioxide gas behavior and the disappearing flame over time using animations was incredibly valuable.
MR CFD Support –
Thank you for your kind words! We strive to provide comprehensive and user-friendly tutorials that deliver deep understanding of complex simulations. We are thrilled to hear that the animations and detailed stages of the simulation were helpful. If you have any further questions or need assistance, feel free to reach out!
Lilla Haag –
I’m impressed with how the FSI method and VOF model work together in capturing the movements of the fish cage. The way wave behavior was addressed in the simulation seemed particularly intricate. Are there any considerations for the scale of bio-fouling on the cage that might occur over time and how this might affect the fluid dynamics?
MR CFD Support –
Thank you for your kind words and insightful observation. In this particular simulation, the phenomena of bio-fouling and its direct effects over time have not been explicitly modeled or discussed. However, bio-fouling can indeed influence the dynamics significantly by altering the surface roughness and hence the boundary layer characteristics. If such effects are of interest, they could be included in future simulations either by implementing a surface roughness parameter that changes over time or by directly simulating the bio-fouling process, which could influence both structural properties of the cage and the flow dynamics. Your interest in the comprehensive nature of such simulations is appreciated, and we’re happy to hear you found the content valuable.
Valentin Spencer –
Is it possible to track real-time smoke concentration levels within different areas of the factory during the simulation?
MR CFD Support –
Yes, it’s possible to track real-time smoke concentration levels within different areas of the factory during the simulation by analyzing the mass fraction data of the combustion products, such as carbon dioxide gas, in the simulated environment over time.
Breanna Smith PhD –
Does the simulation also track the temperature distribution throughout the factory during combustion, and how can this temperature data be useful for fire safety analysis?
MR CFD Support –
Yes, the simulation tracks the temperature distribution throughout the factory during the combustion process, because the Energy equation is enabled. This temperature data is useful for fire safety analysis because it can help pinpoint hotspots and areas of high-risk, allowing safety engineers to design effective fire control and evacuation procedures.