Fluid-Structure Interaction in a Vertical Axis Water Turbine using MRF Method, Ansys Fluent
$300.00 $150.00 Student Discount
- The problem numerically simulates the Fluid-Structure Interaction over Vertical Turbine using ANSYS Fluent software.
- We designed the 3-D model using the Design Modeler software.
- The mesh grid is generated using ANSYS Meshing, and the element number equals 705,465.
- The Frame Motion method is used to rotate the turbine.
- FSI model analyses total strain, and stress over the VAWT turbine.
To Order Your Project or benefit from a CFD consultation, contact our experts via email (info@mr-cfd.com), online support tab, or WhatsApp at +44 7443 197273.
There are some Free Products to check our service quality.
If you want the training video in another language instead of English, ask it via info@mr-cfd.com after you buy the product.
Description
Fluid-Structure Interaction in a Vertical Axis Water Turbine using the MRF Method CFD Simulation, Ansys Fluent
Description
The present study investigates the water flow around a vertical-axis water turbine using unsteady CFD simulation by ANSYS Fluent software. In the present case, The Multiple Reference Frame (MRF) method is used to rotate the turbine; The frame motion model allows you to simulate the fluid flow in a moving reference frame while maintaining a stationary mesh, simplifying the computational setup and reducing the computational cost compared to other approaches like sliding mesh or dynamic mesh.
The fluid flowing through the turbine blades exerts complex and dynamic forces on the turbine body, leading to significant structural deformations and potential resizing of the blade geometry. These fluid-induced forces result from the intricate interaction between the fluid flow and the turbine blades, which is governed by the principles of fluid dynamics and structural mechanics. To accurately capture and analyze this complex phenomenon, the Fluid-Structure Interaction (FSI) method is employed, coupling the fluid flow simulation with the Transient Structural analysis.
Simulation is Transient and the solver is pressure-based. Also, the gravity force effect is ignored.
 Geometry & Mesh
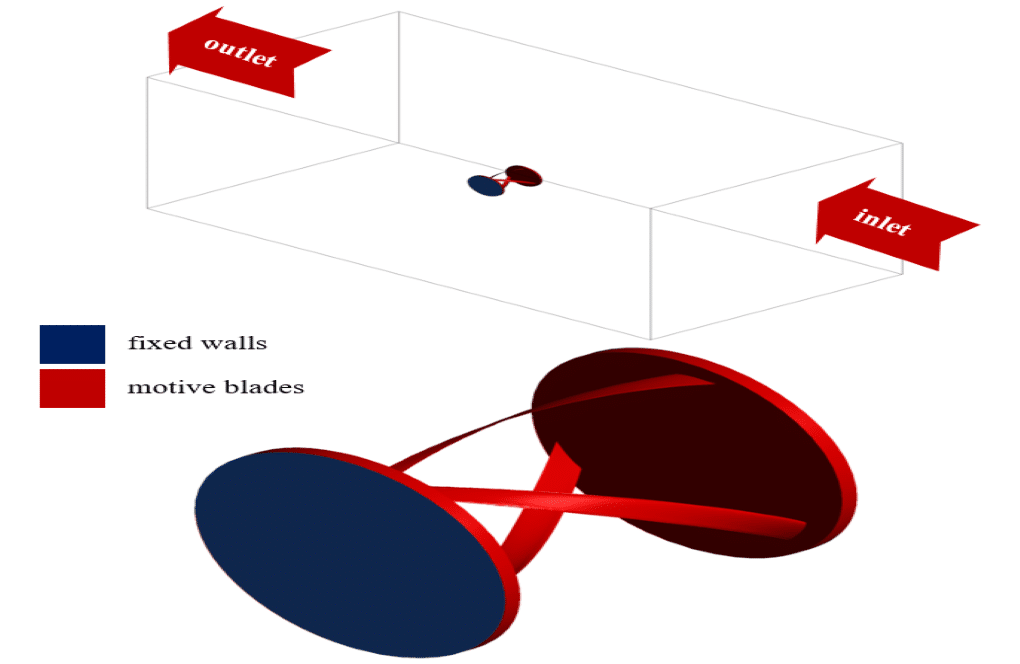
The present 3-D model was designed by Design Modeler software. The geometry of the model consists of a large cubic space as a fluid domain and the water turbine inside this space as a solid domain. The unstructured mesh was carried out by ANSYS Meshing software. The element number equals 705,465.
CFD Simulation
A pressure-based, transient solver was employed to capture the time-dependent flow characteristics and structural response of the turbine.
The SST k-omega turbulence model was chosen to accurately represent the turbulent nature of the flow around the turbine.
The Structure model with the Linear Elasticity option was enabled to investigate the displacement of the blades, allowing for the analysis of fluid-structure interaction.
Boundary Conditions
The domain inlet is set as a velocity-inlet with a uniform velocity of 5 m/s. The domain outlet is defined as a pressure outlet with a gauge pressure of 0 kPa. The blades are modeled as adiabatic walls with a no-slip condition and an intrinsic FSI setup. The top and bottom blade’s walls are also adiabatic with a no-slip condition, but their displacements in the x, y, and z directions are set to zero. The side part of the geometry is set as a symmetry boundary condition.
The frame motion is set up using the Multiple Reference Frame (MRF) approach with a rotational speed of 50 rpm.
Results
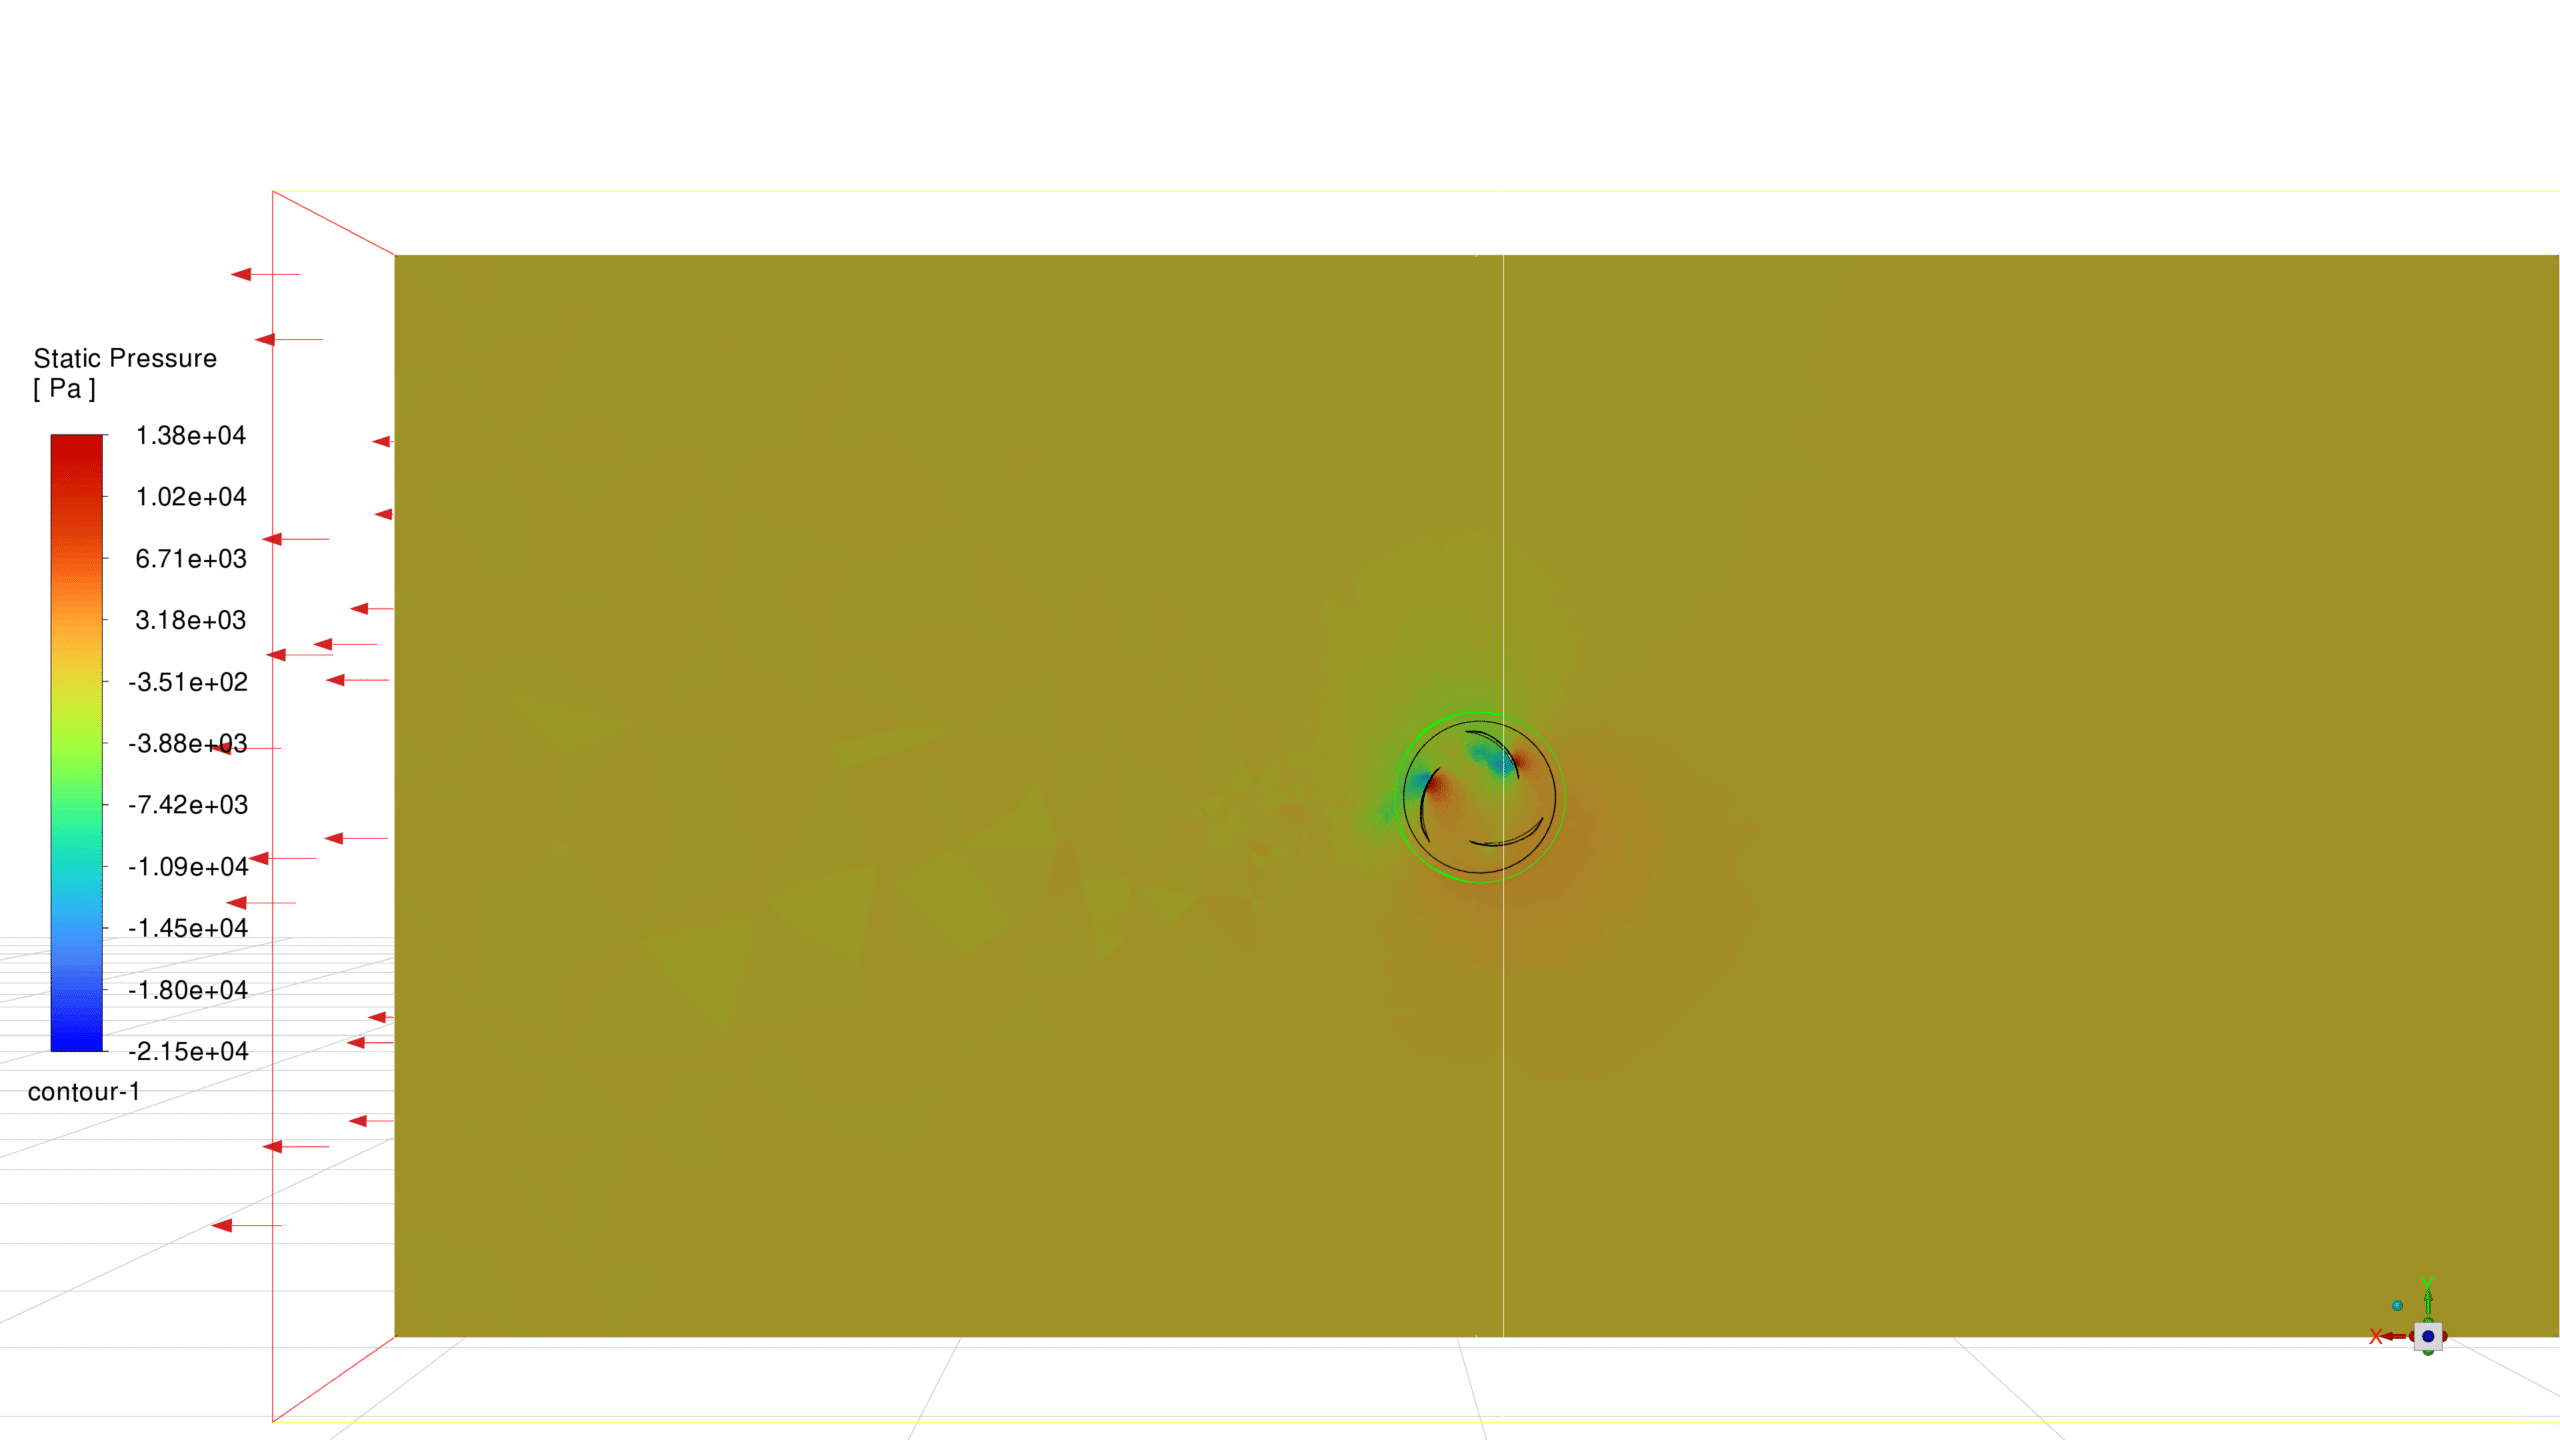
High-Pressure Regions:
- The pressure contour plot reveals high-pressure regions, particularly on the upstream side of the turbine blades (the side facing the incoming fluid flow).
- These high-pressure zones are likely caused by the fluid impacting and stagnating against the blade surfaces.
- The high-pressure regions contribute to the forces acting on the turbine blades, influencing their structural deformation and overall performance.
Low-Pressure Regions:
- The contour plot also shows low-pressure regions, especially on the downstream side of the turbine blades (the side facing away from the incoming fluid flow).
- These low-pressure zones are likely associated with flow separation, wake formation, and vortex shedding behind the blades.
- The low-pressure regions can affect the lift and drag forces acting on the blades and may impact the turbine’s efficiency and power output.
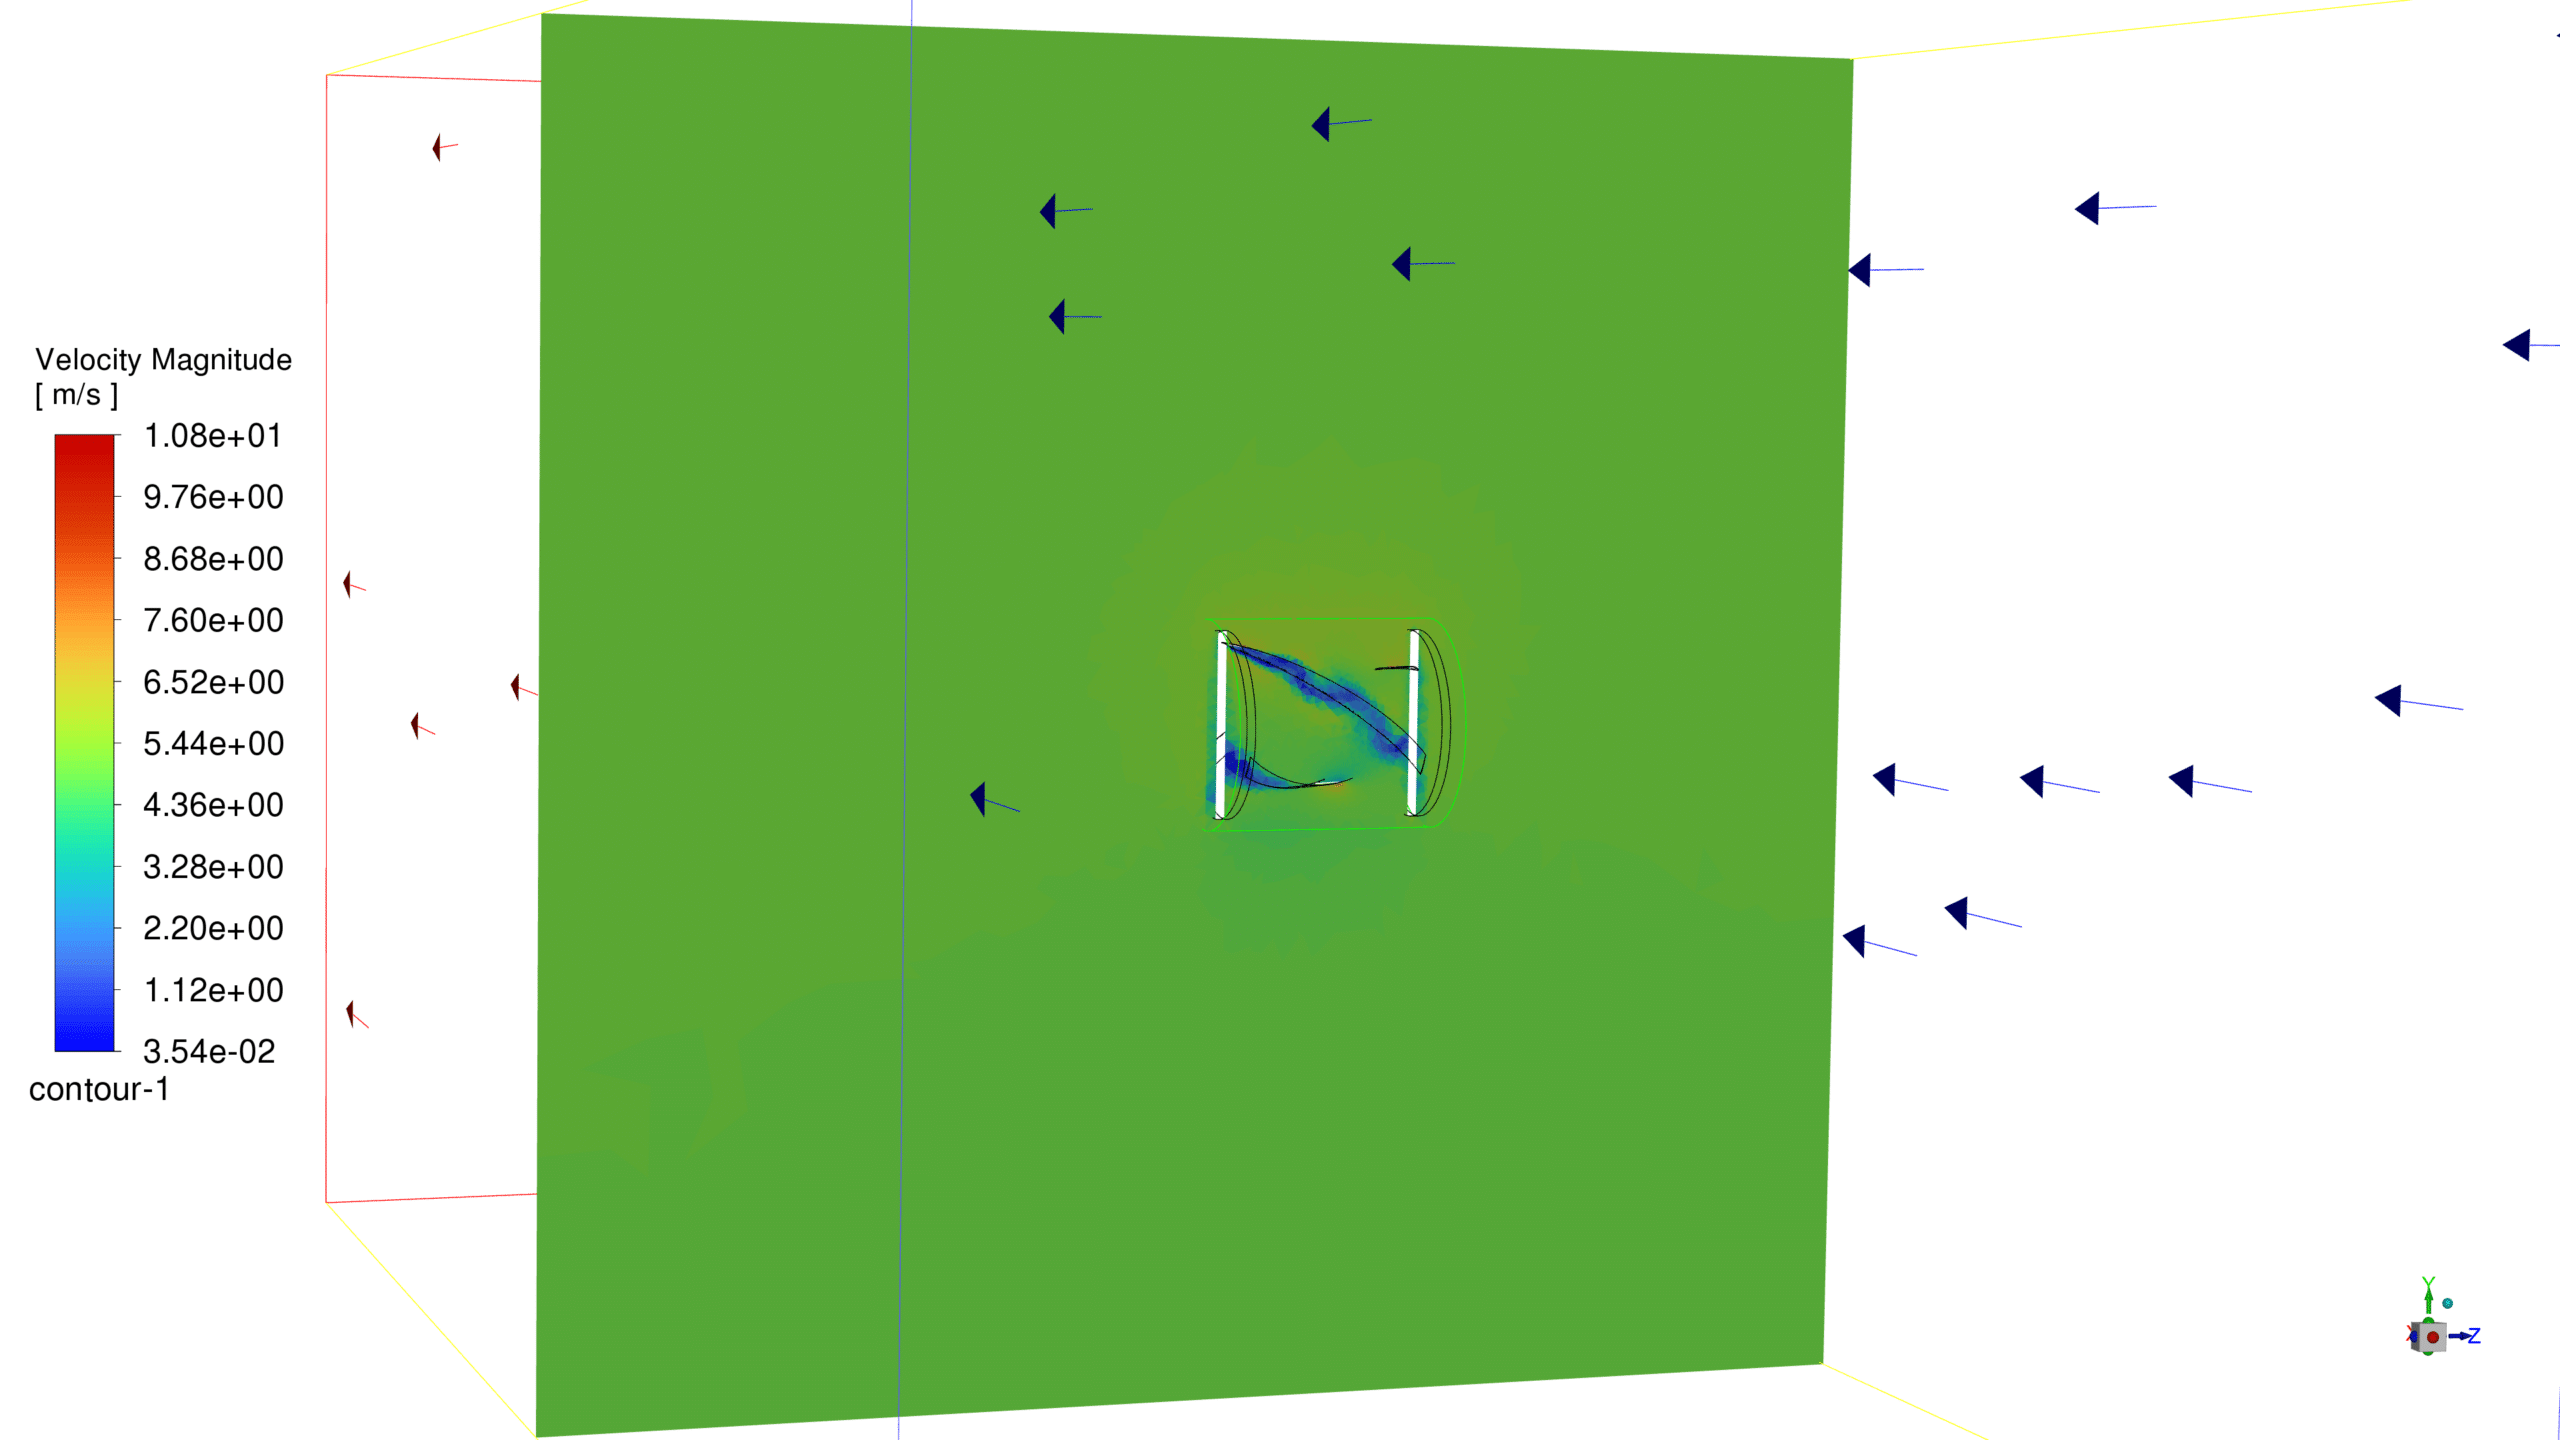
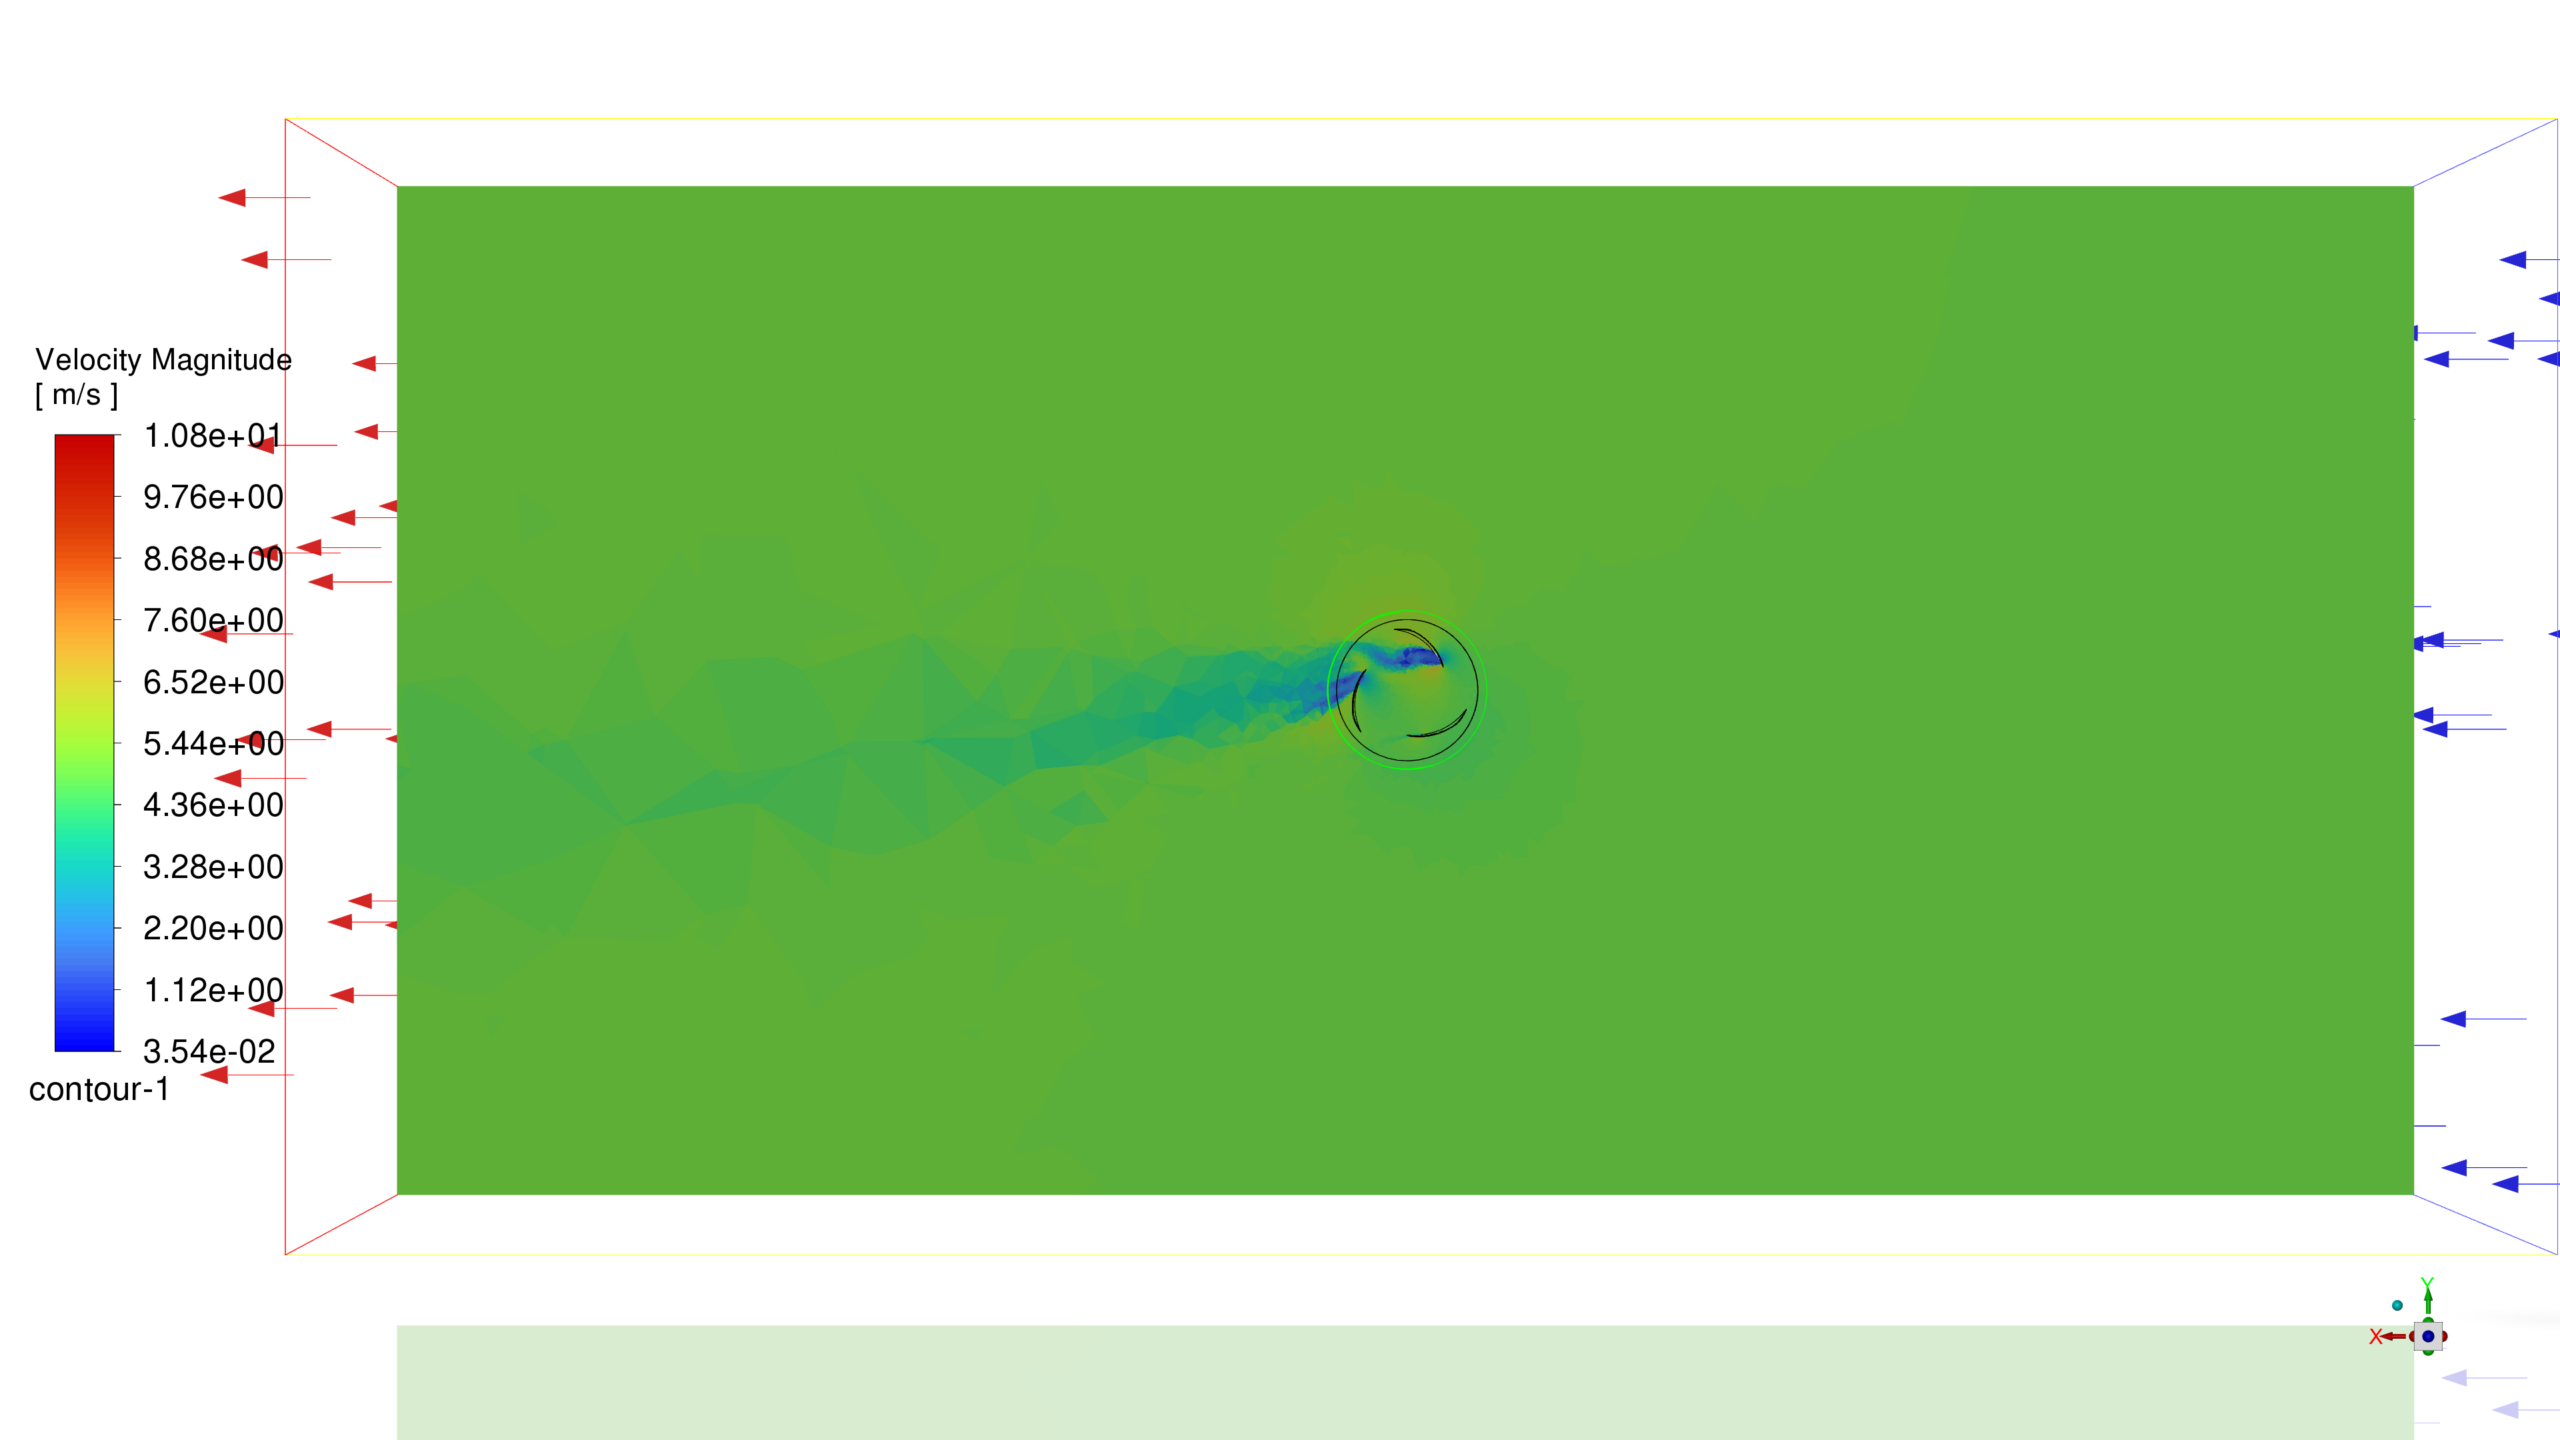
High-velocity regions:
- The velocity contour plot reveals high-velocity regions, particularly near the tips of the turbine blades.
- These high-velocity zones are likely associated with the acceleration of the fluid as it passes through the narrow gaps between the blade tips and the turbine housing.
- The high velocities can contribute to increased turbulence, noise, and potential erosion of the blade tips.
- The velocity contour plot complements the information provided by the pressure contour plot
Regions of high velocity often correspond to areas of low pressure, as described by Bernoulli’s principle.
By analyzing both the velocity and pressure contours, a more comprehensive understanding of the fluid dynamics around the turbine blades can be obtained.
total displacement
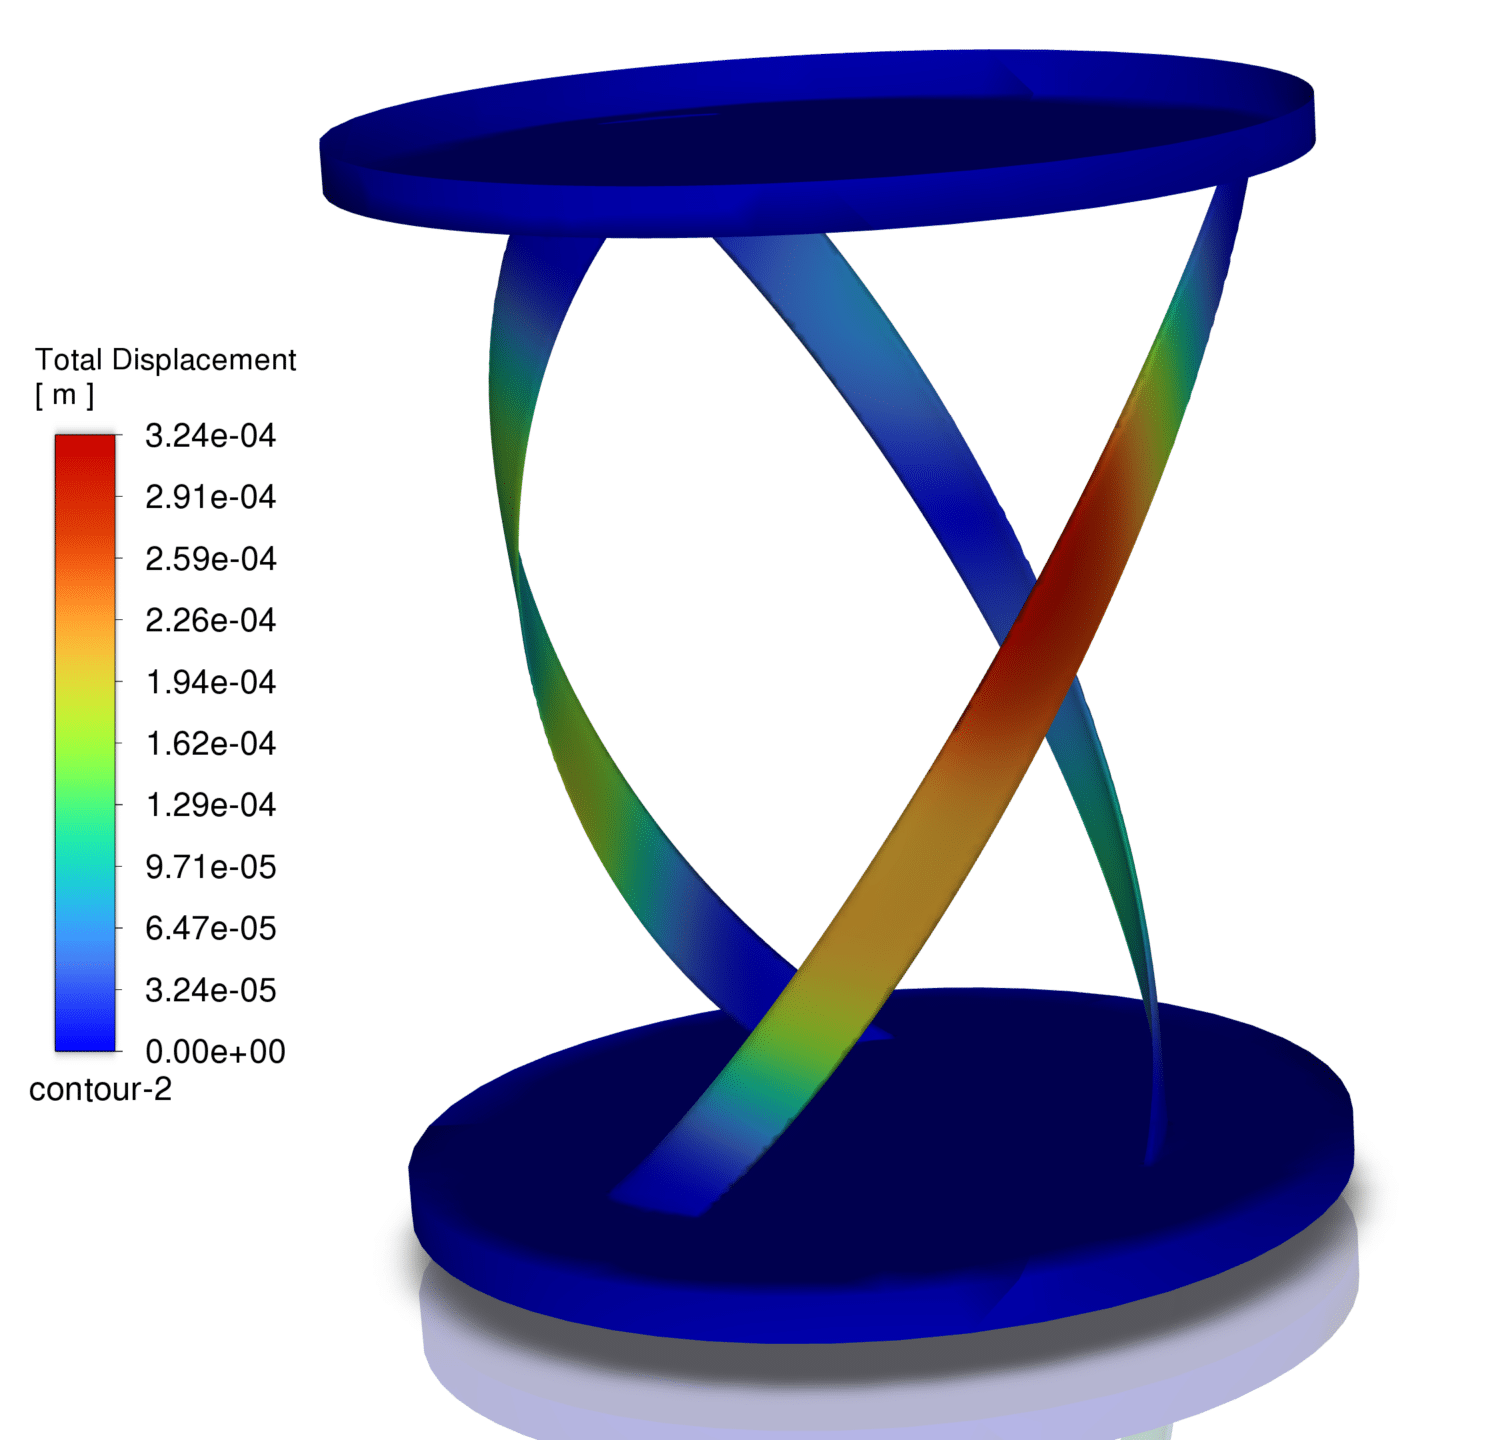
The total displacement contour plot shows the magnitude and distribution of the total displacement experienced by the vertical turbine blades. The color scale indicates the range of displacement values, with red representing the highest displacements and blue representing the lowest displacements.
- The contour plot reveals that the maximum displacement occurs at the tips of the turbine blades.
- The maximum displacement is approximately 3.24e-04 m, as shown in the color scale.
- The displacement contour plot shows a gradual decrease in displacement from the blade tips toward the blade roots.
Comparing the displacement results with the fluid flow results (e.g., pressure and velocity contours) can provide insights into the coupled fluid-structure interaction and its impact on blade deformation.


Reviews
There are no reviews yet.