Lockheed C-5 Galaxy Aerodynamic CFD Simulation
$100.00 $50.00 Student Discount
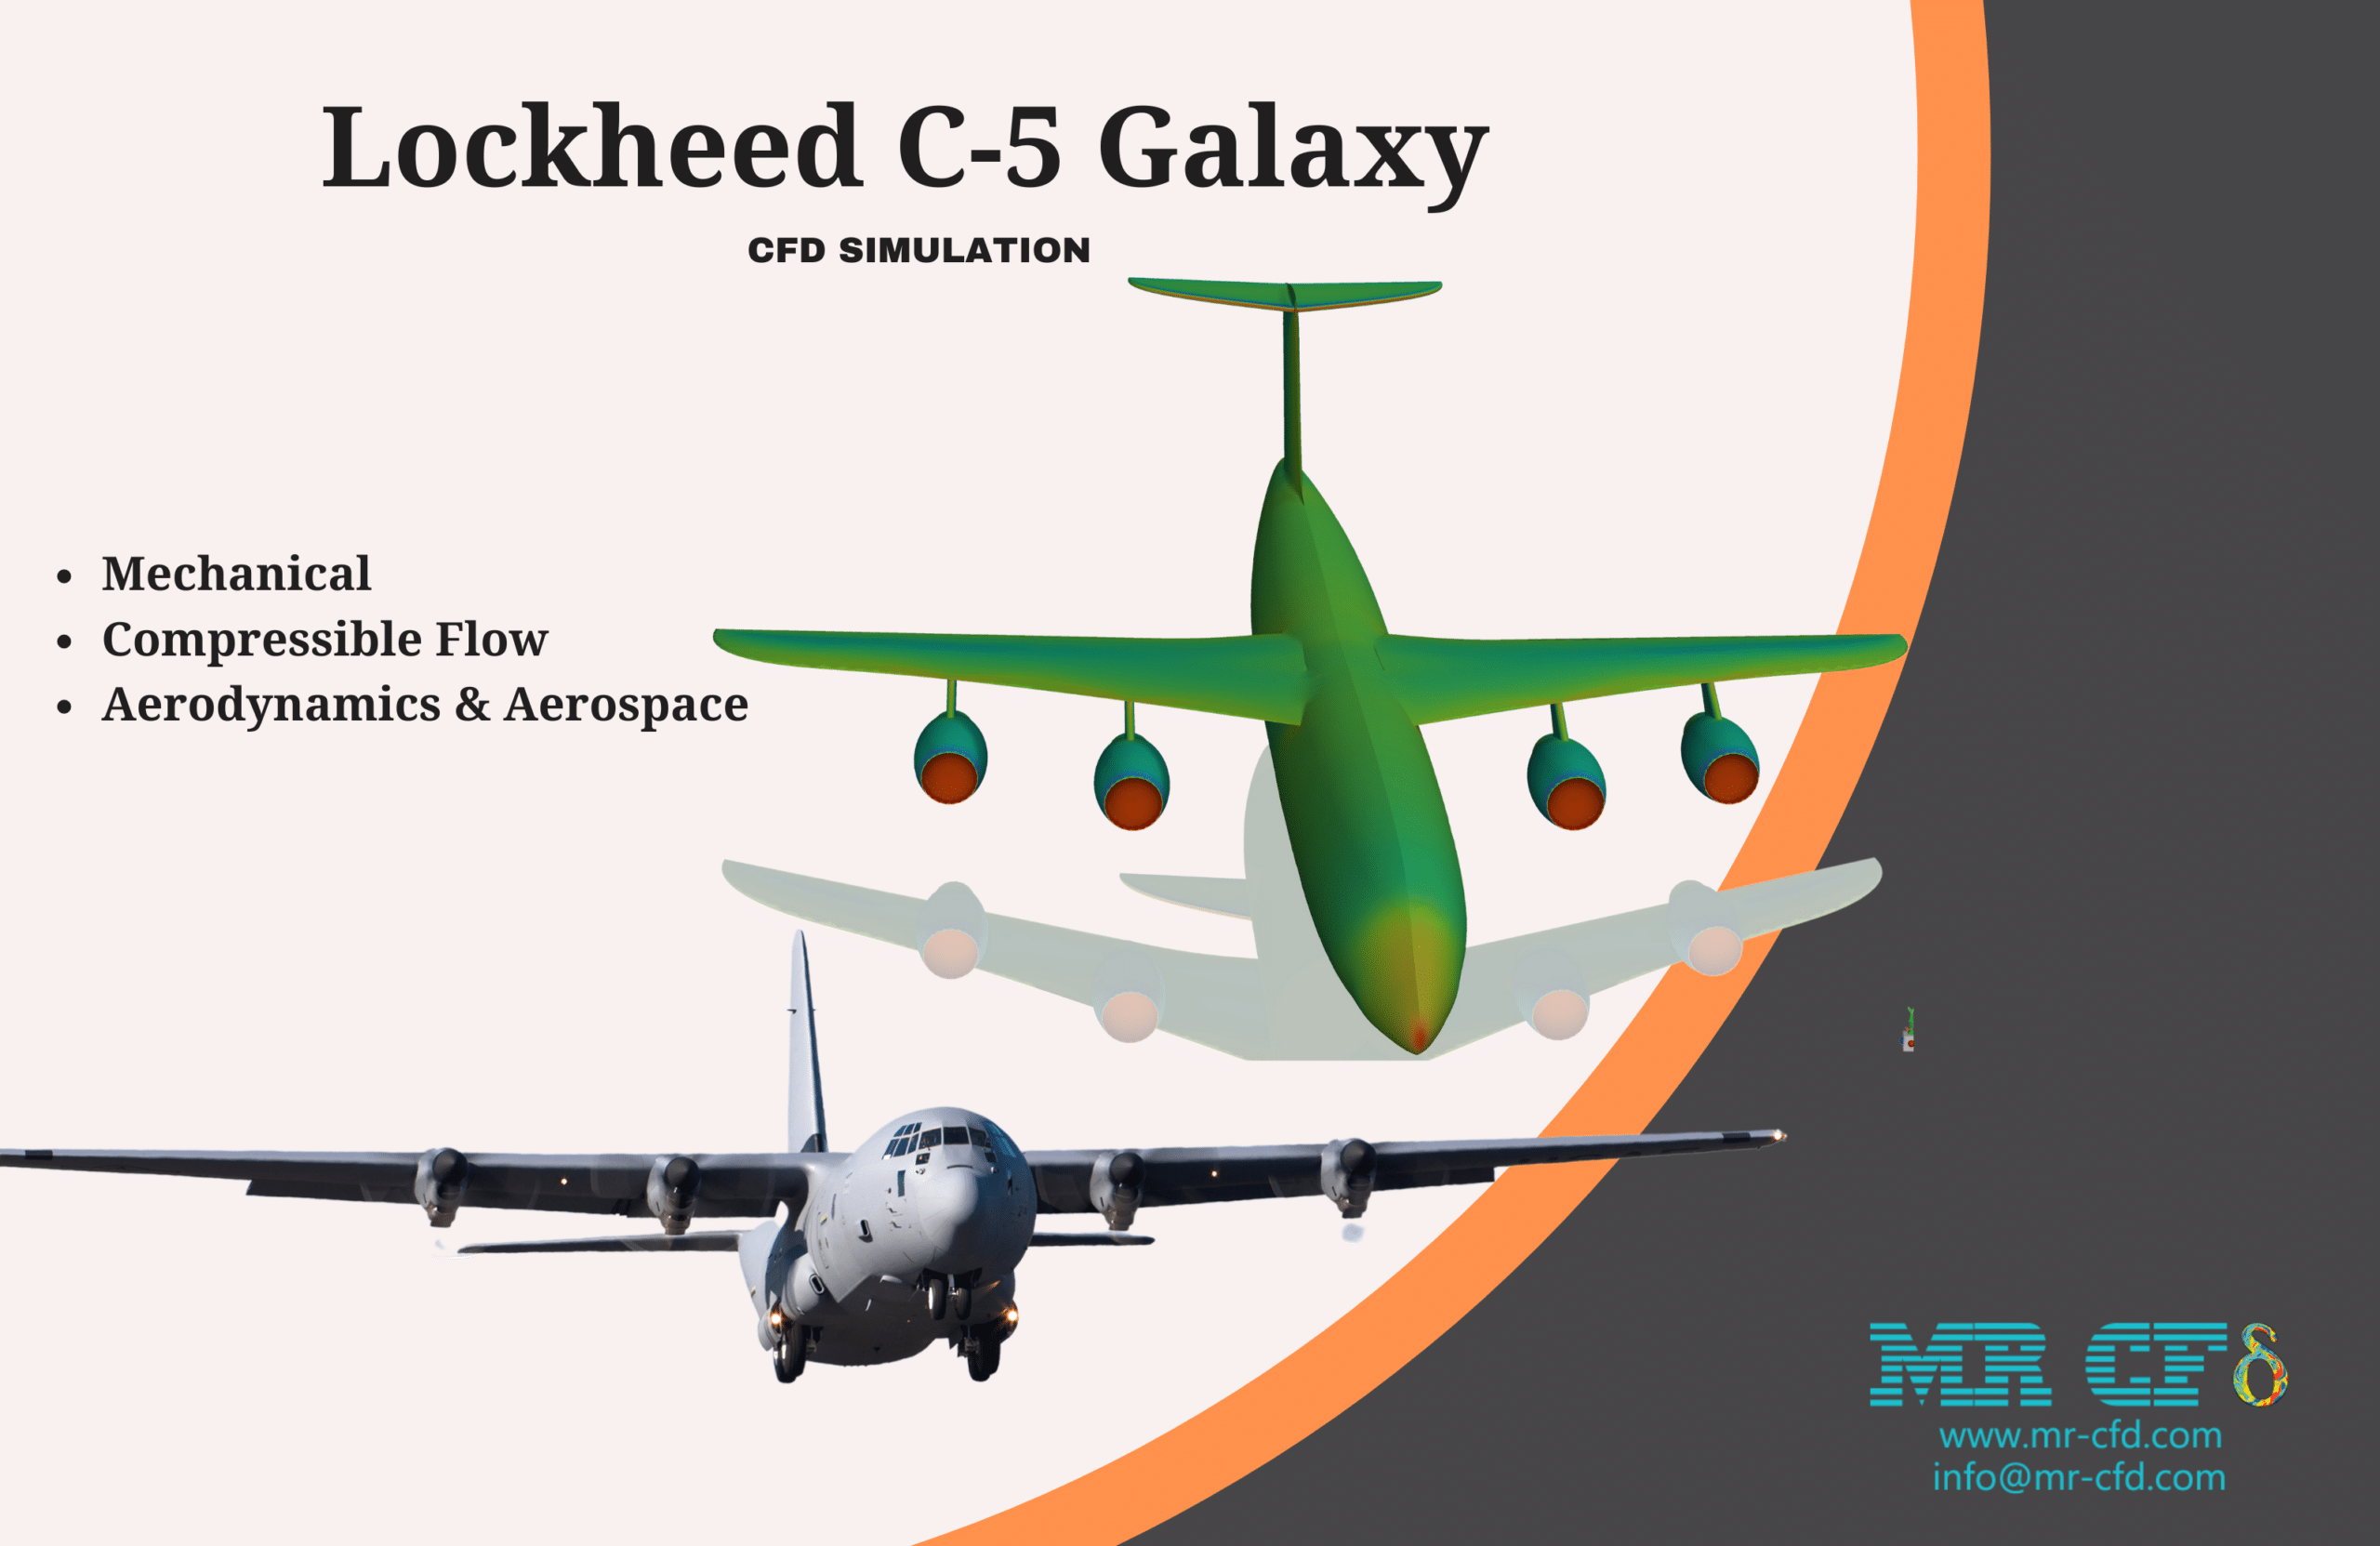
- This problem simulates a Lockheed C-5 Galaxy using ANSYS Fluent software.
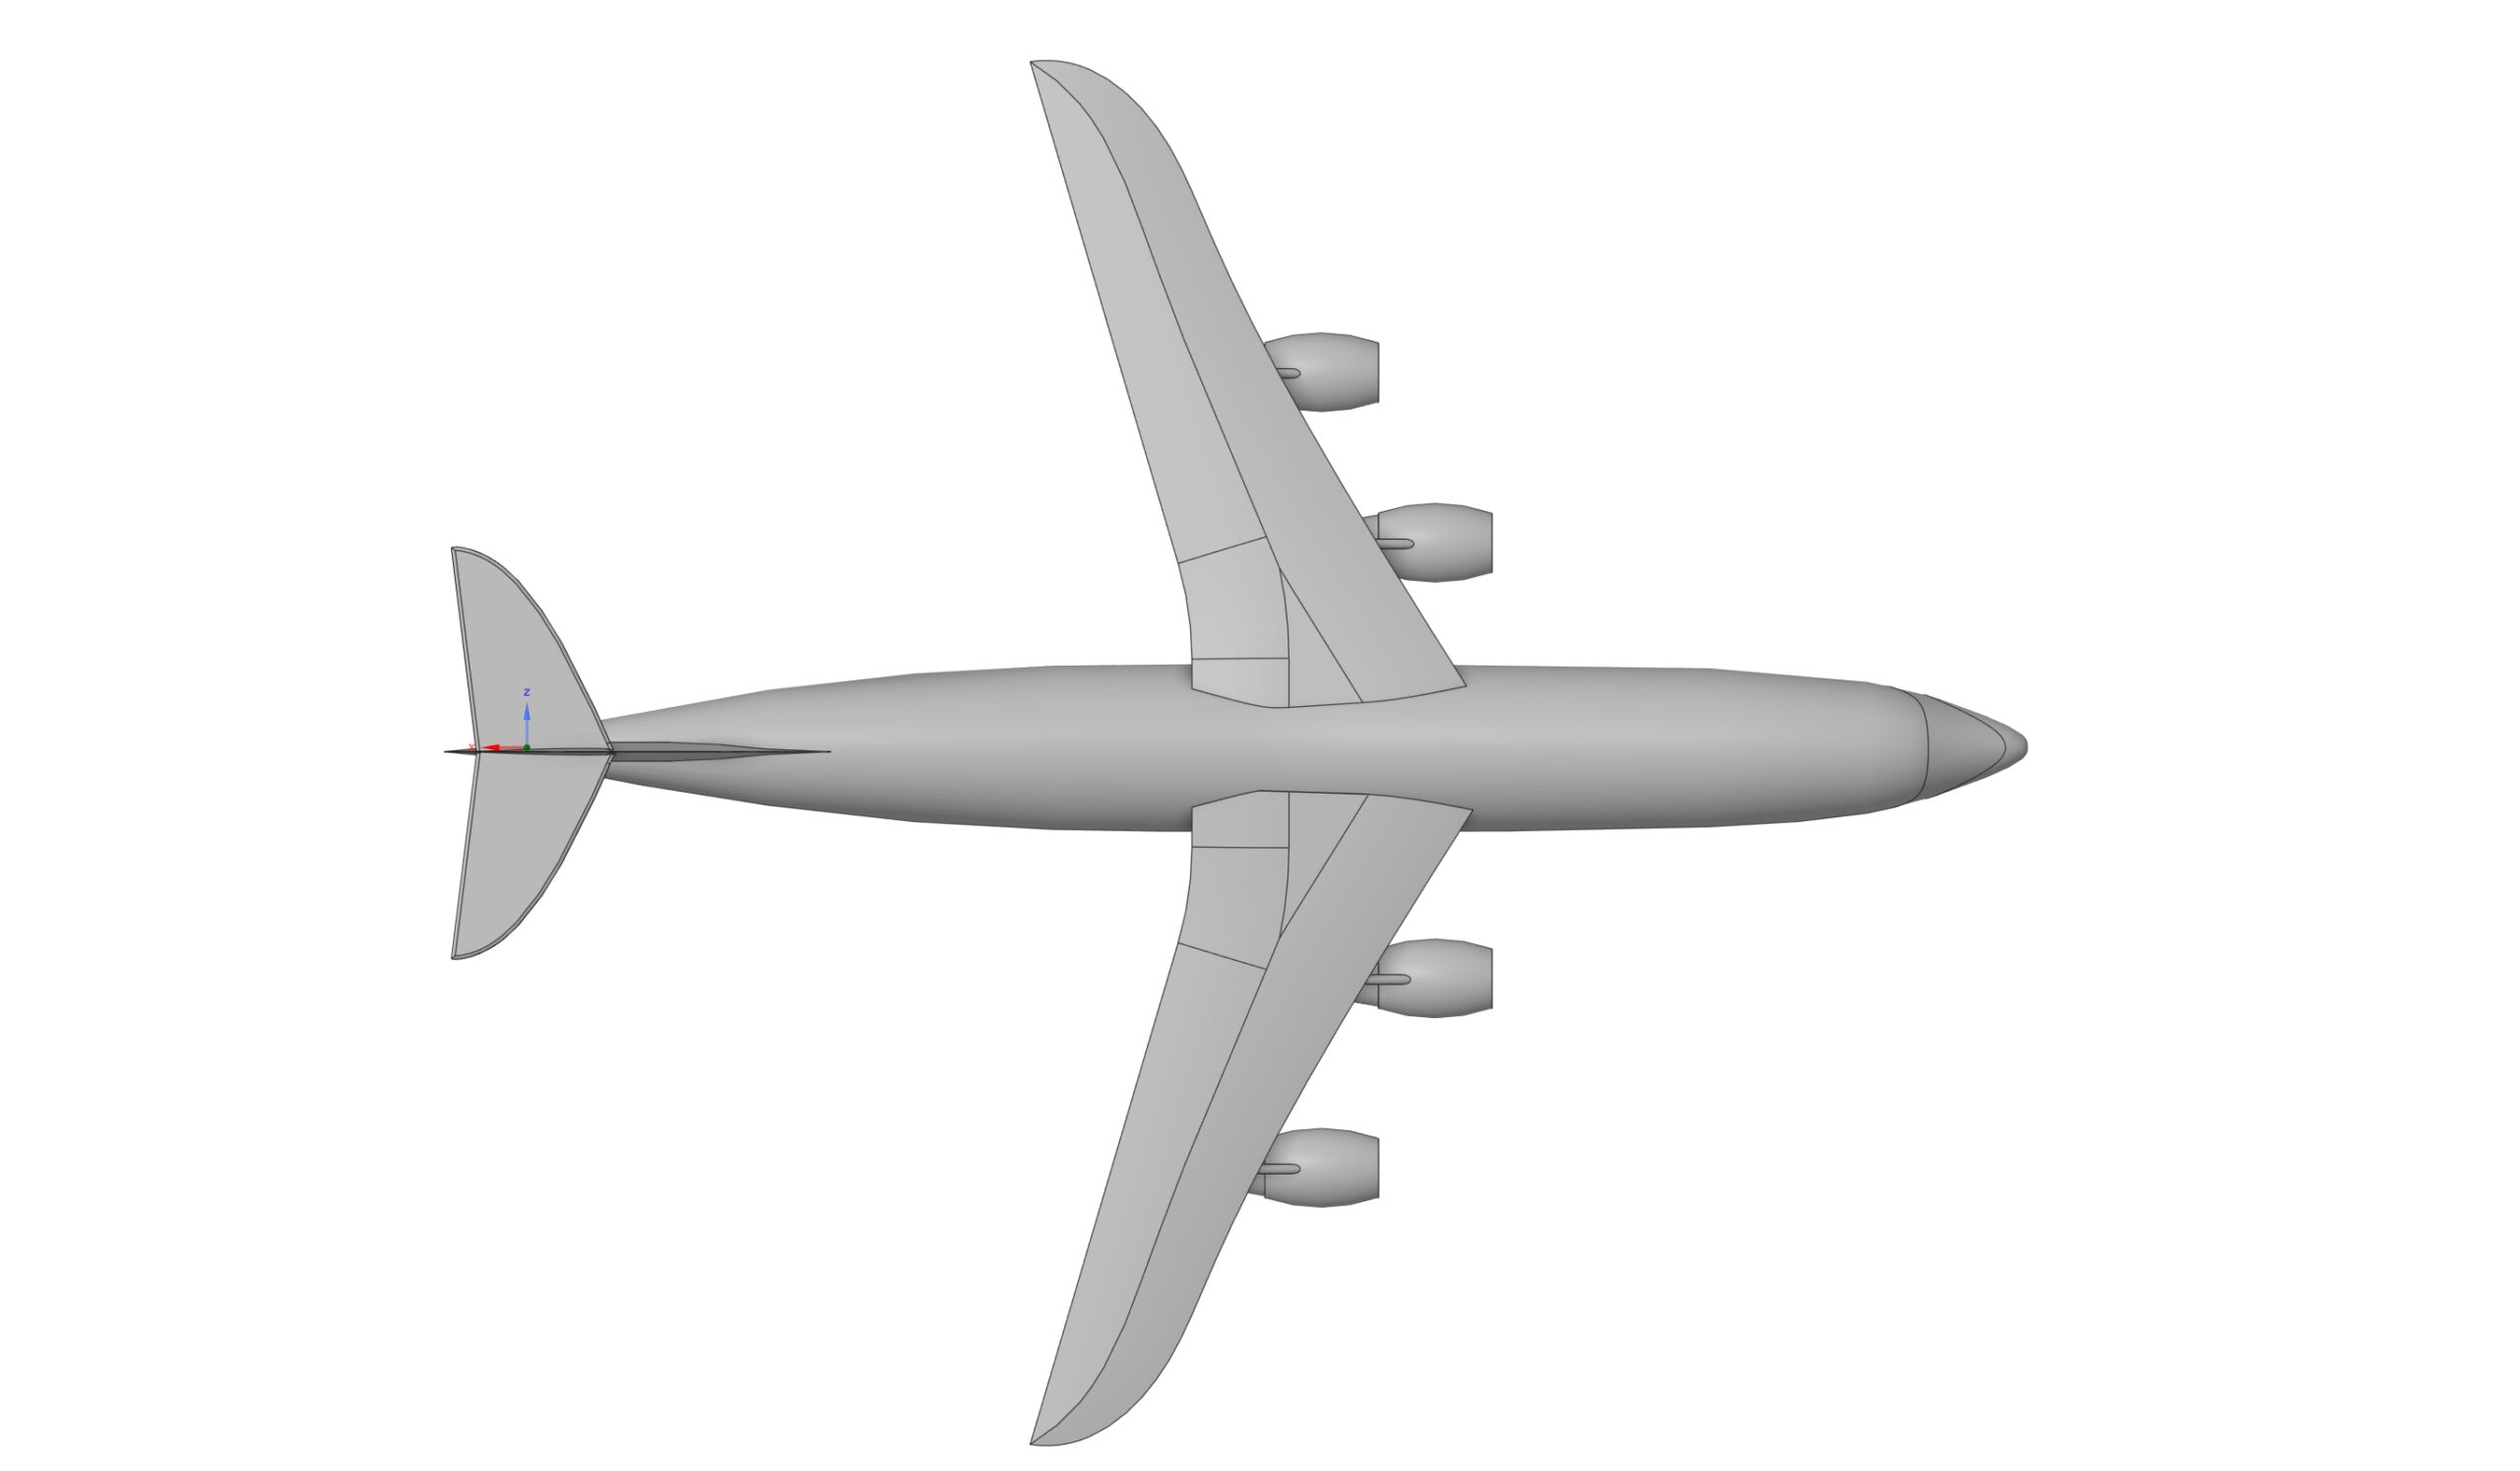
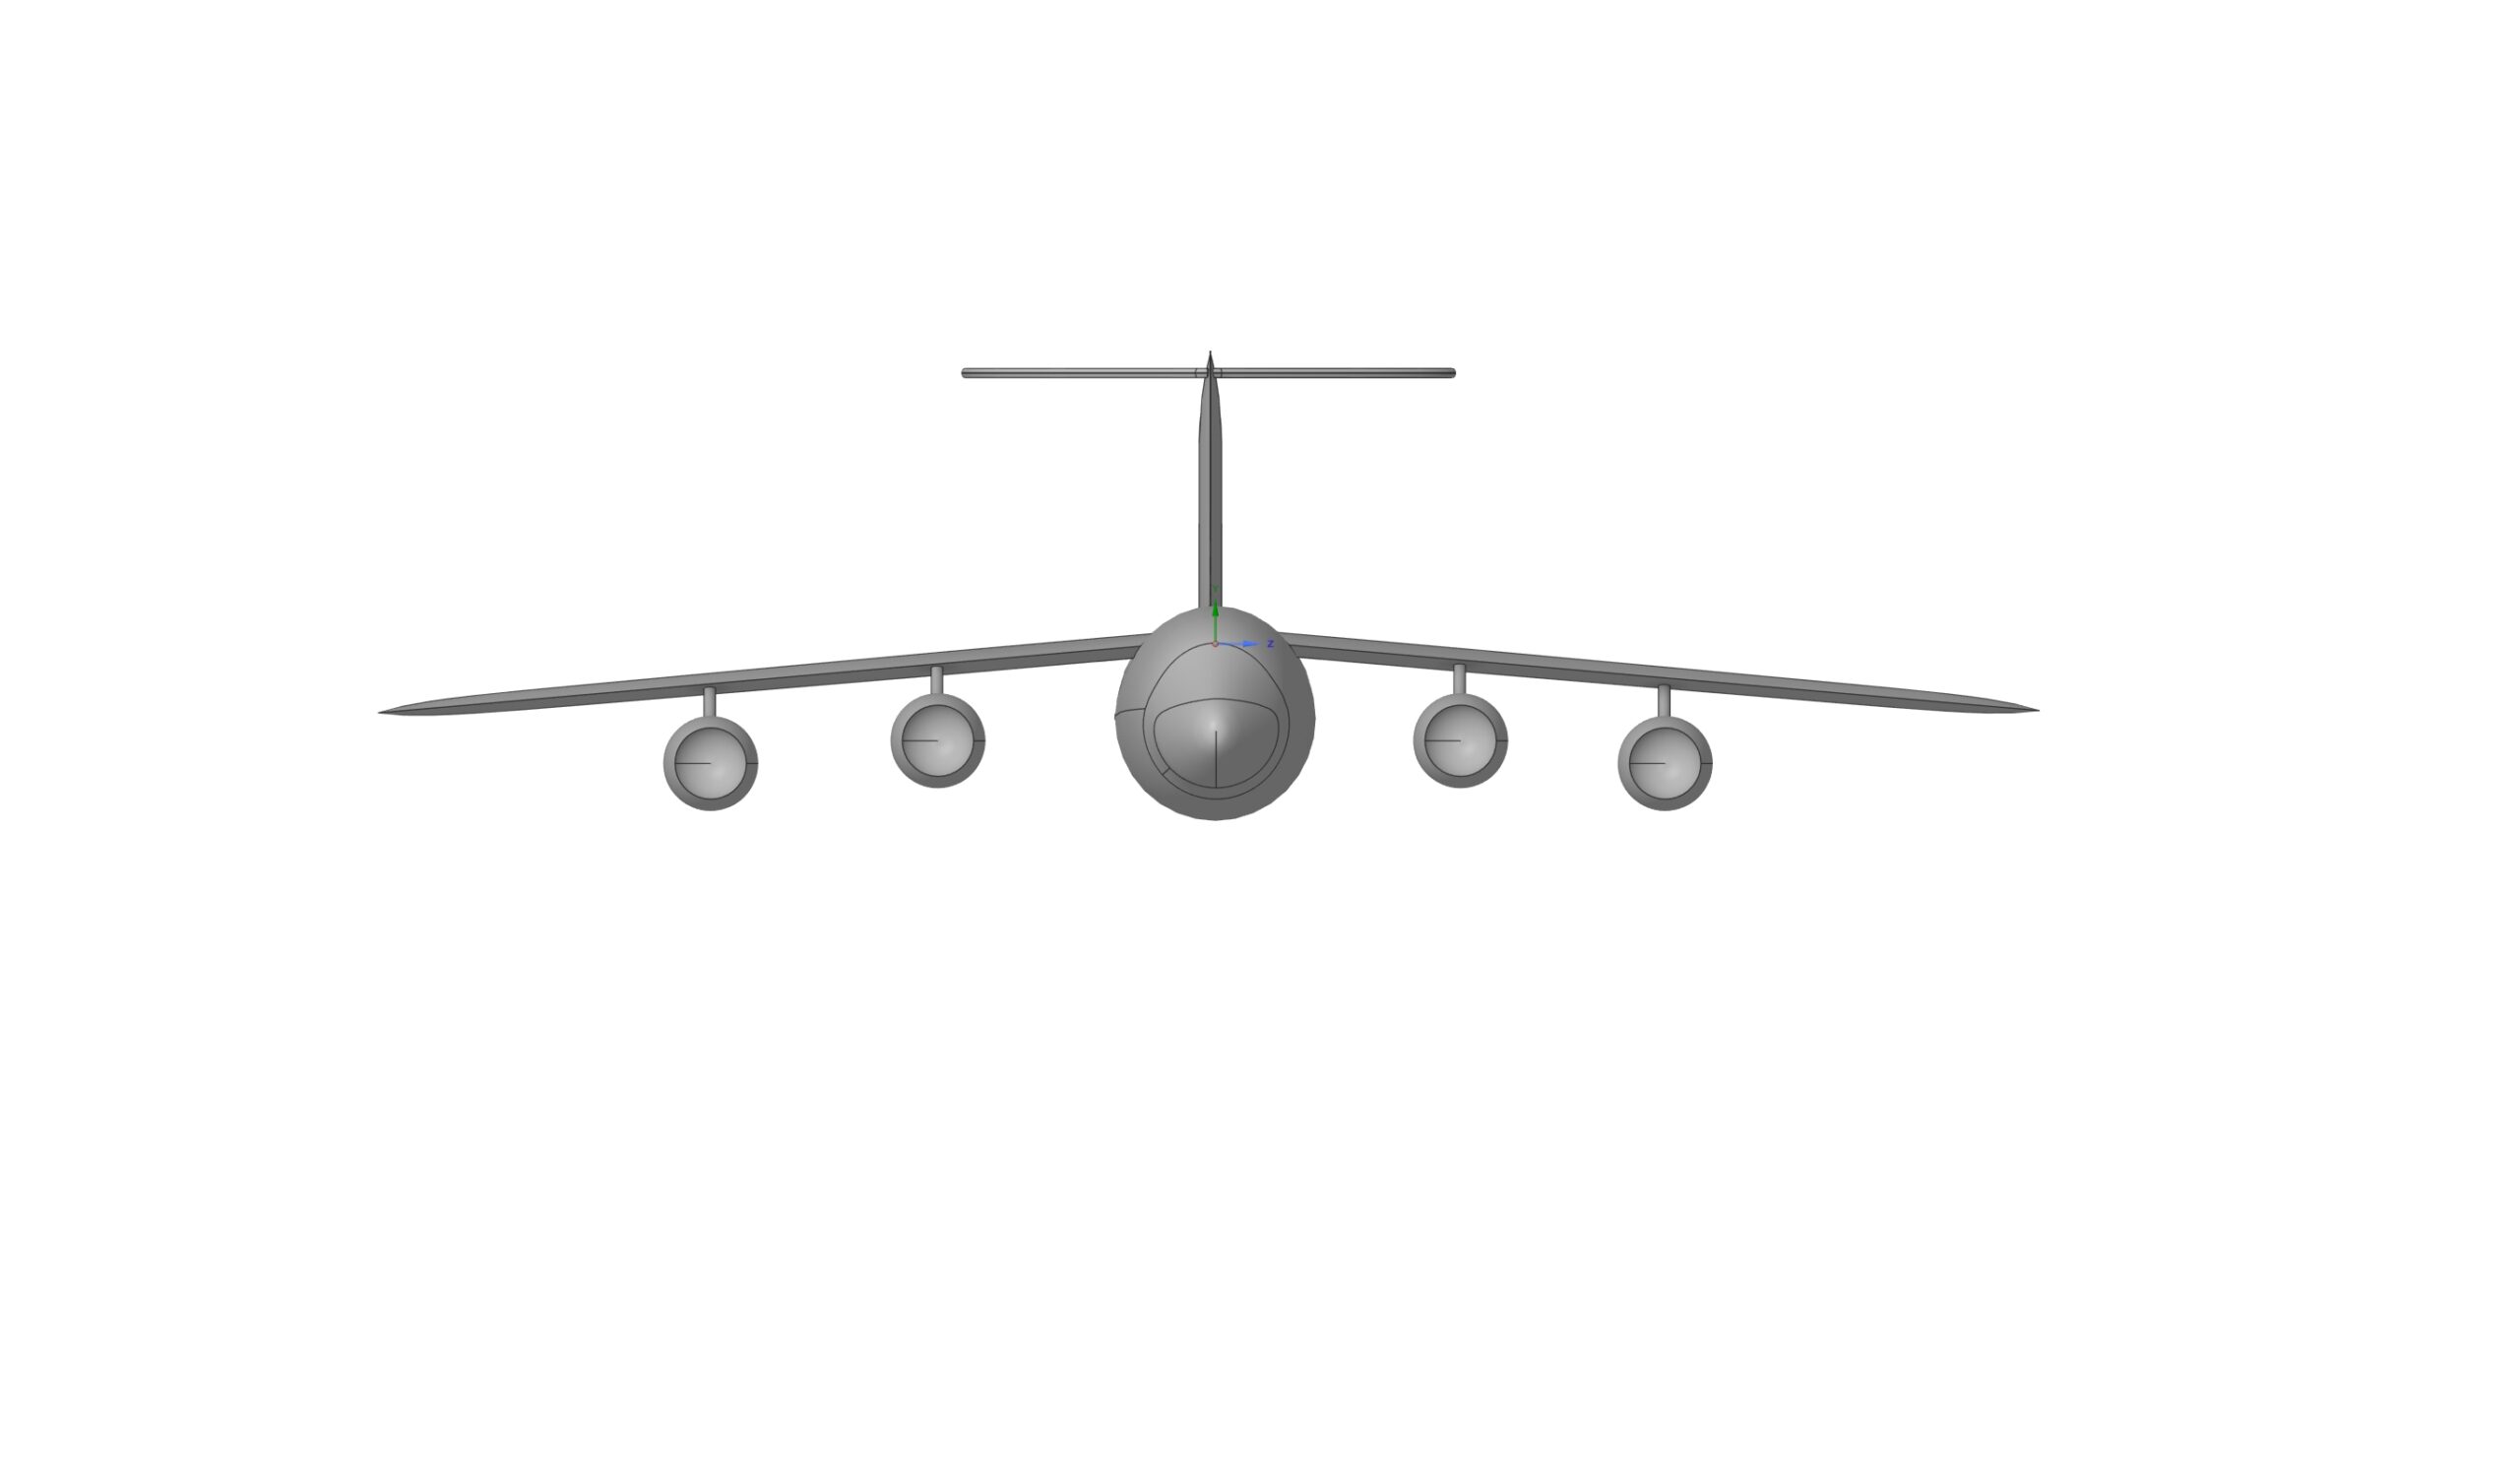
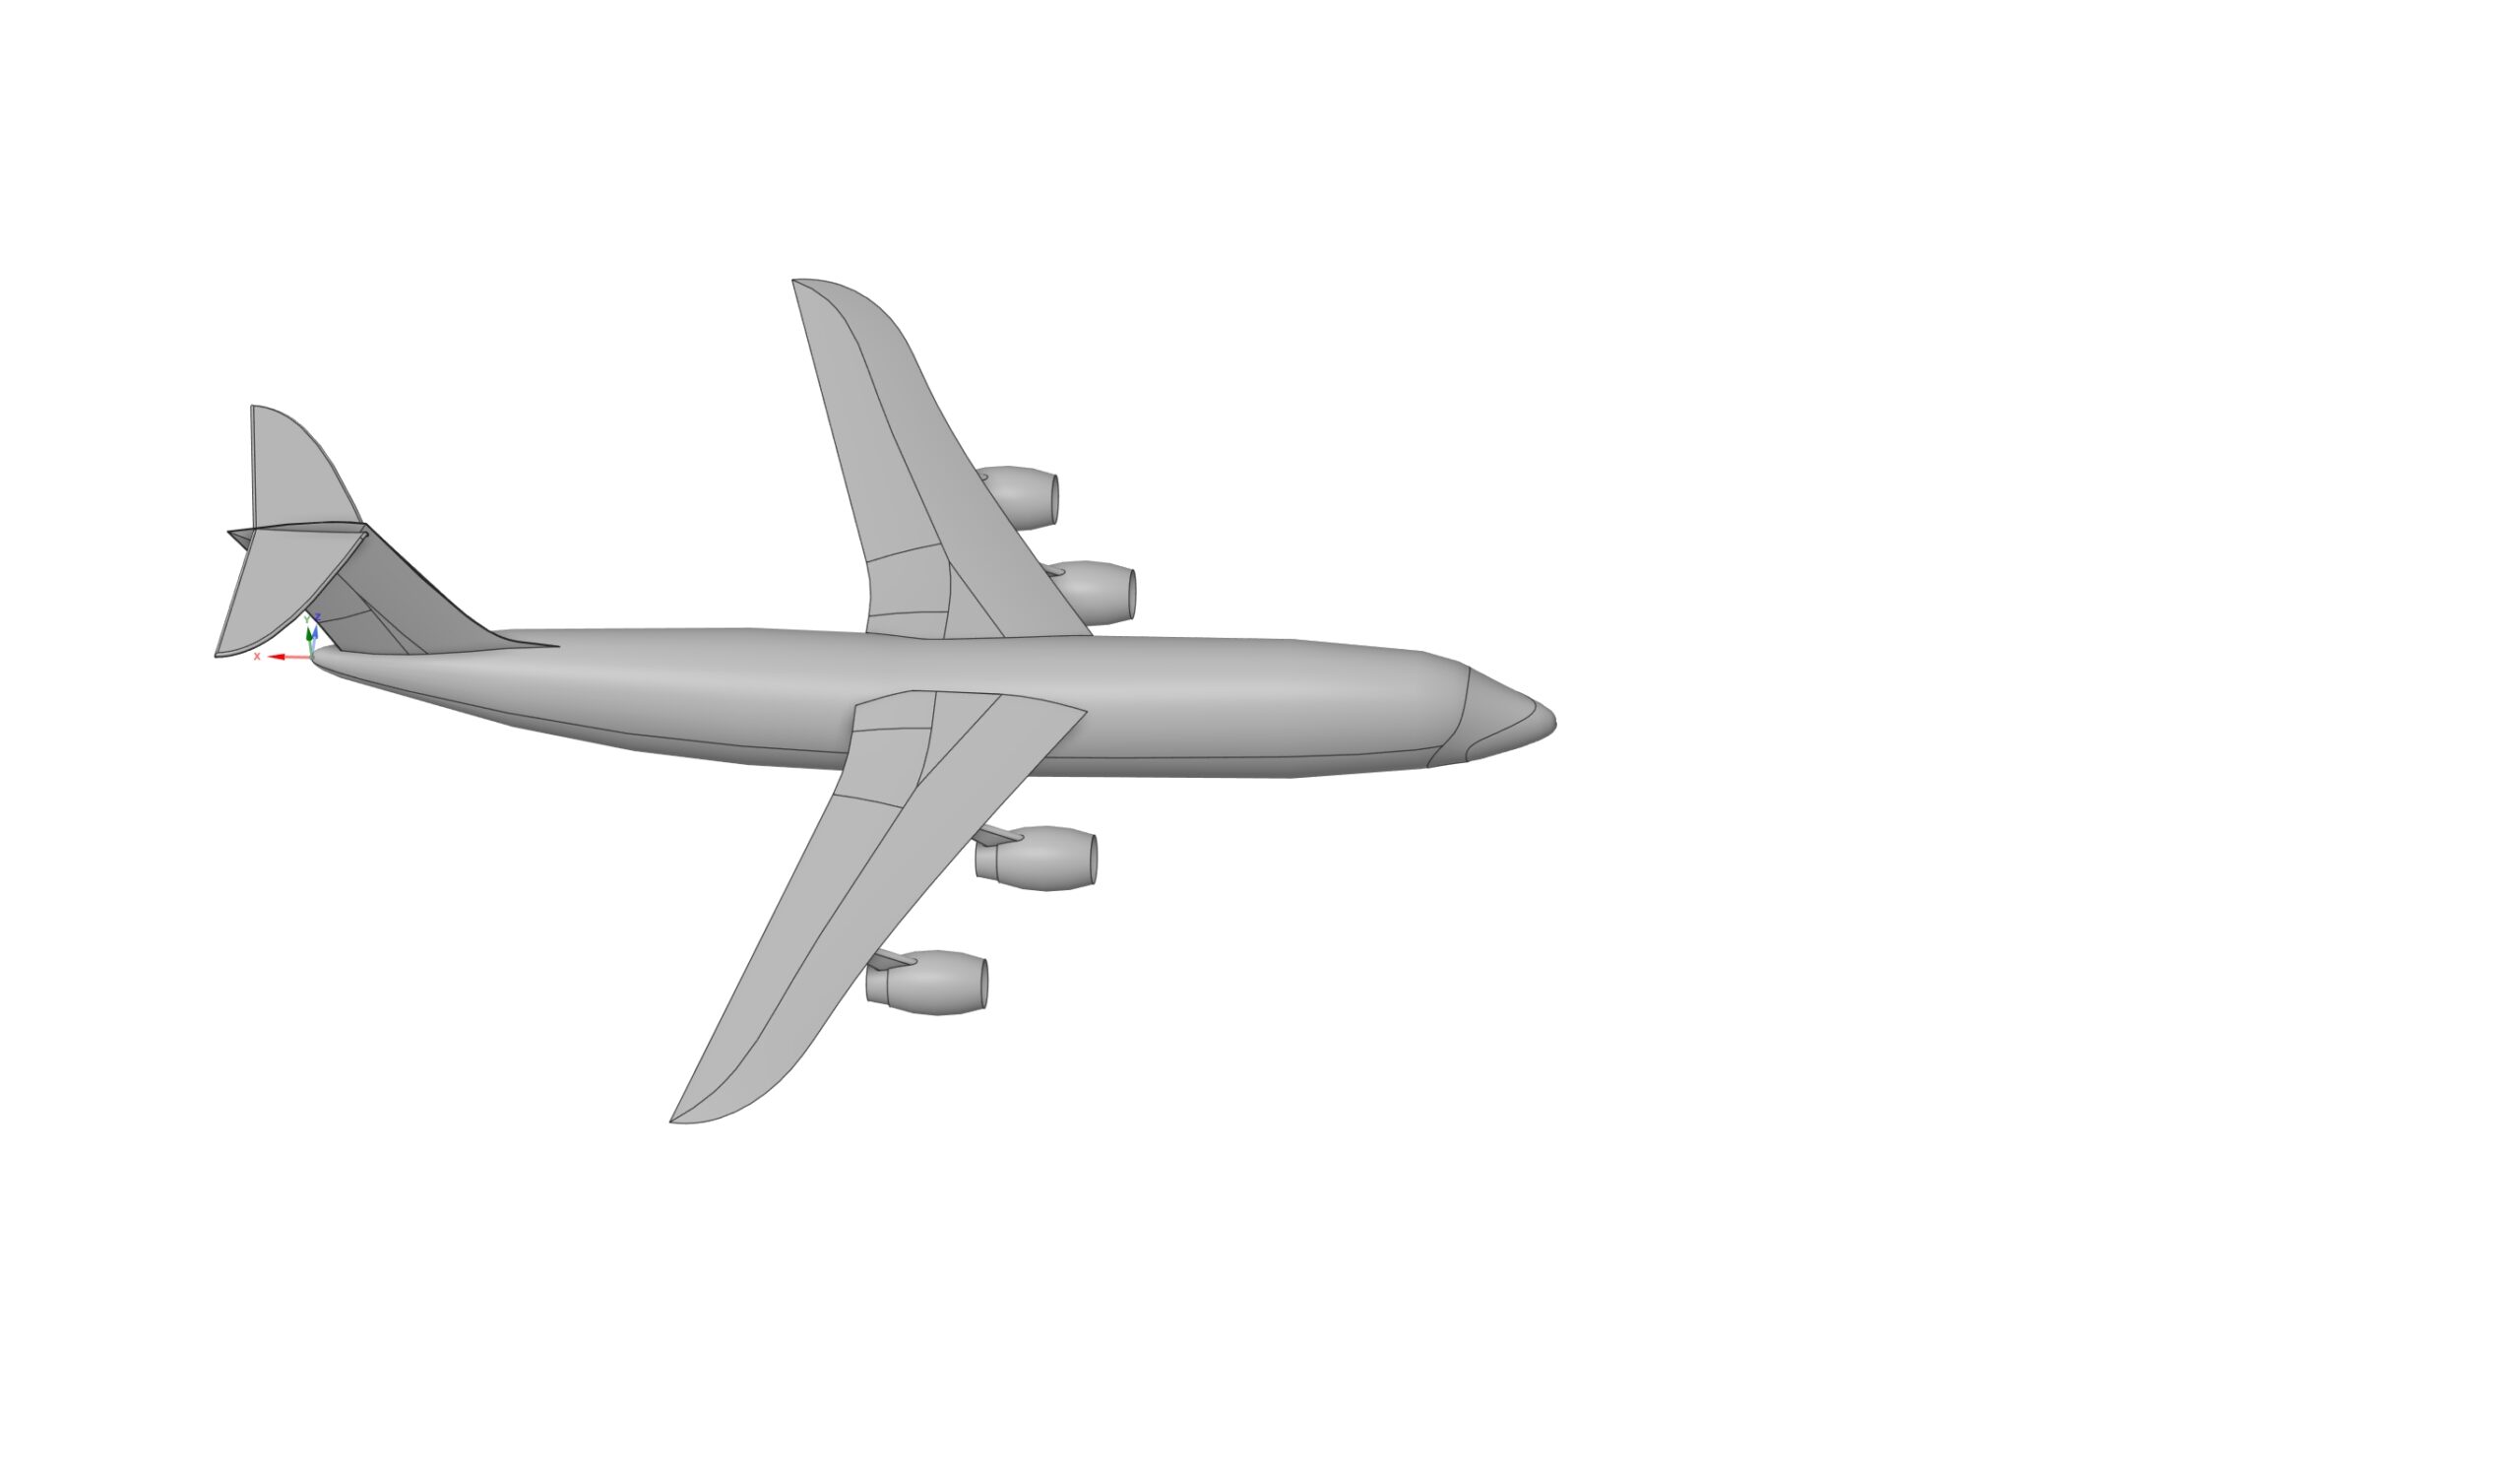
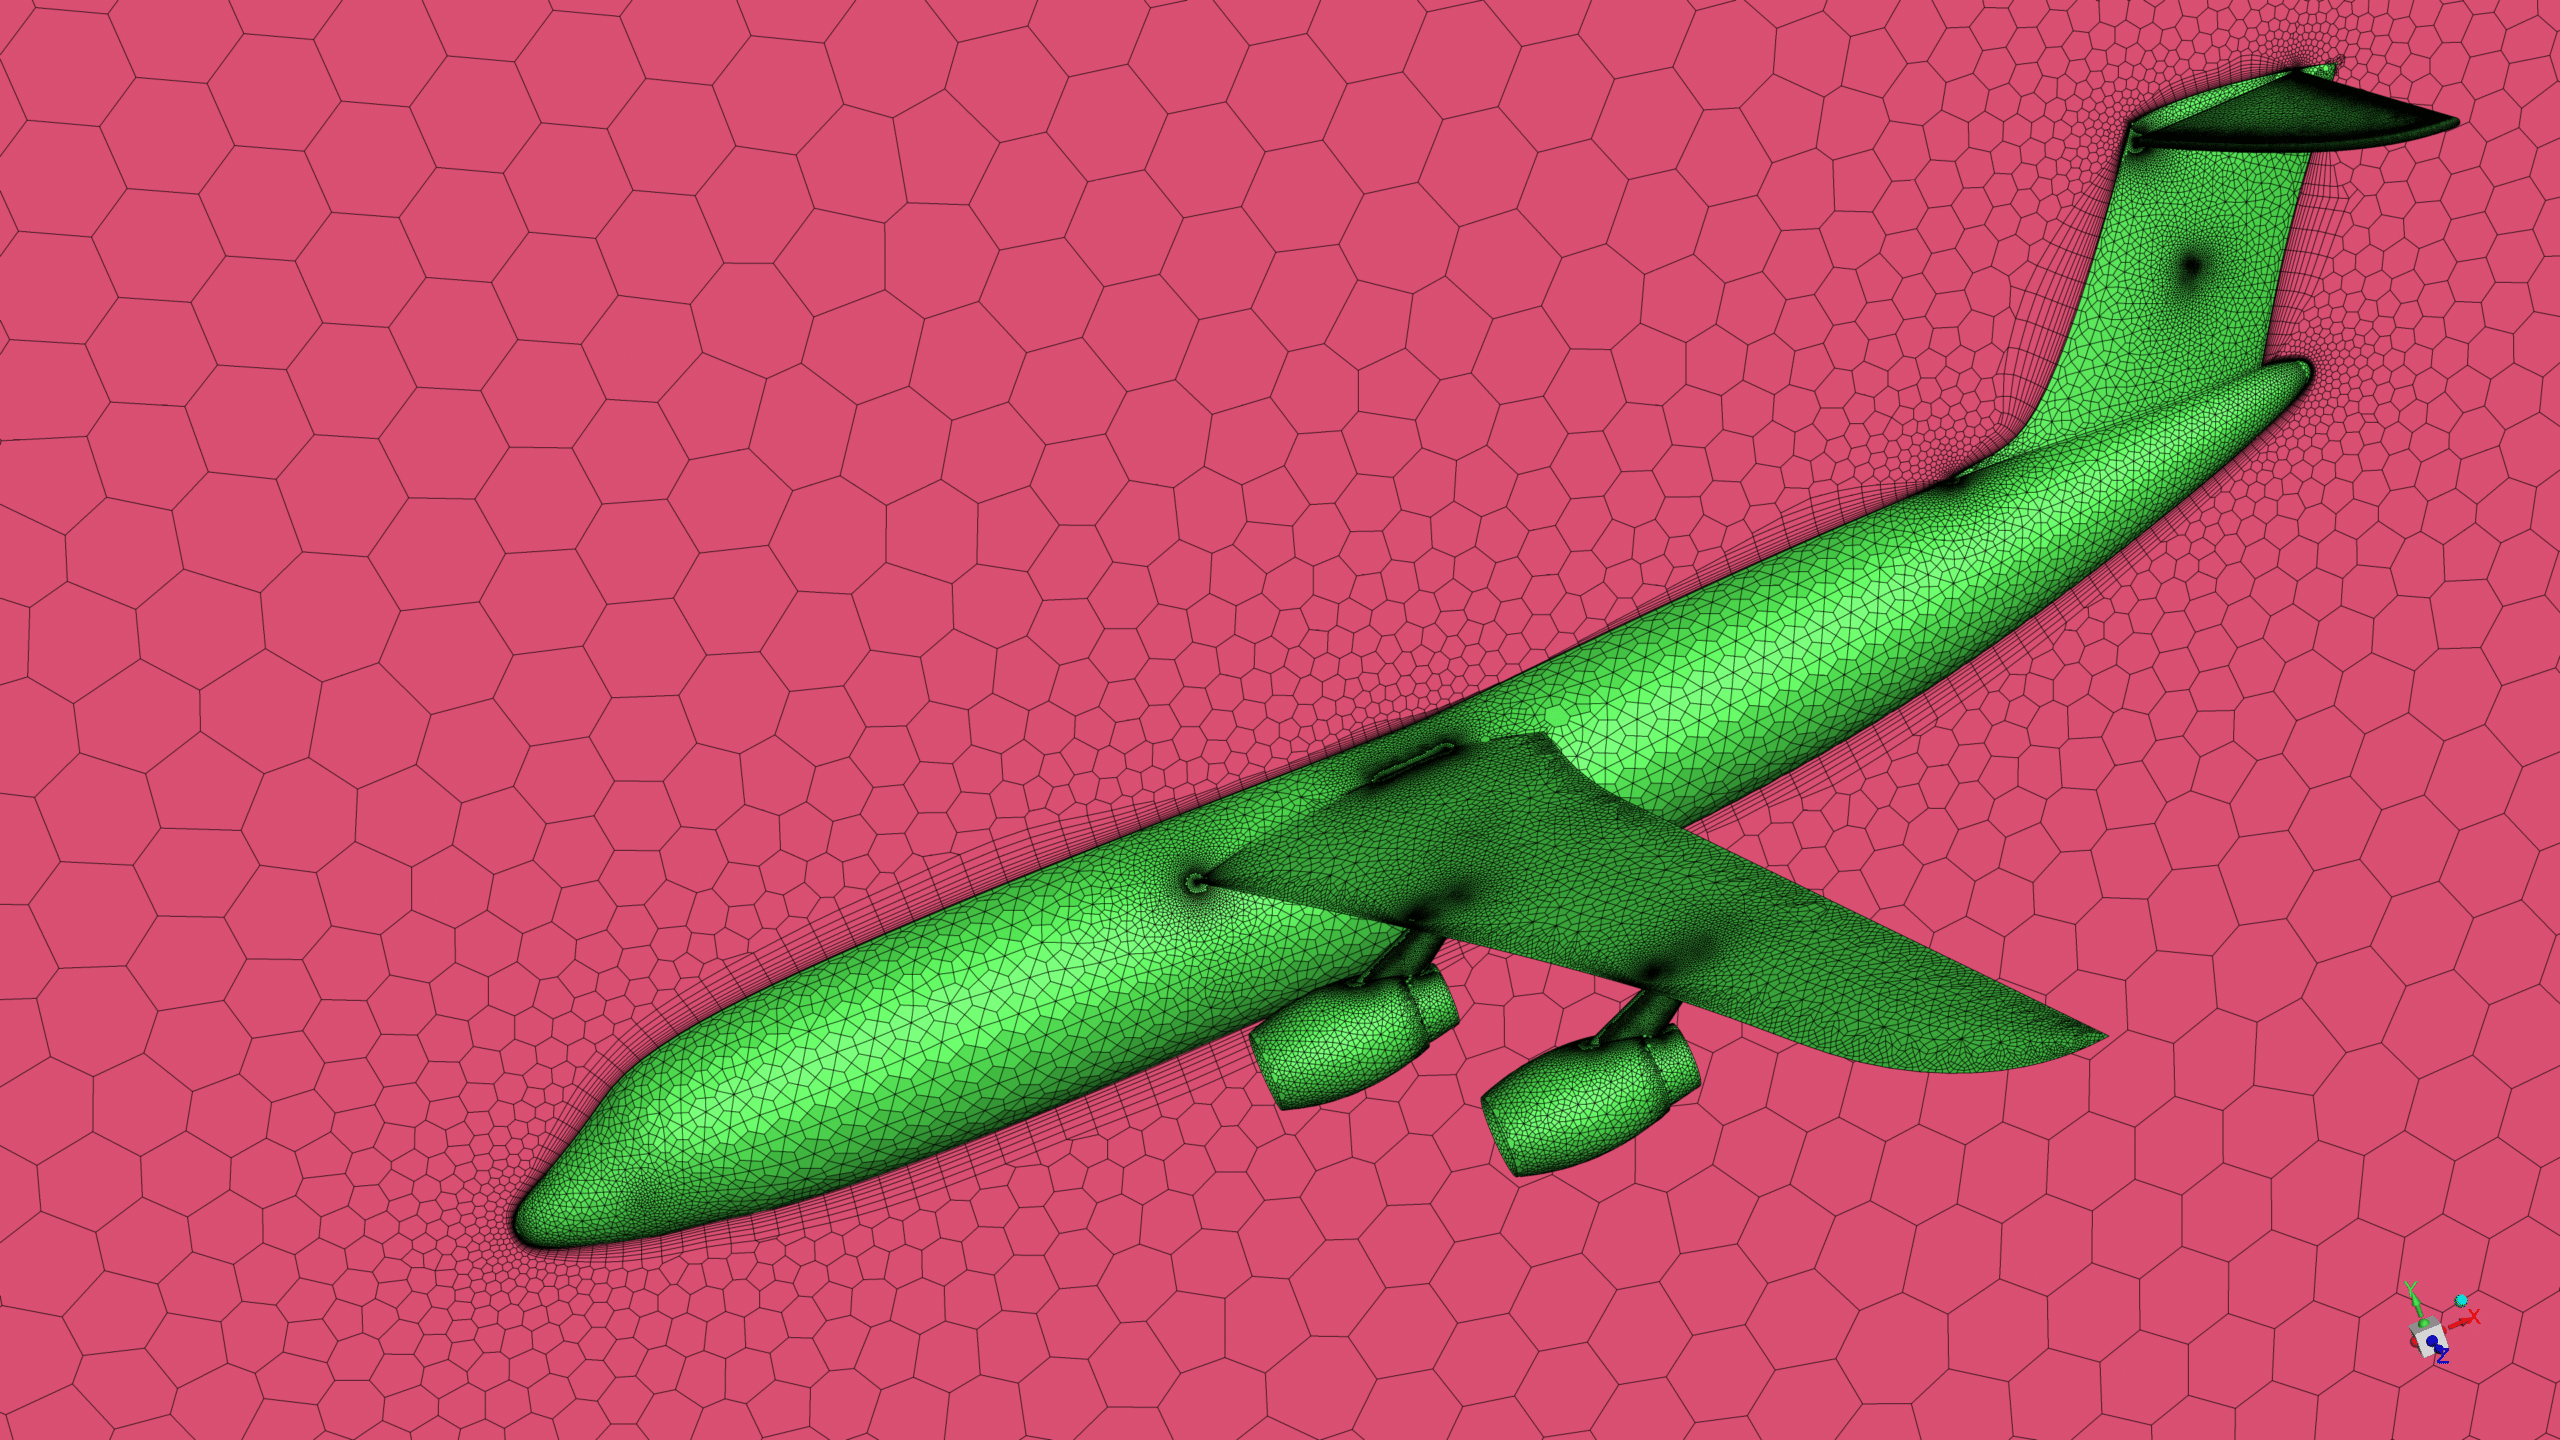
- The geometry is designed in SpaceClaim, and the meshing is performed using fluent Meshing with approximately 14 million cells.
- The simulation is carried out using the pressure-based solver.
- The turbulence model is set to Realizable k-ε.
To Order Your Project or benefit from a CFD consultation, contact our experts via email (info@mr-cfd.com), online support tab, or WhatsApp at +44 7443 197273.
There are some Free Products to check our service quality.
If you want the training video in another language instead of English, ask it via info@mr-cfd.com after you buy the product.
Description
Description
The Lockheed C-5 Galaxy is a large military transport aircraft designed to provide strategic airlift for the United States Air Force.
The CFD simulation involves creating a detailed 3D model of the C5 aircraft, including its fuselage, wings, engines, and other critical components. This model is then divided into millions of small elements, forming a mesh that allows for accurate flow field calculations. Computational Fluid Dynamics (CFD) has emerged as a powerful tool for simulating the aerodynamic characteristics of Lockheed C-5 Galaxy.
This study presents a detailed CFD analysis of a Lockheed C-5 Galaxy using ANSYS Fluent software. The aircraft geometry was designed using SpaceClaim software and then meshed in Fluent Meshing with approximately 14 million cells.
Methodology
The simulation was performed using a pressure-based steady-state solver, with air modeled as an ideal gas.
The realizable k-ε model was employed to capture the turbulence effects.
Wall boundary conditions were applied to the rocket surface, while pressure far-field conditions were used for the other boundaries. The case was solved using the coupled algorithm at a Mach number of 0.75.
Results
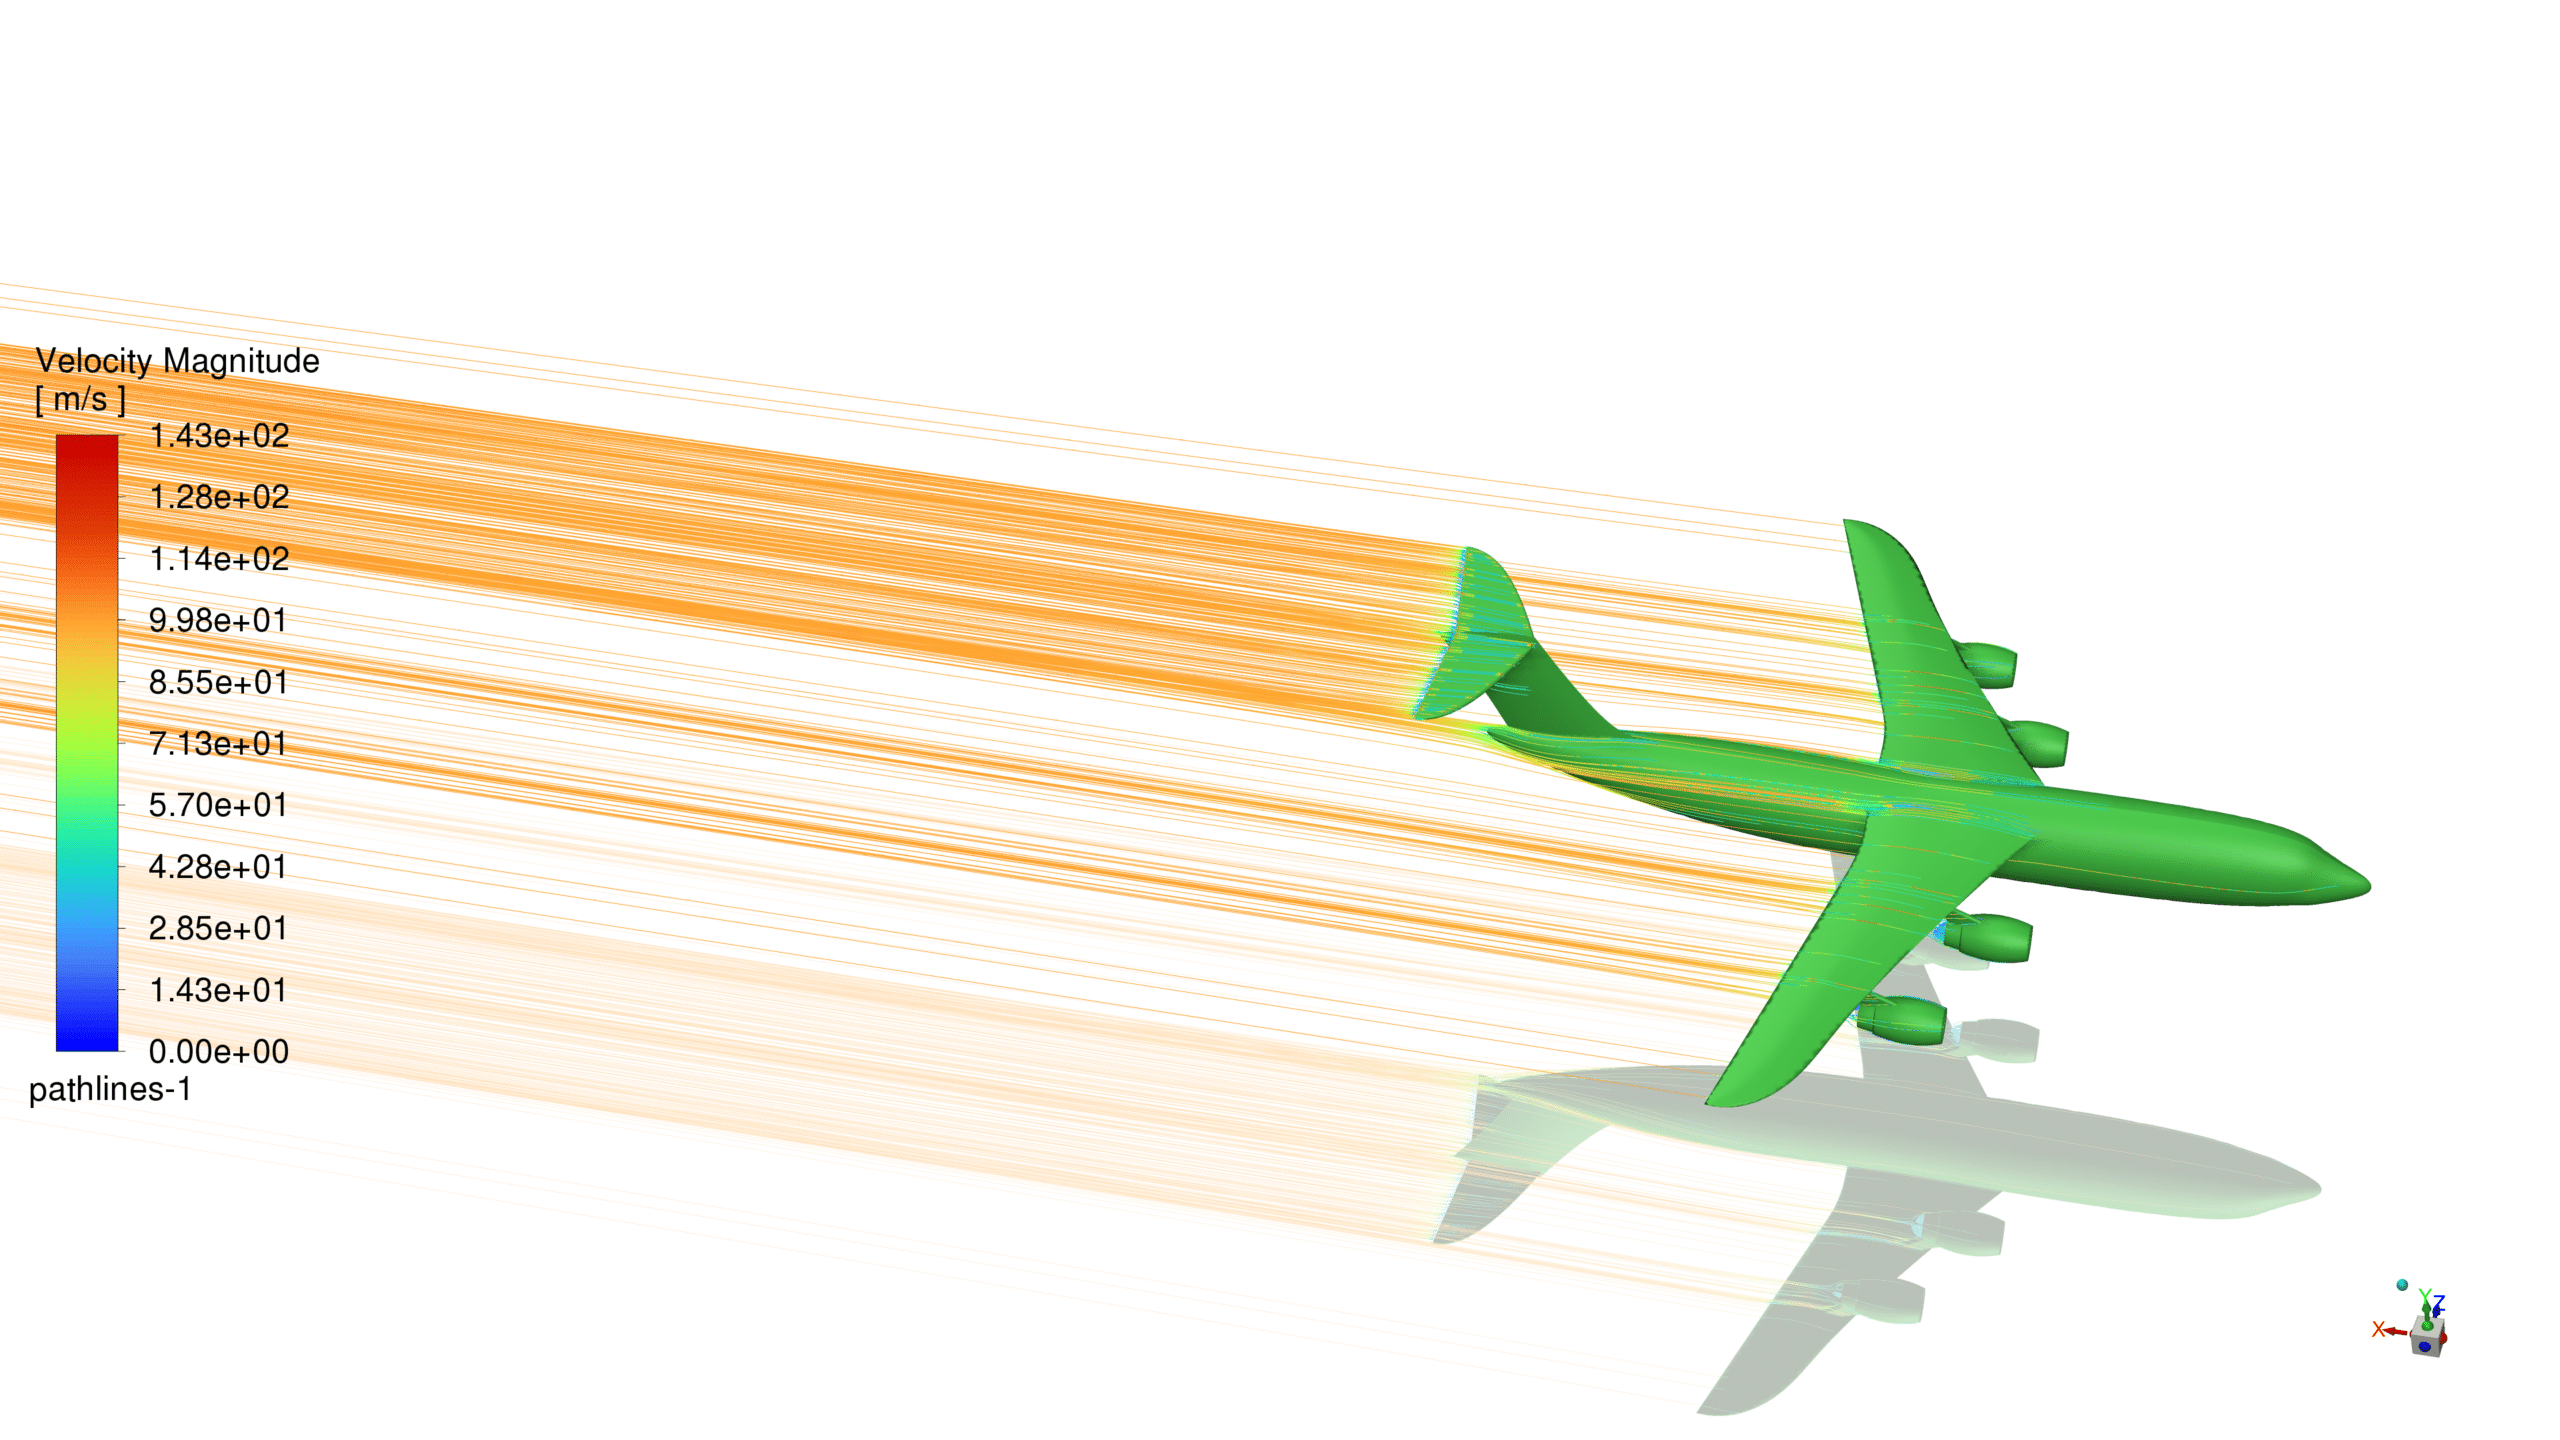
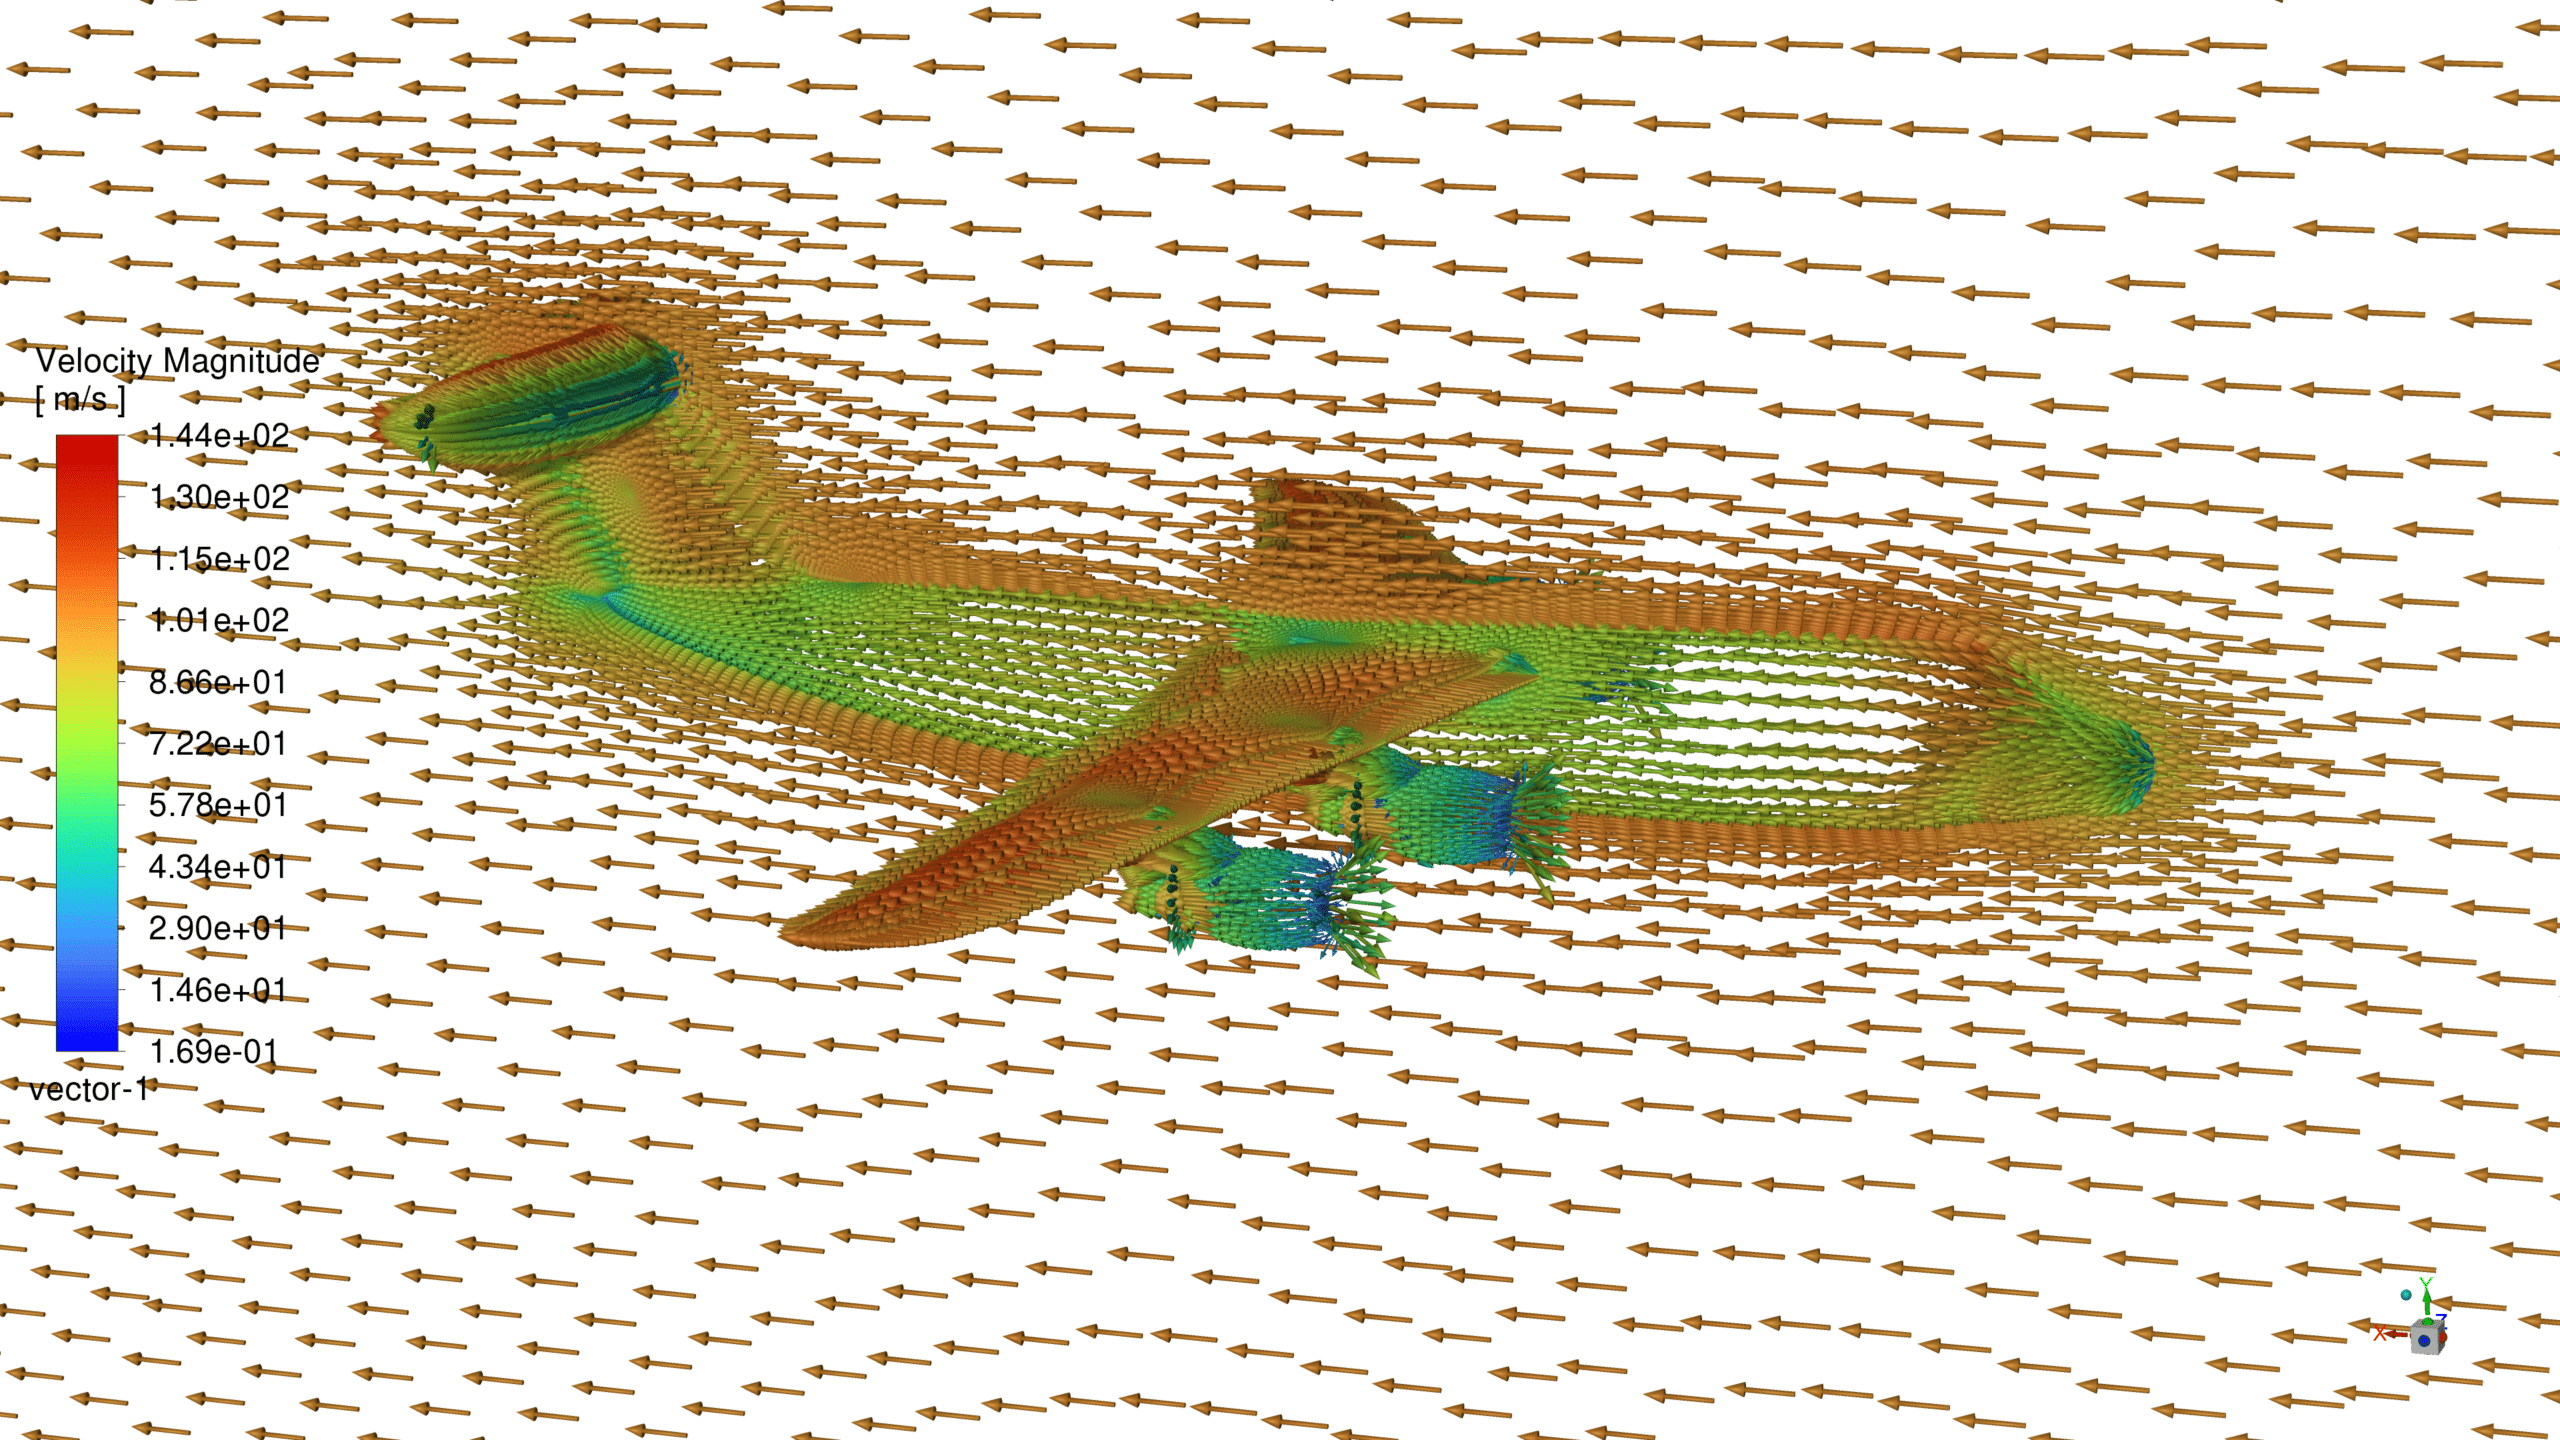
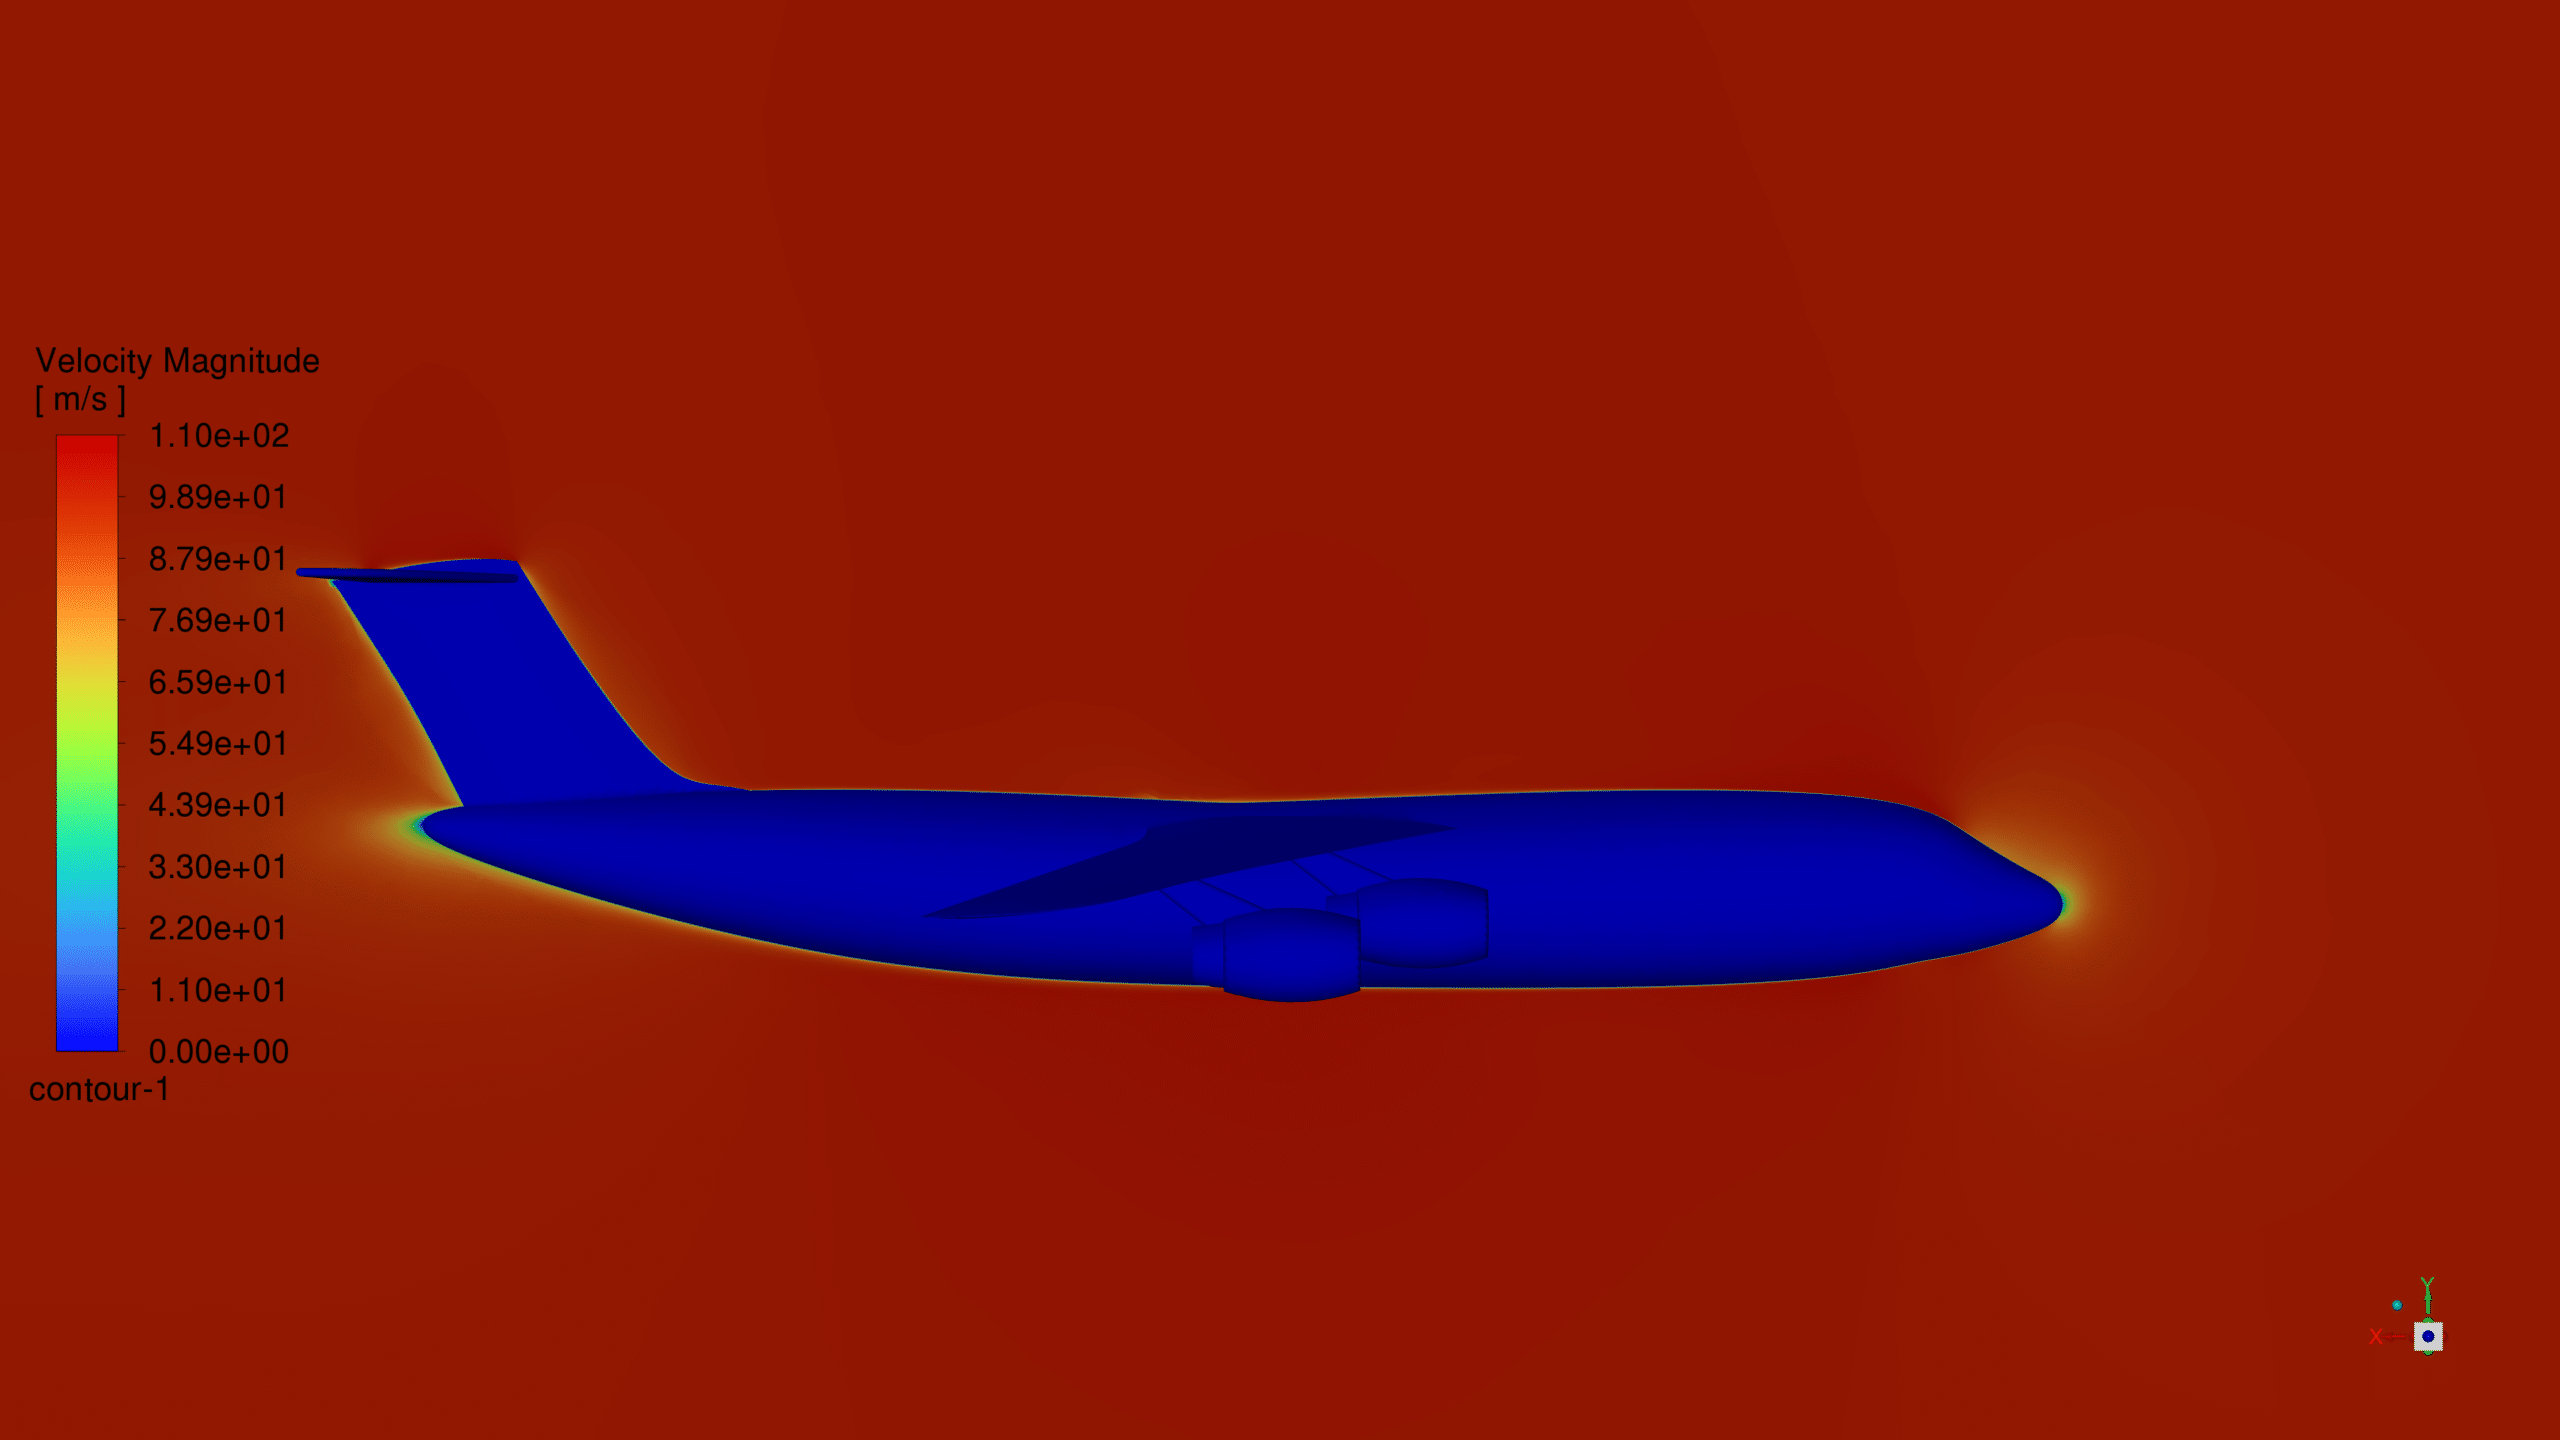
The velocity magnitude contour plot reveals the variation in velocity around the aircraft body. The velocity gradually decreases along the body, with the lowest velocity in behind the aircraft. The high-velocity region extends further downstream.
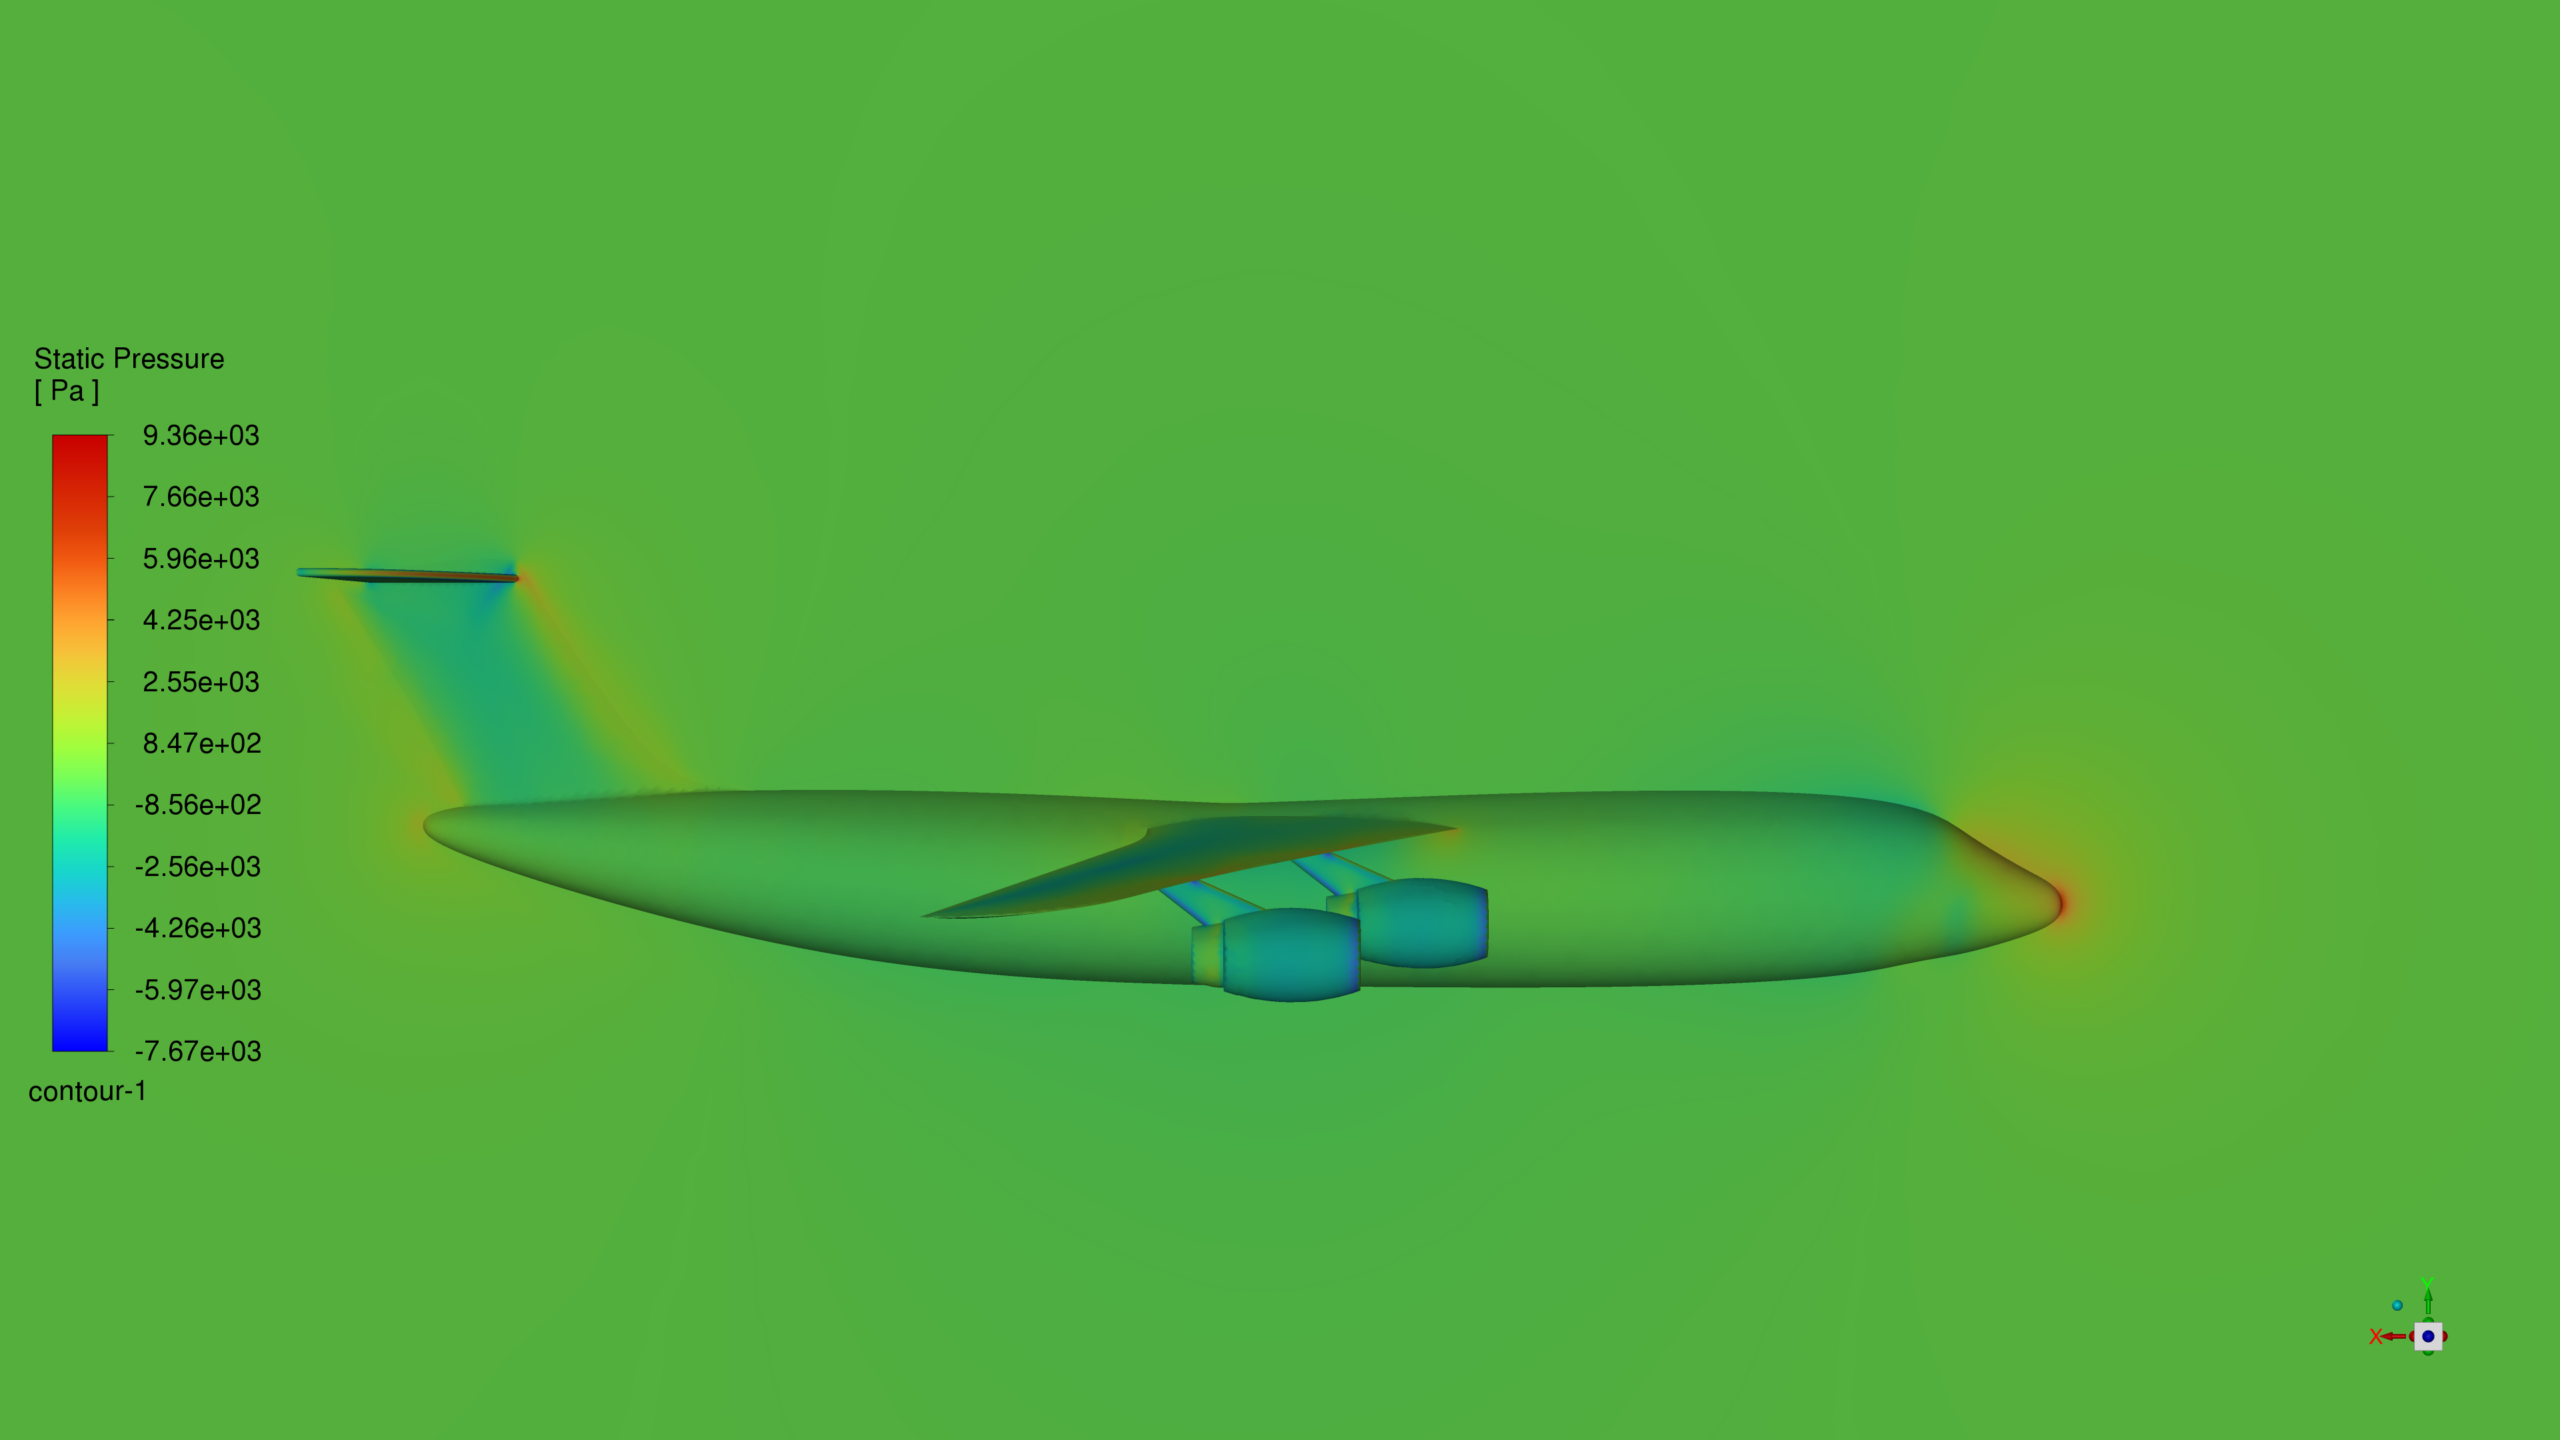
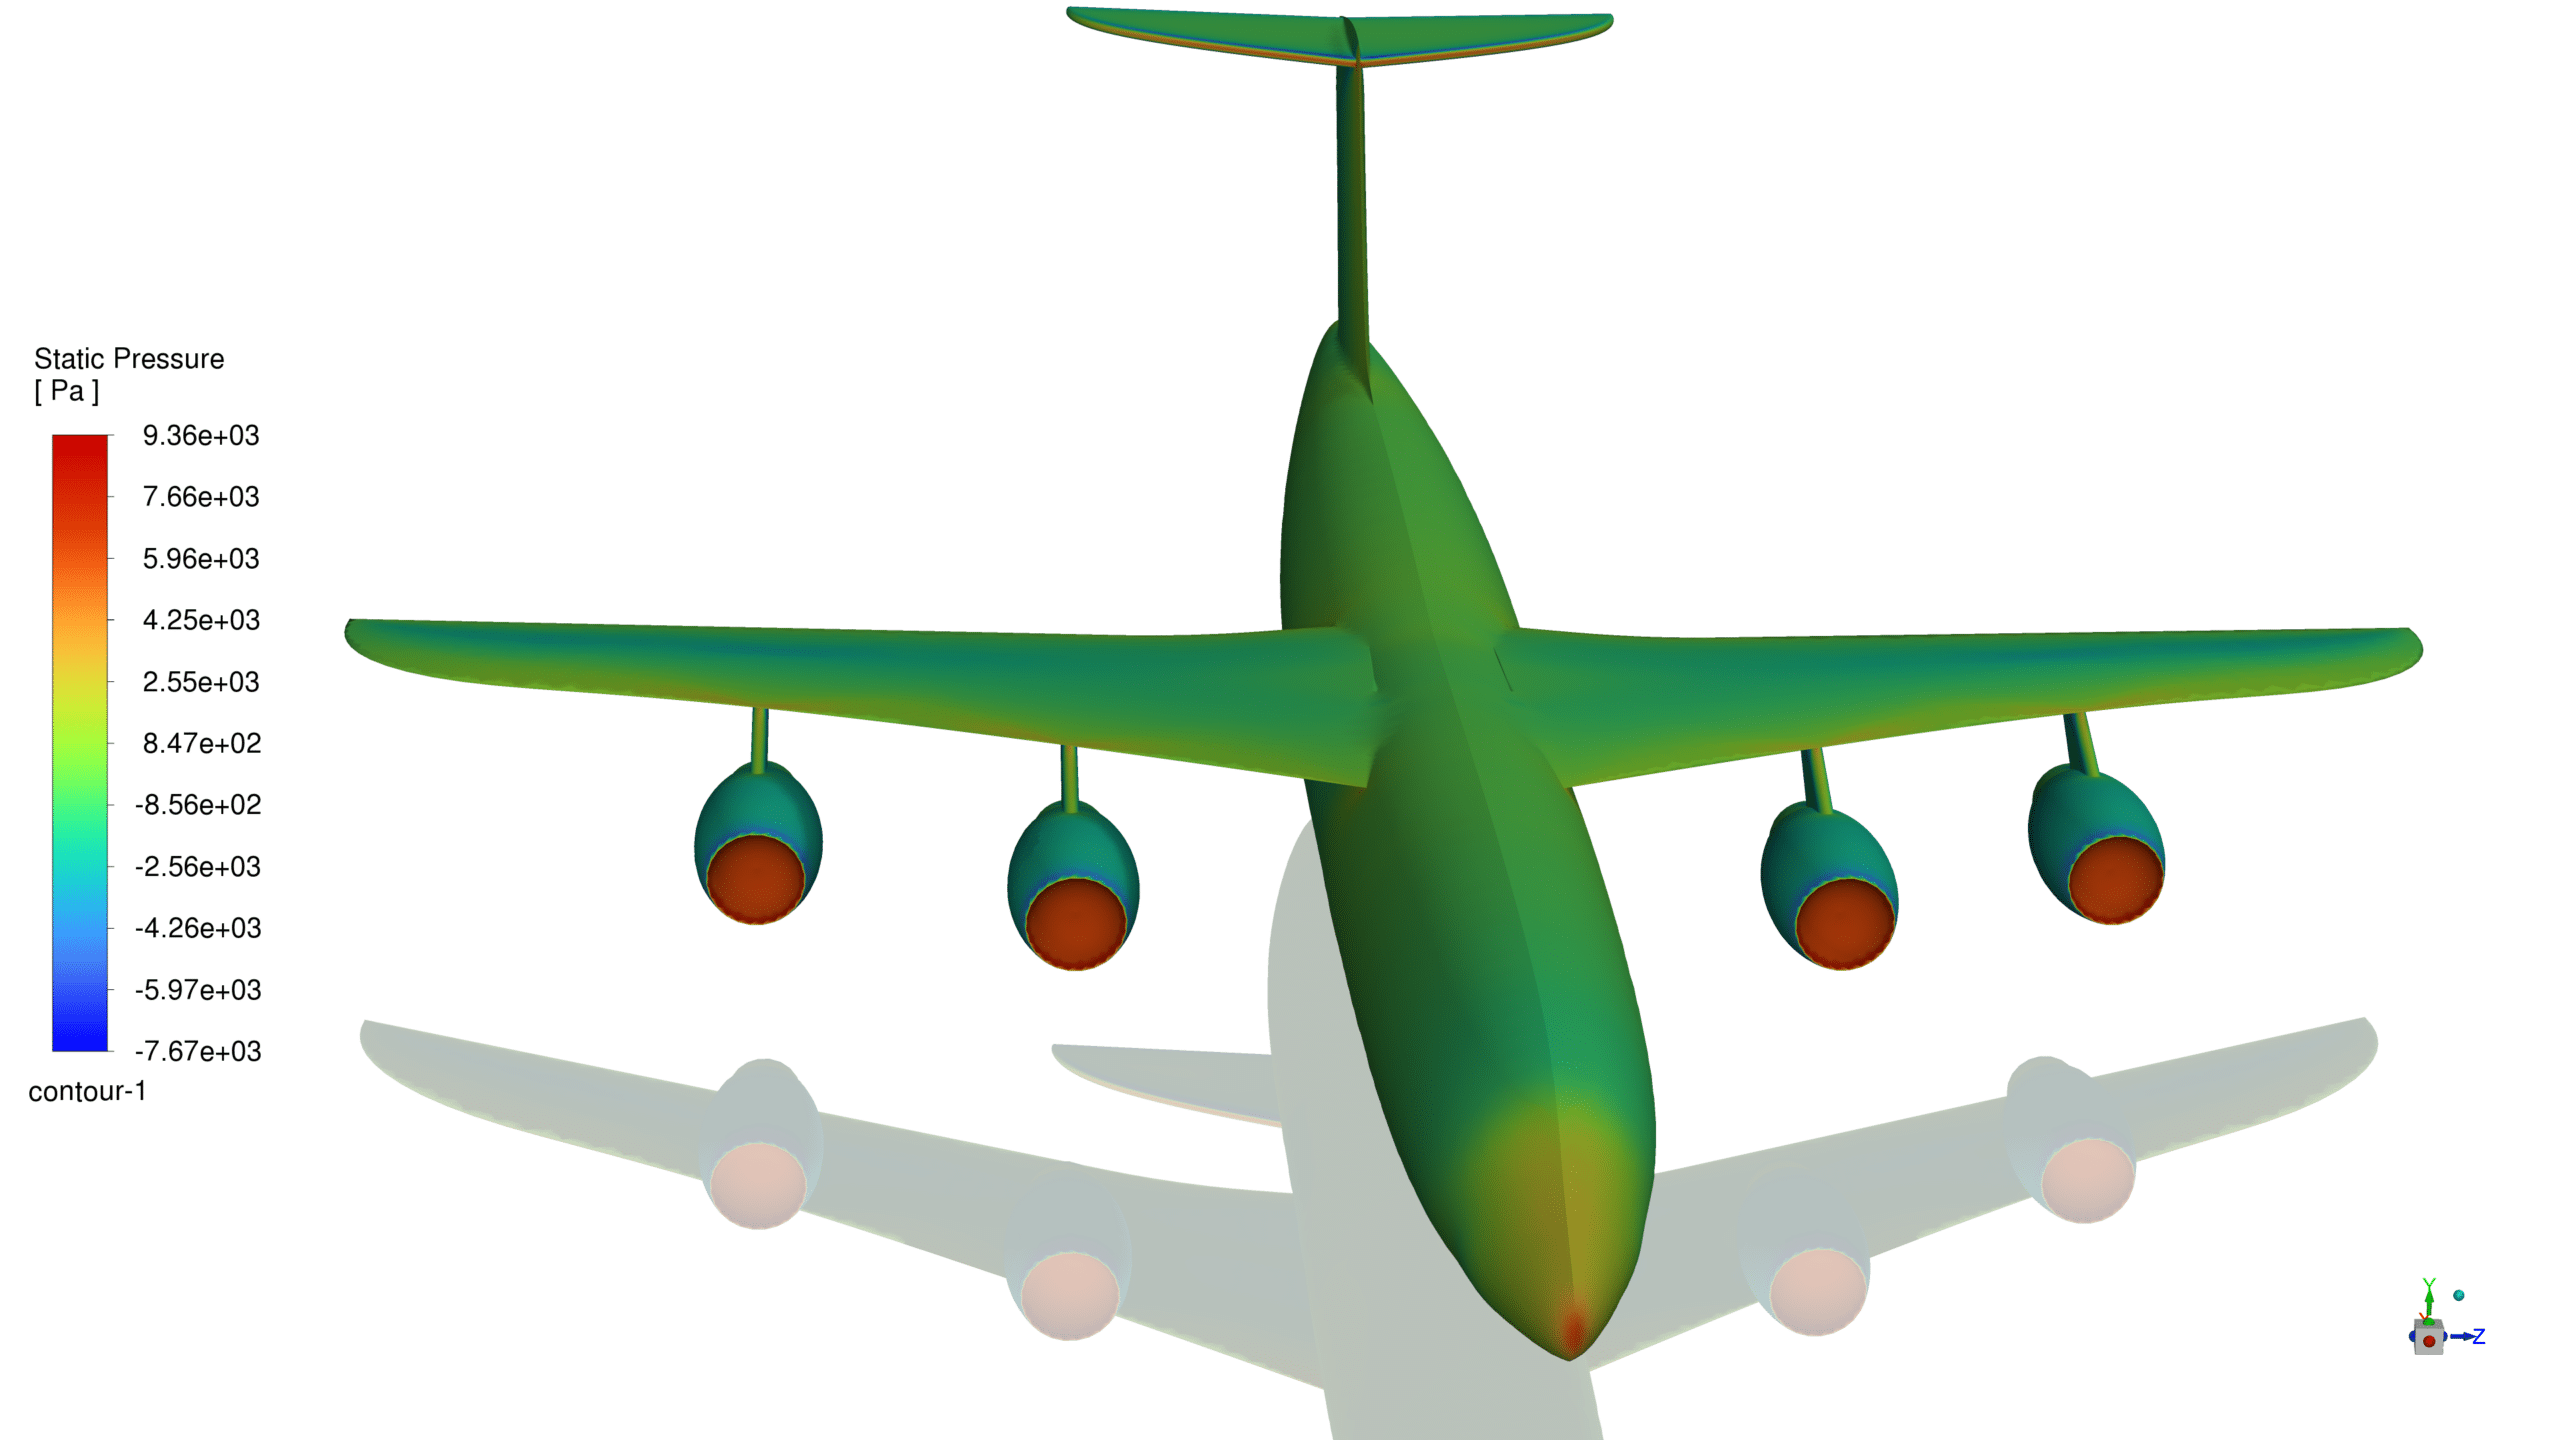
Static Pressure: The static pressure contour plot reveals the pressure distribution on the rocket surface. A high-pressure region is observed at the nose tip. This high pressure is due to the stagnation point at the nose and engines inlet, where the flow rests. The pressure decreases along the body, with low-pressure regions near the wings.
Reviews
There are no reviews yet.