Pollutant Distribution from Car Exhaust in Static and Traffic (Low-Speed) Modes
$140.00 $70.00 Student Discount
In this research, using species transport module, the gases from combustion in the car engine and their interaction with the open air in the urban environment were investigated statically and in traffic mode.
Click on Add To Cart and obtain the Geometry file, Mesh file, and a Comprehensive ANSYS Fluent Training Video.To Order Your Project or benefit from a CFD consultation, contact our experts via email (info@mr-cfd.com), online support tab, or WhatsApp at +44 7443 197273.
There are some Free Products to check our service quality.
If you want the training video in another language instead of English, ask it via info@mr-cfd.com after you buy the product.
Description
Pollutant Introduction
The use of fossil fuels was always associated with various pollutant. Lack of complete combustion and production of NOx, Sox, and unburned hydrocarbons quickly causes more air pollution. Meanwhile, improving fuel production standards are reducing these pollutants day by day. For example, the standard Euro4 is much cleaner than Euro2 fuel. Now, considering that during city traffic, the speed of cars was lower and their distance was closer to each other, the amount of pollution while standing and moving at low speed can be compared. Therefore, simultaneous investigation of pollutants and environmental conditions of cars should be considered.
Problem Description
In this research, using Species Transport module, the gases from combustion in the car engine and their interaction with the open air in the urban environment were investigated statically and in traffic mode by ANSYS Fluent software. For this purpose, the exhaust gas velocity was equal to 1 m / s, and the temperature was 400 K for the static state. In the second case, with the same speed and temperature of the exhaust gas, an external flow with a 3 m / s enters due to the car’s movement in traffic mode. Finally, by comparing the pollutant gases for static and traffic mode with low speeds, the distribution of exhaust pollution was studied.
Geometry & Mesh
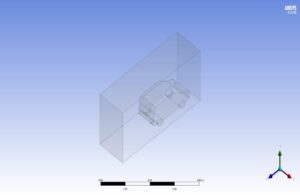
The geometry was designed using the Design Modeler module (figure below), and its geometric specifications include a car and fluid domain around it. For more accurate modeling of gas distribution, the rear side of the car was more extruded. The dimensions of the fluid domain around the car were 4*6*10 m.
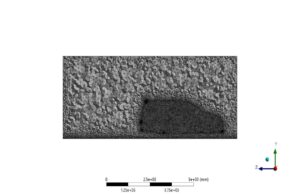
For grid generation, unstructured mesh with 3122361 elements in the ANSYS Meshing module was utilized. Curvature and proximity method was used to focus on grid sensitive areas of the solution domain. The following figure shows the mesh generation for this problem.
Solver Setting
Fluent software was used to solve the governing equations numerically. The problem is analyzed steady, using the pressure-based method, and considering the gravitational effects. Also, for solving the above problem, a combination of RANS and species transport equations was used to study the simultaneous effect of combustion gases and their combination with air in the computational domain.
Pollutant Material Properties
Pollutant gases enter the fluid domain as a mixture material containing NO2, NO, SO2, CO, CO2, Soot, and H2O with mass fraction percentages proportional to the type of pollutant input from the exhaust section. Air is also used as a solution domain fluid with fixed properties in the software.
Boundary conditions and Solution methods
Also, The table below shows the characteristics and values of boundary conditions, along with the models and hypotheses.
| Material Properties | |||
| Amount | Fluid properties (mixture) | ||
| Incompressible ideal gas | Density | ||
| Mixing law | Specific heat | ||
| 0.0454 | Thermal conductivity (w/m.K) | ||
| 0.0000172 | Viscosity (kg/m.s) | ||
| Mass fraction input | |||
| Species mass fraction | Material name | ||
| 0.2 | CO2 | ||
| 0.04 | CO | ||
| 0.01 | SO2 | ||
| 0.00001 | NO2 | ||
| 0.00001 | Soot | ||
| 0.08 | H2O | ||
| Boundary Condition | |||
| Type | Amount (units) | ||
| Velocity inlet (mixture gas at 400 K) | 1 m/s | ||
| Velocity inlet (air at 300 K) | 3 m/s | ||
| pressure outlet (gauge pressure) | 0 pa | ||
| car wall (no slip) | Adiabatic (heat flux=0 W/m2) | ||
| domain wall | symmetry | ||
| Cell zone condition | |||
| Fluid | Air | ||
| Turbulence models (Toyota gas exhaust) | |||
| K- | viscous model | ||
| Standard | K- model | ||
| Standard wall | Wall function | ||
| Solution methods (Toyota gas exhaust) | |||
| Simple | pressure velocity coupling | ||
| Standard | pressure | spatial discretization | |
| Second-order upwind | momentum | ||
| First-order upwind | turbulent kinetic energy | ||
| First-order upwind | turbulent dissipation rate | ||
| Second-order upwind | energy | ||
| Second-order upwind | Species transport | ||
| Initialization | |||
| standard | initialization method | ||
| 0 (Pa) | gauge pressure | ||
| 1 m/s | z-velocity (gas exhaust) | ||
| 3 m/s | z-velocity (traffic mode external flow) | ||
| 0 (m/s) | y-velocity , x-velocity | ||
Results
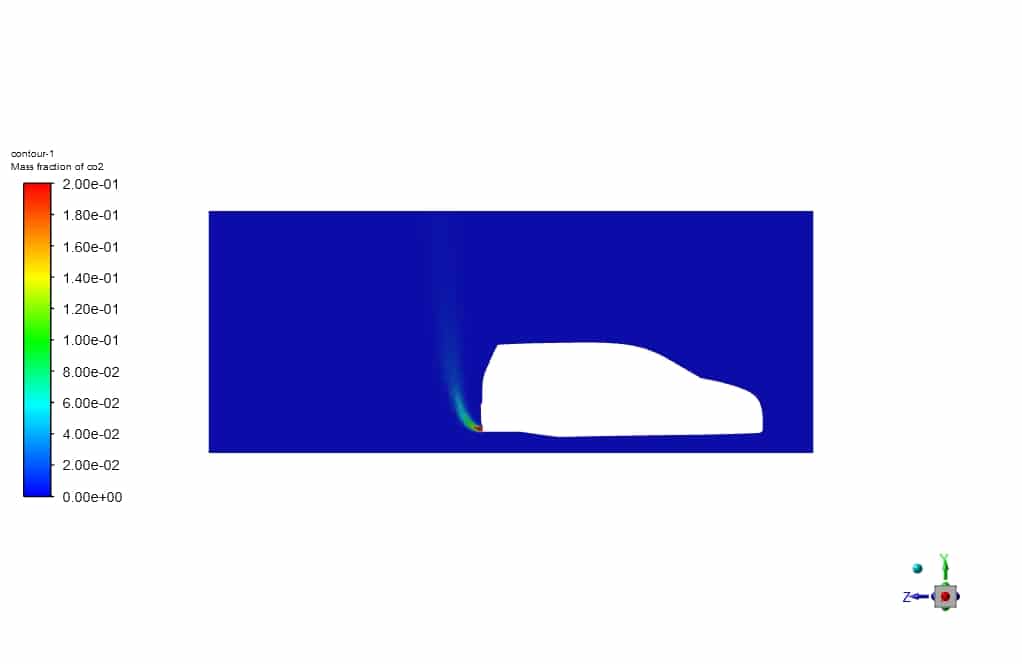
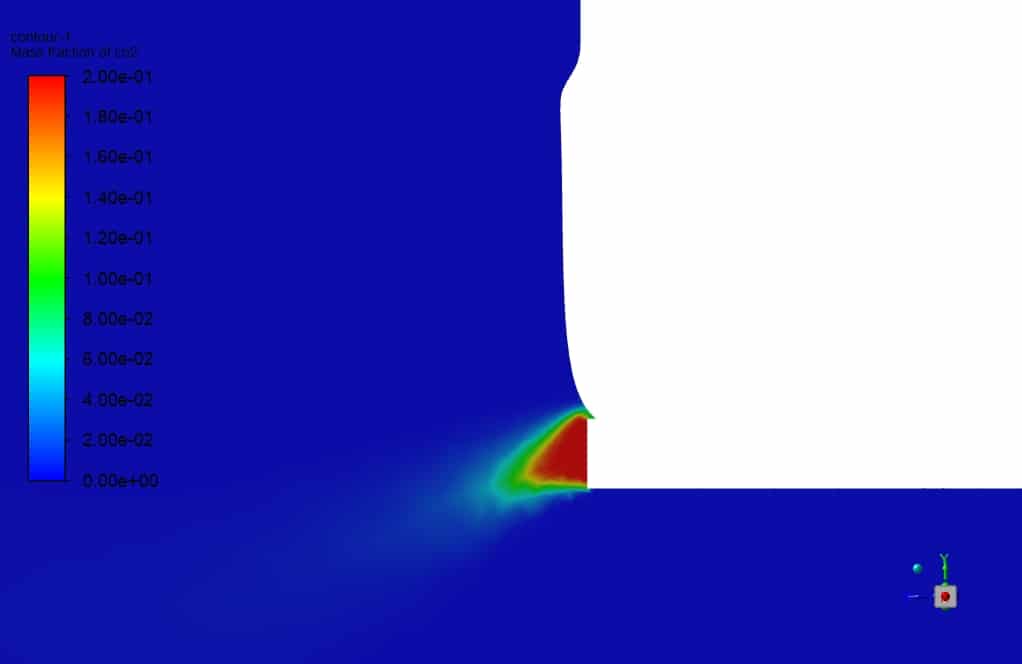
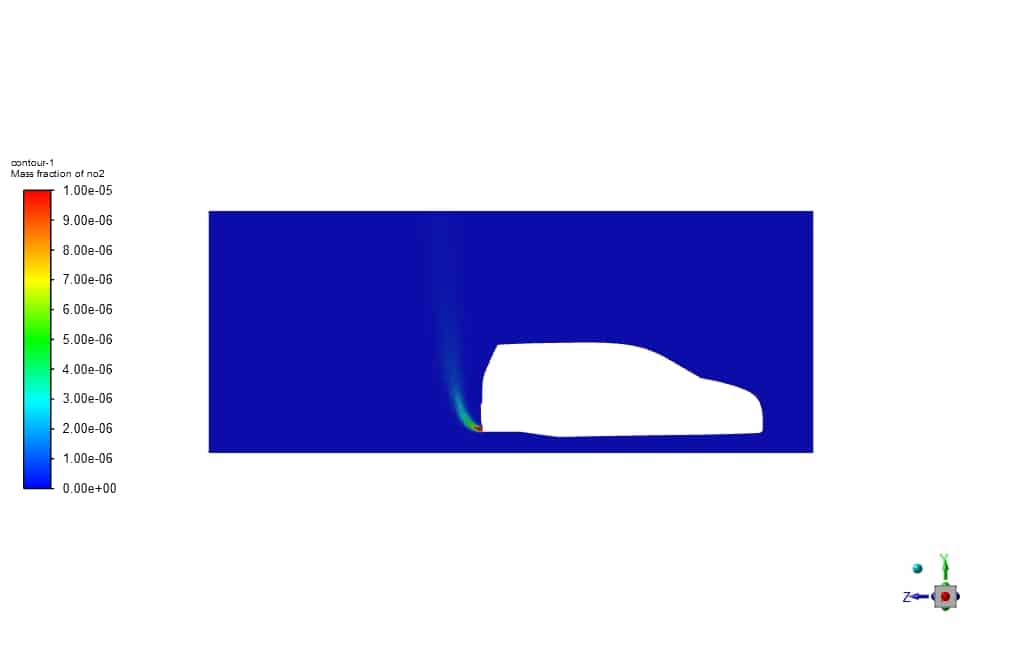
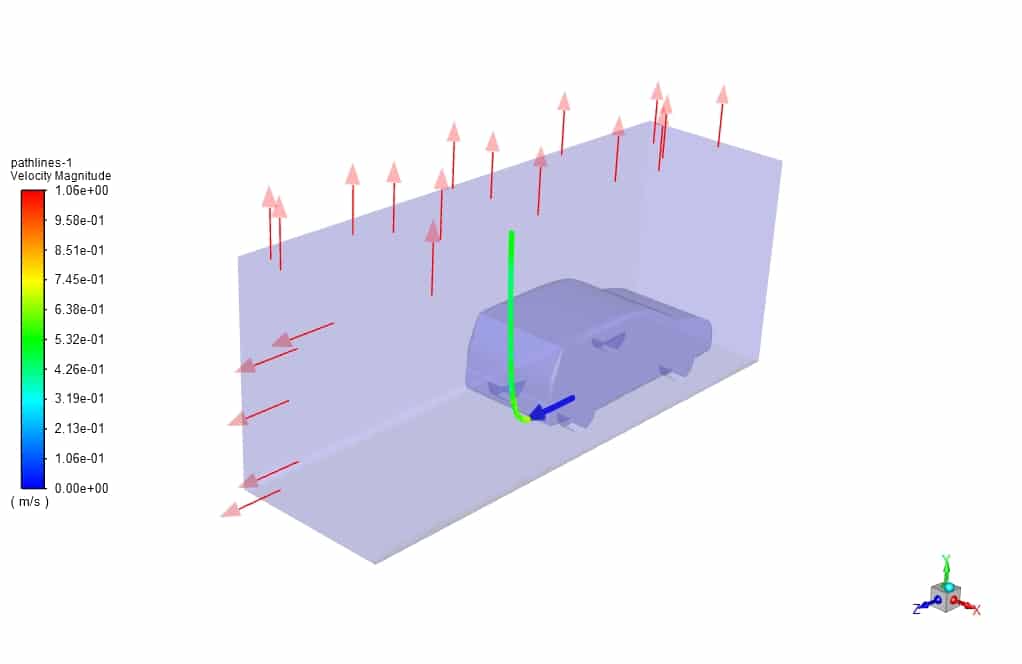
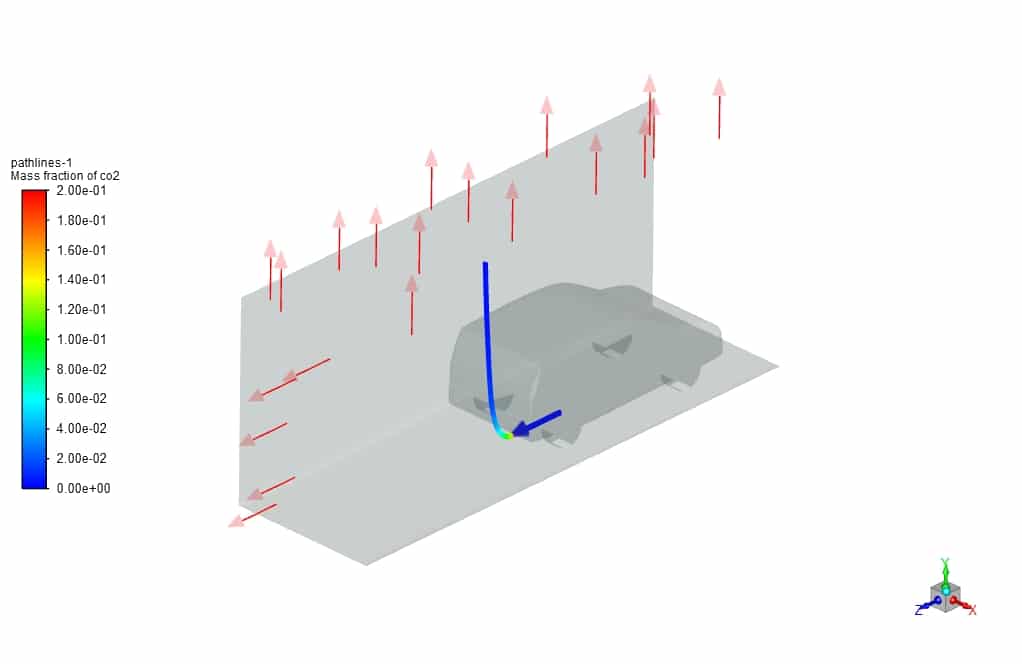
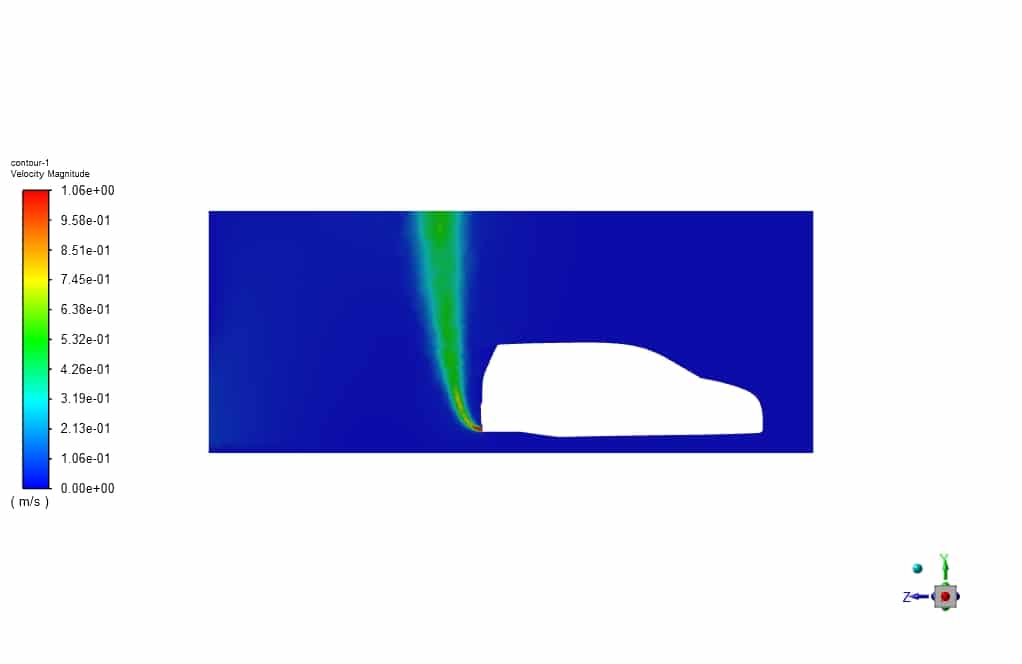
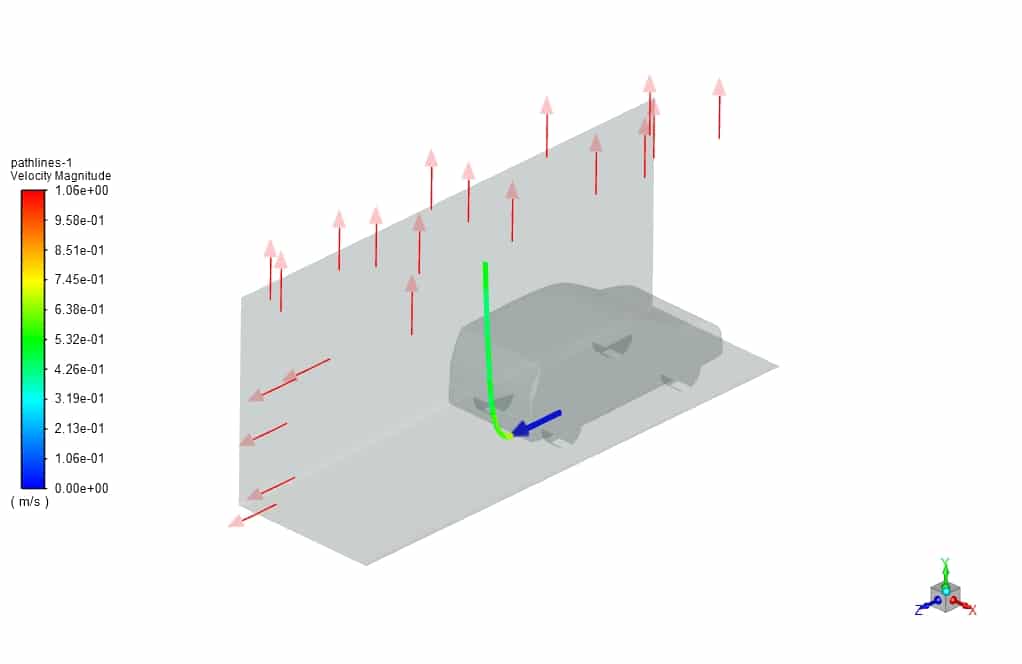
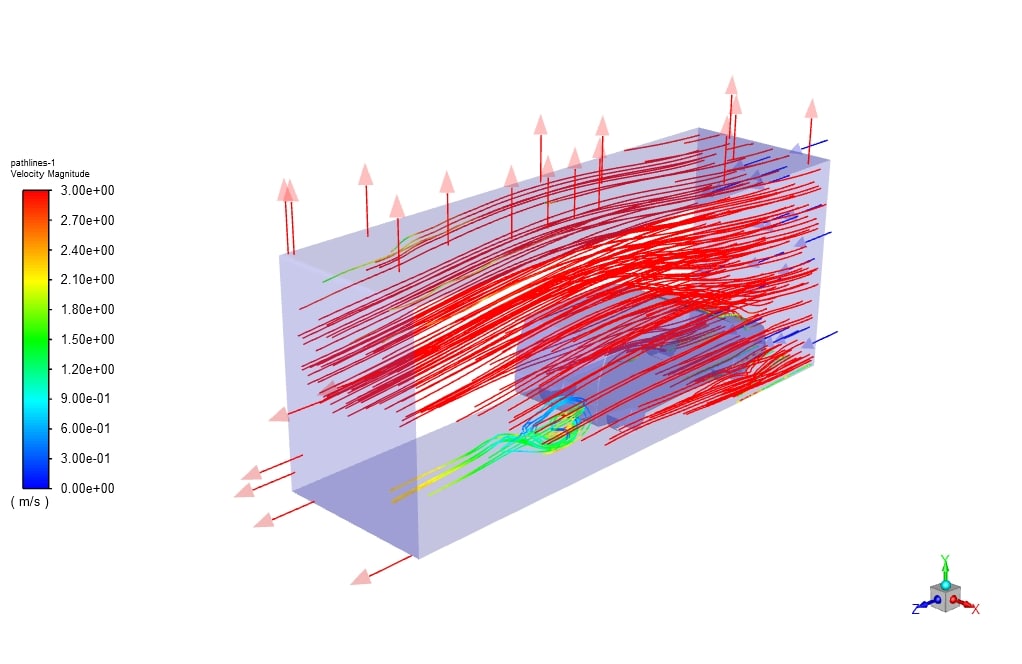
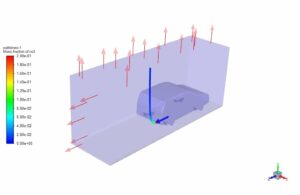
In this section, by studying the contours and streamlines obtained from the simulation, the mass distribution of the species and the effect of external flow in the solution domain were discussed. First, according to the CO2 mass fraction contours and comparing the two static and external flow (traffic mode), it is observed that the presence of external flow or so-called car movement, due to the creation of vortices in the rear, the distribution of pollutants is more horizontal and prevents them from moving rapidly into the atmosphere. The image below is for static mode.
Co2 (pollutant) Distribution for Static Mode
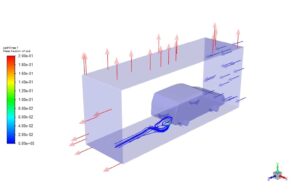
Co2 (pollutant) Distribution for Traffic Mode
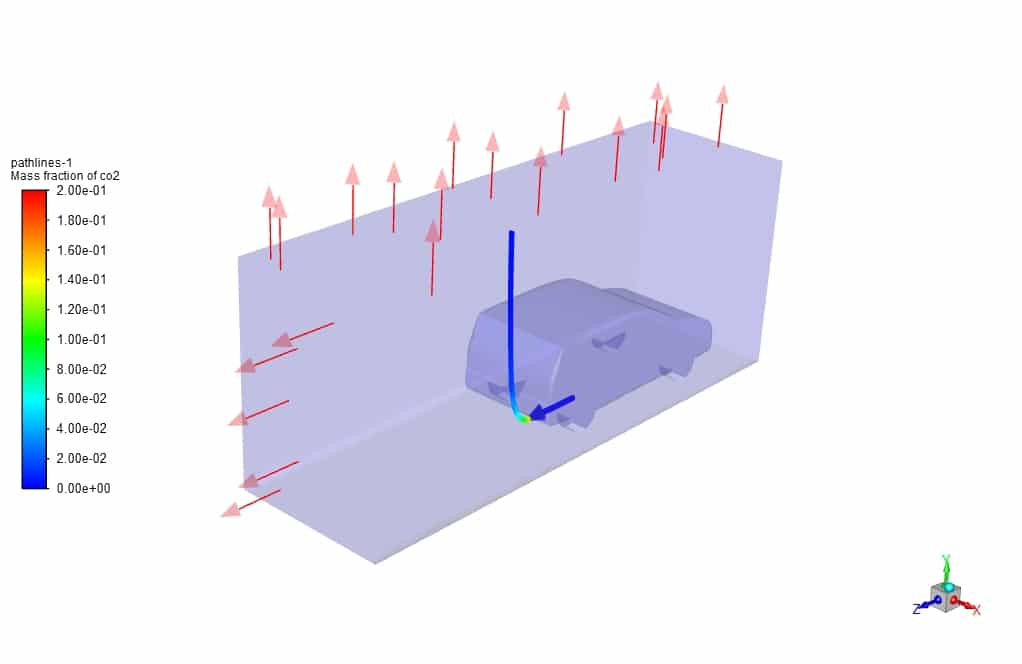
With three-dimensional comparison and using streamlines, the effect of horizontal distribution of species is better determined. In the following figures, first, there is no external flow, and then by importing the external flow, there is no opportunity for pollutant to escape to the atmosphere vertically.






Mrs. Rosalinda Denesik DVM –
Amazing level of detail and thorough analysis in this CFD project on pollutant distribution from car exhausts! The comparison of static and traffic modes gives valuable insights into urban air quality. Great work incorporating various species and considering the effects of car movement!
MR CFD Support –
Thank you for your positive feedback! We’re glad to hear that you found the project details and analysis helpful. Our goal is to provide insightful and comprehensive CFD studies that can aid in understanding and reducing pollution. If you have any further questions or need more information, feel free to reach out to us. We appreciate your support.
Dr. Ewell Mraz V –
I am very impressed by how you studied the impact of car movements on pollutant distribution. Could you elaborate on how the difference in results between static and low-speed traffic modes will influence urban air quality modeling?
MR CFD Support –
Thank you for your compliment on our study of pollutant distribution in static and low-speed traffic modes. The difference in results between these two modes is significant for urban air quality modeling as it demonstrates how vehicle speed and proximity affect the dispersal patterns of pollutants. In static mode, pollutants tend to rise vertically, potentially dispersing more quickly into the atmosphere. However, in traffic mode, the formation of horizontal vortices at the back of cars due to car movement results in a more horizontal spread of pollutants. This can lead to higher concentrations of pollutants at ground level where people are present. Urban air quality models can use this data to better predict pollution exposure levels in various traffic scenarios and to design strategies for improving air quality, such as traffic flow optimizations or emission controls.
Dr. Itzel Strosin I –
This product’s visualization looks thorough. Do the results help in understanding the real-world application of pollutant distribution, particularly with different traffic speeds?
MR CFD Support –
Thank you for your kind words about the product visualization. Yes, the results from this CFD simulation can offer valuable insights into how pollutants disperse from car exhaust in various traffic conditions. By comparing the distribution in static and low-speed traffic scenarios, users can better understand the real-world impact of vehicular emissions. This knowledge can inform strategies for urban planning, traffic management, and environmental protection initiatives.
Emmett Braun –
I appreciate the detailed analysis on how car movement and low speed affect pollutant distribution. The streamlines seem to provide clear insight. Can you further explain how the formation of vortices at the rear of the car influences this process?
MR CFD Support –
We’re happy to hear that the analysis met your expectations! The formation of vortices at the rear of the car becomes more prominent when the car is in motion, especially at low speeds associated with city traffic. These vortices create a turbulent wake behind the vehicle which then acts as a barrier, diverting the pollutant gases and spreading them out horizontally. As a result, instead of pollutants rising vertically, they are more likely to be dispersed along the road level, which can affect local air quality more significantly than if they were to disperse upwards into the atmosphere. This turbulent mixing caused by the vortices enhances the horizontal dispersion of pollutants.
Dr. Steve O’Reilly –
After using this tutorial, I’m quite impressed with how thoroughly pollutant dispersal was treated. Nicely laid out steps with polished visual aids. Definitely a boost for my project on environmental impacts!
MR CFD Support –
Thank you for your kind words! We are thrilled to hear that our tutorial was helpful for your project. We consistently strive to provide comprehensive and visually engaging material to facilitate learning, and positive feedback like yours encourages us to keep creating high-quality content.
Maria Bednar DVM –
After reading about the Co2 (pollutant) distribution in both static and traffic modes, the visuals must be very telling. The impact of the external flow on pollutant behavior is fascinating. Kudos to MR CFD for creating such an informative and realistic simulation analysis! Truly eye-opening research that highlights critical environmental interactions.
MR CFD Support –
Thank you very much for your positive feedback! We are glad to hear that you found the simulation analysis of pollutant distribution informative and compelling. At MR CFD, we strive to provide detailed and realistic simulations to aid in understanding environmental phenomena. Your appreciation means a lot to us, and it motivates us to continue delivering high-quality CFD studies. If there’s anything more we can help you with, please let us know.
Dr. Rahul Bailey –
This CFD simulation was incredibly detailed! I learnt so much about pollutant distribution from your analysis. The comparison between static and traffic modes for car exhaust pollutant distribution is eye-opening and illustrates the importance of considering real-world traffic conditions in environmental impact studies.
MR CFD Support –
We are extremely gratified to hear that our simulation has provided you with a richer understanding of pollutant distribution from car exhausts. Thank you for your observation on the importance of real-world conditions, and we appreciate you taking the time to compliment our work. Your feedback encourages us to continue delivering high-quality analysis and insightful conclusions.
Dr. Freeman Walter II –
I’m blown away by the level of detail in the pollutant distribution analysis. The distinction between static and traffic mode simulation is fascinating!
MR CFD Support –
Thank you for the positive feedback on our pollutant distribution simulation! We’re happy to hear that you found the distinction between static and traffic mode insightful. If you have any further questions or need more information, feel free to ask!
Alfonso Sipes Jr. –
The provided results are incredibly insightful. It’s fascinating to see how traffic conditions affect pollutant dispersion. Does the simulation account for variable wind patterns, and can one deduce the optimal traffic flow conditions that minimize pollution in urban settings?
MR CFD Support –
Thank you for your interest in our pollutant distribution study. Our research focused on a controlled environment to understand the baseline dispersion of pollutants in static and low-speed traffic conditions. However, variable wind patterns are not included in this specific simulation. Determining the optimal traffic flow to minimize pollution would require a multi-variable analysis including wind patterns, which could certainly be considered for further research to provide a comprehensive understanding of urban pollution management.
Aubree Hammes –
What specific improvements are suggested to reduce pollutants based on the traffic versus static mode findings?
MR CFD Support –
Based on the traffic versus static mode findings, no specific improvements are suggested in the text. However, general suggestions to reduce pollutants could involve vehicle design modifications to enhance aerodynamics, which may affect the rate of pollutant dispersion, or developing regulations and technologies targeting a reduction in emissions from vehicles, especially at low speeds, such as stop-start systems or hybrid engines.
Jack Upton –
My comprehension of the simulation is pretty good but, I’m a little curious, do the adverse effects of slow moving traffic on air quality match what was observed experimentally? How closely does the simulated data reflect what actually happens in an urban traffic scenario?
MR CFD Support –
In the simulations conducted by MR CFD, a detailed comparison with experimental data wasn’t provided. However, simulations by design look to replicate real-world behaviors, and in the case of pollutant distribution, the simulation outcomes often show trends observed in real-life traffic scenarios. In practice, it is expected that slow-moving traffic would cause more accumulation of pollutants close to the ground, as the external flow (movement of the air, for example) is not fast enough to disperse the pollutants effectively. The CFD results capture this by demonstrating how pollutants form vortices and spread horizontally rather than dispersing upwards. For an accurate reflection of the real environment, rigorous validation against experimental data would be necessary, which could include specialized field studies or well-documented experiments on emissions and dispersal patterns.
Dr. Buddy Yost MD –
The review was very informative! The detailed descriptions of solver settings, geometry and mesh, as well as the boundary condition setups were particularly useful. One small thing I was curious about; is sedimentation of particles like Soot considered in the simulation?
MR CFD Support –
I’m glad you found the review informative! To address your question, since it’s not mentioned in the provided data, one can infer that the simulation does not explicitly account for particle sedimentation like Soot. In this study, the primary focus is on the distribution of gaseous pollutants, employing a species transport model to examine their dispersion in both static and traffic (low-speed) conditions. For particle sedimentation to be included, additional modeling techniques, such as the Discrete Phase Model (DPM), would need to be employed.
Prof. Tyshawn Nikolaus –
The software mentioned in the learning material seems extensive. What level of expertise is required to operate such simulations effectively, and does the product come with ample documentation or tutorials for beginners?
MR CFD Support –
To effectively operate these simulations, a foundational understanding of CFD principles and experience with simulation software like ANSYS Fluent is recommended. MR CFD provides comprehensive documentation and step-by-step tutorials suitable for users with various levels of familiarity, including beginners. Furthermore, customer support is available to assist with any questions that may arise during learning or application usage.
Dr. Sydnee Johnston –
I am blown away by the complex analysis performed on the pollutant distribution from car exhausts. The detailed examination of species transport and utilization of CO2, CO, SO2, and other gases provides a solid foundation for environmental impact assessments. The meshing details and solver settings show a high level of consideration for accuracy in simulation. Outstanding attention to the impact of vehicle motion on pollutant dispersion!
MR CFD Support –
Thank you for your appreciation! We strive to provide comprehensive and accurate CFD analyses to help understand the dynamics of pollutant distribution. We’re pleased to see that the details of our simulations, including the meshing processes and solver settings, meet your expectations and provide valuable insights. We’re committed to supporting environmental assessments with reliable data. If you have any more thoughts or need further information, please let us know.
Destin Langosh –
Wow, the detail in this study is impressive! It seems like the simulation provides a clear understanding of how traffic conditions impact pollutant distribution from car exhausts.
MR CFD Support –
Thank you for your positive feedback! We are glad to hear that you appreciate the depth of research and detailed analysis provided in the simulation. Our goal is to offer valuable insights to help address environmental concerns related to vehicular pollution. If you have any further inquiries or require additional data, please don’t hesitate to get in touch with us.
Norwood Sporer –
Super impressed with the level of detail into the pollutant distribution study; thorough and insightful! After reading about the mesh details and solver settings, I feel confident about the robustness of this simulation.
MR CFD Support –
Thank you for your positive feedback! We’re glad to hear that you found the information on the mesh details and solver settings reassuring. Our aim is to provide comprehensive and in-depth analysis in our studies. If you have any more questions or need further clarification, feel free to reach out!
Margaretta Wiegand –
Fantastic learning material! This CFD analysis gives an insightful perspective on environmental effects of car emissions in various traffic conditions. Its detailed breakdown of particle distribution informs us about the impacts of combustion in real-world scenarios. Kudos to MR CFD for synthesizing complex data into an educative tool.
MR CFD Support –
Thank you for your positive feedback! We are delighted to hear that our CFD product on pollutant distribution has provided you with valuable insights. We appreciate your recognition of the efforts to present complex data comprehensively. Your encouragement is greatly valued.
Geovanni Jones –
The thoroughness of the pollutant distribution analysis in the traffic scenario is impressive. The inclusion of multi-species transport models and real-world driving conditions like lower speeds and close proximity to other cars makes this simulation a valuable tool for understanding urban air quality exposure. Plus, the attention to detail in setting up realistic boundary conditions and material properties adds to the credibility of your results. Fantastic work!
MR CFD Support –
Thank you for your fantastic review! We are glad to know that our efforts to create a comprehensive and realistic simulation environment have been recognized and appreciated. Your feedback is encouraging, and it motivates us to continue providing high-quality and detailed CFD simulations. Thank you for taking the time to share your thoughts!
Prof. Dalton Blanda MD –
I learned a lot from this simulation on pollutant distribution. I’m curious about what improvements have been made to reduce these pollutants compared to older fuels?
MR CFD Support –
Improvements in fuel production, such as the transition from Euro2 to Euro4 standards, have considerably decreased the levels of pollutants like NOx, SOx, and unburned hydrocarbons. Vehicles are now equipped with better combustion technologies and exhaust after-treatment systems, such as catalytic converters and particulate filters, that help in significantly reducing emission levels.
Andy Jerde –
I’ve noticed that in the Product Description, specific mass fraction percentages for the pollutant gases were mentioned. Could you please provide more detail on how these mass fractions are determined for the simulation?
MR CFD Support –
Certainly, the mass fraction percentages for the pollutant gases in the simulation are determined based on empirical data from engine tests and emissions regulations such as Euro standards. These percentages reflect typical amounts found in exhaust emissions for a specific type of fuel and engine technology. The CFD software then uses these predefined proportions to simulate the mixture entering the computational domain as exhaust from the car.
Quentin Bartoletti –
The simulation detail provided is very comprehensive! Great job! Just curious about one aspect – which turbulence model is found to be the most effective for capturing the flow and dispersion of pollutants in complex urban environments? Additionally, were any validation studies performed for this traffic simulation scenario against real-world data?
MR CFD Support –
Thank you for your kind words! To capture the complexity of the urban traffic scenario, the k- extbackslashepsilon model is typically utilized in these cases due to its robustness and reliable performance in a variety of turbulent flow conditions. Validation against real-world data is crucial for accurate simulation work. We typically perform such validation when feasible; however, we encourage you to contact our support or consulting team for more in-depth information on validation studies specific to this simulation.
Shanny Durgan –
The detail and specifics in this product were outstanding! I learned so much about the difference in pollutant distribution between static and traffic modes. The utilized Species Transport module in ANSYS Fluent seems incredibly effective for urban environmental studies.
MR CFD Support –
Thank you for your positive feedback! We’re glad to hear that our simulation product has contributed to your understanding of urban air pollution and computational fluid dynamics. Your appreciation for the specifics and the effectiveness of the Species Transport module is much appreciated. If you have any more questions or need further assistance, we are always here to help!
Neha Parker –
I’m truly pleased with the clarity this simulation brings to how car exhaust pollutants distribute in different urban scenarios. The detailed examination of static vs. traffic modes helps in understanding real-world effects on pollution spread. Great job incorporating various factors like external flows into the analysis!
MR CFD Support –
Thank you so much for your positive feedback! We’re glad to know that our simulation assisted in your understanding of pollutant distribution from car exhausts in various conditions. If you need any further information or have any more inquiries, feel free to reach out! We’re always here to provide comprehensive insights and aid in educational endeavors.
Gino Becker –
I appreciate the level of detail in describing the pollutant distribution study. The comparison between static and traffic mode is especially insightful. The visuals must have been very helpful for understanding pollutant dispersion in urban conditions.
MR CFD Support –
Thank you for your kind words! We’re delighted that you found the study on pollutant distribution from car exhaust in various conditions valuable. It’s wonderful to hear that the detailed comparison and visuals helped deepen your understanding of urban pollution dynamics. If you have any further questions or need assistance, feel free to reach out!
Elian Kozey II –
I noticed that the computational domain’s dimensions are mentioned. How does the size of the computational domain affect the simulation results, especially concerning the dispersal of pollutants?
MR CFD Support –
An appropriately sized computational domain is crucial; it must be large enough to accurately simulate the dispersion of pollutants and capture their interactions with the surrounding air without the domain boundaries influencing the results. Choosing the right dimensions ensures that the flow and pollutant dispersion patterns develop naturally and that the boundary conditions do not artificially impact the pollution distribution. In our simulations, the domain size allows for a comprehensive capture of pollutant dispersion while minimizing computational resources.
Rafaela Jerde –
The learning materials provided by MR CFD were comprehensive and simplified complex topics. The step by step analysis of pollutant distribution helped me understand the effects of car exhaust in different traffic conditions on a deeper level.
MR CFD Support –
Thank you so much for taking the time to leave us this amazing review. At MR CFD, we continuously strive to present complex concepts in an accessible manner, and it’s great to hear you found the pollutant distribution materials comprehensive and insightful!
Angus Rau –
The simulation results show clearer horizontal distribution of pollutants with added external flow; but do the results indicate any drawbacks of external flow concerning pollutant distribution, or is horizontal dispersing entirely beneficial?
MR CFD Support –
The primary advantage of the horizontal dispersion induced by the external flow in traffic mode is that it prevents rapid vertical pollution dispersion into the atmosphere. However, the simulation does not indicate drawbacks explicitly, but one potential concern could be the increased exposure to pollutants at ground level, where pedestrians and other vehicles are present. Further analysis would be needed to conclusively determine any negative impacts.
Jayde Gleichner –
The research on pollutant distribution from car exhaust is detailed. Thanks for offering such comprehensive insights into the impacts of vehicle emissions in different conditions. Great job showcasing how simulation tools can help us understand critical environmental factors.
MR CFD Support –
Thank you for your positive feedback on our study of pollutant distribution from car exhaust! We appreciate your recognition of the depth and relevance of our research, and we’re glad to know that the applied simulation approach has been helpful in understanding the environmental implications of emissions. If you have any questions or need further information about our software or simulations, feel free to reach out.
Deshaun Baumbach DDS –
I just completed the car exhaust pollutant distribution tutorial by MR CFD Company. Fascinating use of the Species Transport model to see the distribution of the pollutants. It was particularly interesting to observe how the pollutants spread differently in static versus traffic modes. Kudos for offering such an in-depth and practical simulation exercise. The visuals were superb in understanding the distribution, really added to the learning experience!
MR CFD Support –
Thank you for sharing your positive experience with our car exhaust pollutant distribution tutorial. We are pleased to hear that you found the tutorial fascinating and valuable. Visuals play a crucial role in understanding complex simulations, and we’re glad they effectively aided your learning. If you have any further questions or need assistance in the future, feel free to reach out!
Annabel Christiansen –
The level of detail in your simulation work appears exceptional! Your approach differentiates the pollutant distribution between static and low-speed traffic modes quite clearly. The results, it seems, could greatly inform urban planning and vehicle emissions standards. Well done on conducting such comprehensive research.
MR CFD Support –
Thank you for your thoughtful and encouraging review! We’re very pleased to hear that the research provided clear insights and may have beneficial applications for urban planning and emission standards. We appreciate you taking the time to acknowledge the complexity of our work. Your feedback is incredibly valuable to us.
Troy O’Hara –
I wasn’t sure if I had to activate specific settings to simulate the external flow in traffic mode. Could you clarify if there’s anything in particular I should do?
MR CFD Support –
To simulate the traffic mode with the external flow, you should set the boundary condition for the airflow entering at 3 m/s and at a temperature of 300 K to replicate the effect of the car’s movement in traffic. The exhaust gas velocity remains the same at 1 m/s with a temperature of 400 K as in the static state. Make sure the inlet boundary condition is correctly applied, and species mass fractions are set for the appropriate simulation of the pollutant dispersion.
Krista Parisian V –
This study is fascinating! How does the external airflow in traffic mode impact the concentration of pollutants at various distances from the car, considering the pollutants may be more widely dispersed?
MR CFD Support –
The external airflow in traffic mode induces additional aerodynamic forces which create a wake behind the moving vehicle. This effect increases the turbulence and mixing of the exhausted gases with the ambient air. Consequently, pollutants are spread out more horizontally instead of vertically ascending. As a result, the concentration of pollutants might be higher and more widespread at street level in the immediate vicinity of the vehicle, which could potentially affect air quality for pedestrians and neighboring cars. However, further from the vehicle, the concentration would gradually decrease due to the dilution with the surrounding air.
Mrs. Carolyne Pagac –
The simulation review was quite informative and descriptive. I’m curious, how does the external airflow influence the cooling of the engine, or was engine cooling not part of this simulation study?
MR CFD Support –
In this simulation study, the focus was primarily on investigating the pollutant distribution emitted from the car exhaust in static and traffic (low-speed) modes. The analysis did not touch upon the engine’s cooling aspect, as it specifically aimed to model and compare the dispersion of pollutants under different environmental conditions. The temperature of the exhaust gas post-combustion was taken to be static at 400 K. Engine cooling parameters and its heat dissipation mechanisms in the simulation were outside the scope of this study.
Tobin Satterfield –
The detailed analysis and results are impressive! The visualization of the distribution in static versus traffic modes provides a clear understanding of pollutant behavior.
MR CFD Support –
Thank you for your kind words. We’re glad that the visual representation and comprehensive analysis added clarity to the understanding of pollutant dispersion from car exhaust. It’s rewarding to see that our products are appreciated for their ability to depict complex phenomena in a digestible manner.
Eldred Bauch –
What an exceptional way to understand the impacts of car exhaust on urban air quality. The intricacies of both pollutant behavior and computational simulation are expertly merged in this study, providing valuable insights!
MR CFD Support –
Thank you very much for your kind words. We are thrilled to hear that our simulation on pollutant distribution from car exhaust in different traffic conditions was both informative and valuable to you! It’s great to know our efforts to provide a thorough and illuminating study are appreciated.
Prof. Ike Dickinson –
Comprehensive and intriguing study! I’m curious about how changing weather conditions, such as wind speed and direction, might affect the pollutant distribution. Are these factors considered in the simulations, or would that be a separate study?
MR CFD Support –
Thank you! In the current study, weather factors like wind were not explicitly modeled. However, the external flow in traffic mode can to some extent mimic the effect of wind on pollution dispersion. To fully understand the impact of varying weather conditions, a separate study would indeed be necessary. There, specific wind speeds, directions, and even temperature variations could be implemented and analyzed to see how they influence pollutant spread in both static and traffic scenarios.
Nova Wehner –
I recently explored the CFD analysis on pollutant distribution from car exhaust using ANSYS Fluent. The detail about pollutant distribution change between the static and traffic mode was very intriguing! It’s fascinating how traffic speed and proximity influence pollution dispersal.
MR CFD Support –
Thank you for expressing your interest in our pollutant distribution CFD analysis. We’re delighted to hear that you found the study captivating, especially the aspect on how traffic conditions can affect the spread of pollutants. Appreciating the interactions between pollutants and environmental conditions is critical in enhancing air quality and mitigating the adverse effects of exhaust emissions. We appreciate your grasp of this important environmental issue! If you have any further insights you’d like to share or questions about our other products and analysis, please feel free to reach out.