Speaker Sound Generation and Propagation Inside a Pipe, ANSYS Fluent
$210.00 $105.00 Student Discount
- In this project, generation of sound by displacing of speaker diaphragm is modeled using ANSYS Fluent.
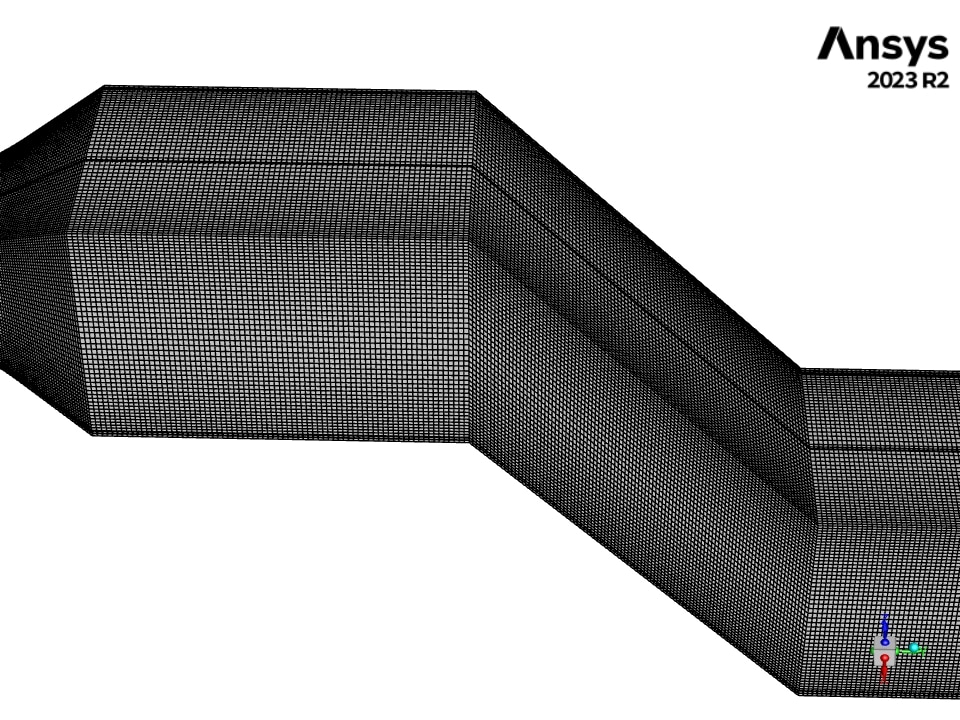
- The geometry was created in SpaceClaim, and a mesh consisting of 687,500 elements was generated using ANSYS Meshing.
- Dynamic mesh used to model the movement of diaphragm during simulation.
- In this project we are going to analyze and see how a speaker can generate a specific sound wave.
Click on Add To Cart and obtain the Geometry file, Mesh file, and a Comprehensive ANSYS Fluent Training Video.
To Order Your Project or benefit from a CFD consultation, contact our experts via email (info@mr-cfd.com), online support tab, or WhatsApp at +44 7443 197273.
There are some Free Products to check our service quality.
If you want the training video in another language instead of English, ask it via info@mr-cfd.com after you buy the product.
Description
Speaker Sound Generation and Propagation Inside a Pipe CFD Simulation, ANSYS Fluent
Description
The sound generation by a speaker consists of multiple steps. First, the incoming electrical input is sent to a coil that generates a fluctuating magnetic field. This magnetic field interacts with the permanent magnet’s field, causing the coil to move back and forth rapidly. This coil is attached to a diaphragm that, by displacing air, creates pressure waves (by moving forward, it pressurizes air, and by moving backward, it expands air). These pressure waves can propagate through air, and if they are in the frequency range of human hearing, they can be perceived as sound.
The frequency of the sound is the same as the frequency of the electrical input, and the amplitude (loudness) of the sound depends on how far the diaphragm moves.
In this simulation, we modeled the diaphragm of a speaker with the assumption that the diaphragm’s maximum displacement is 2mm, and it vibrates in a sinusoidal shape with a frequency of 500Hz.
So, the velocity of diaphragm can be calculated as follow: This velocity formula is defined for the diaphragm boundary by writing a UDF (User-Defined Function) file and hooking it into the dynamic mesh.
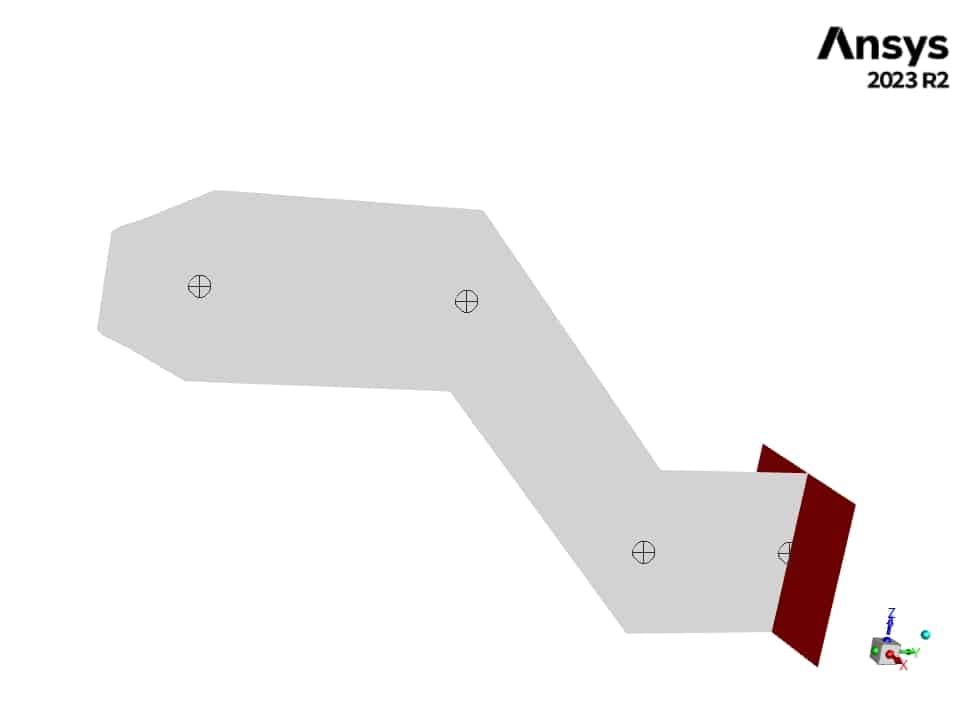
In this project, four receivers are defined, as you can see in the following figure, and results at these points will be investigated. The geometry is designed in SpaceClaim® and meshed using ANSYS Meshing®. The mesh is structured with an element count of 687,500.
Methodology
In this simulation, the turbulence effect is modeled with the k-ε standard model. For modeling the movement of the diaphragm, we use dynamic mesh. At each time step, the software calculates the position of the diaphragm and updates the mesh around this boundary using smoothing and layering methods. The simulation was unsteady with time step size of 0.001 and 1000 number of time step.
Results
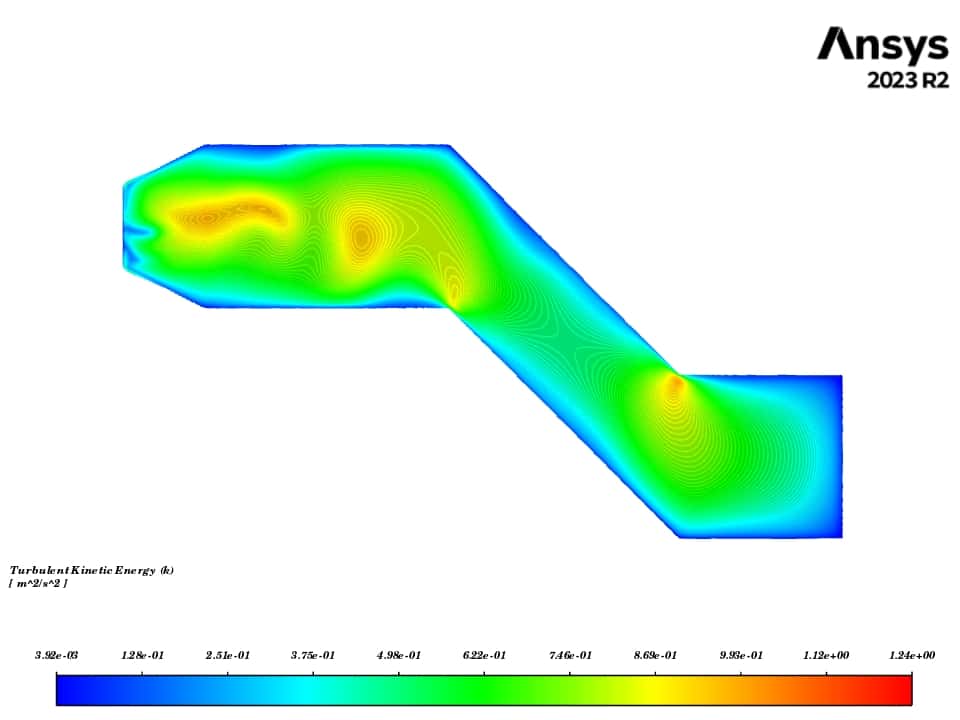
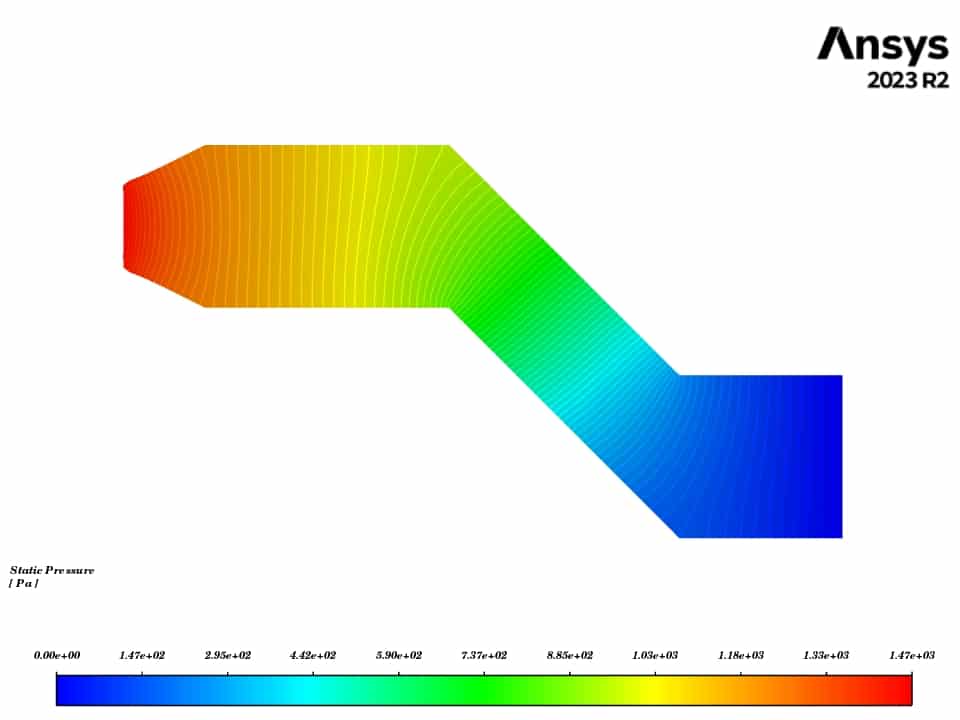
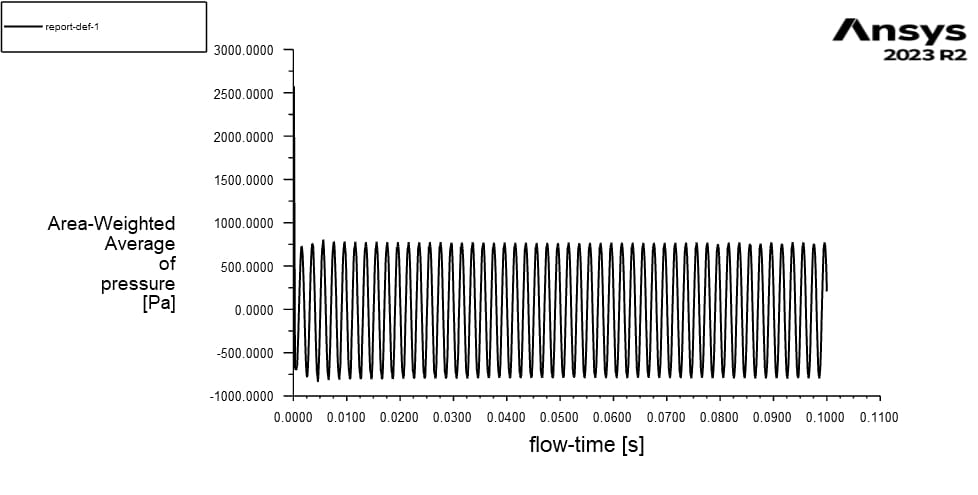
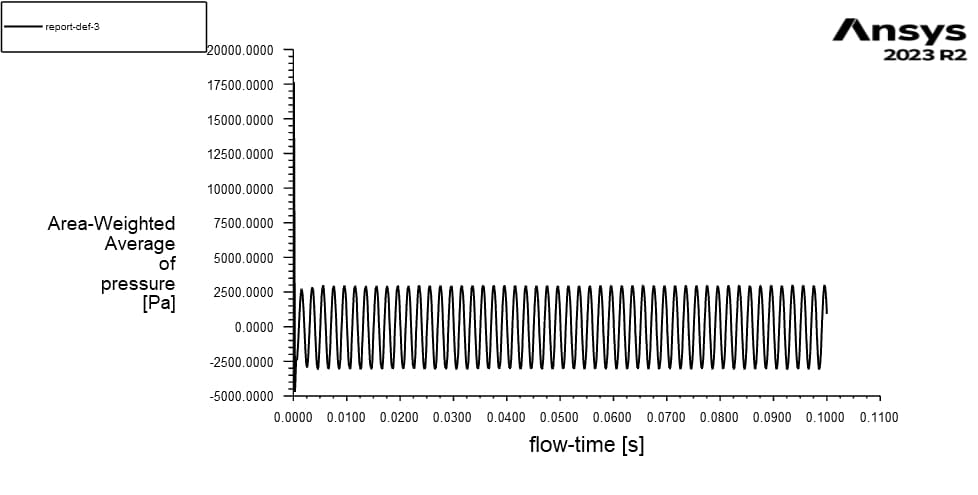
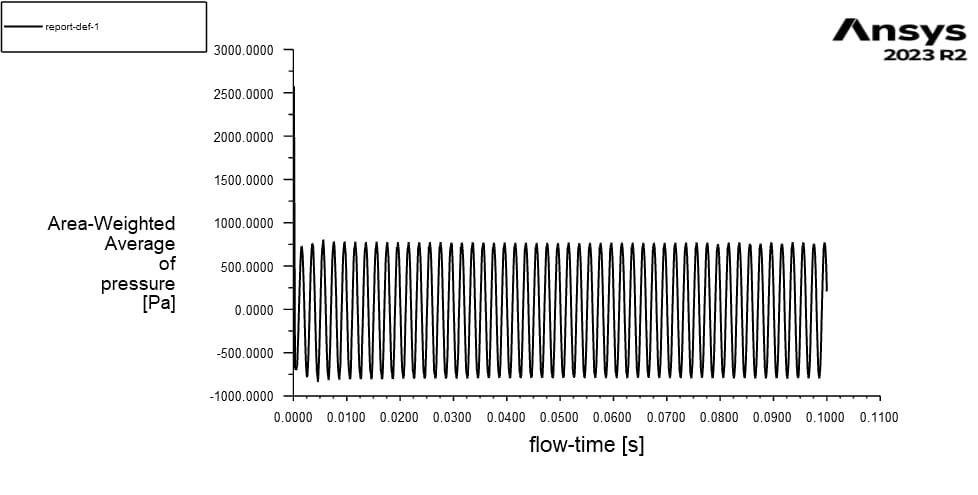
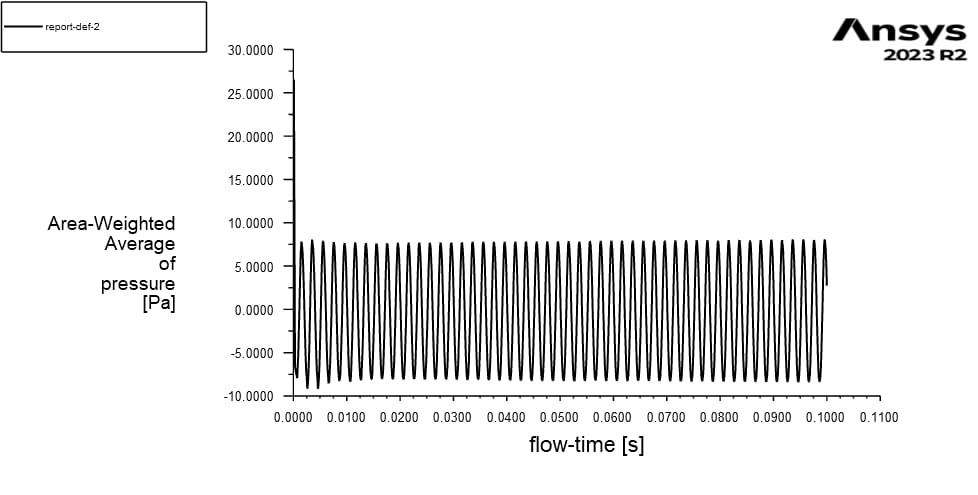
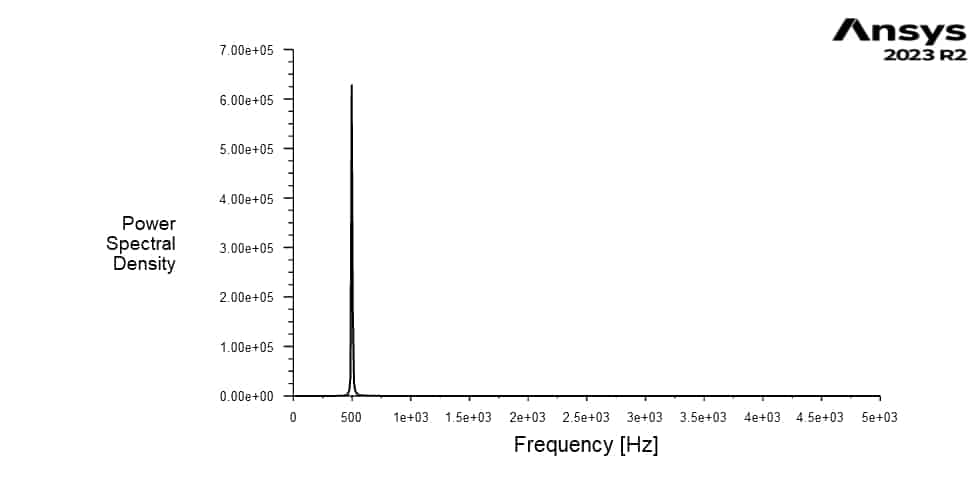
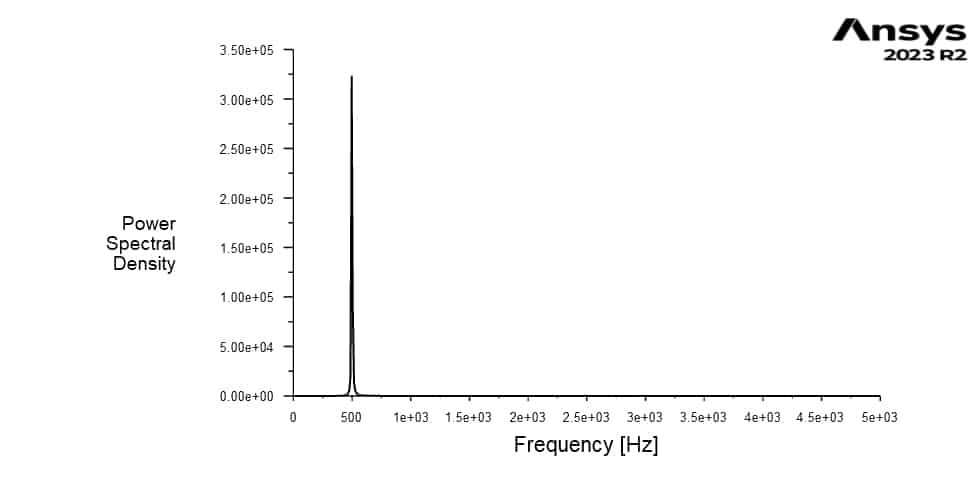
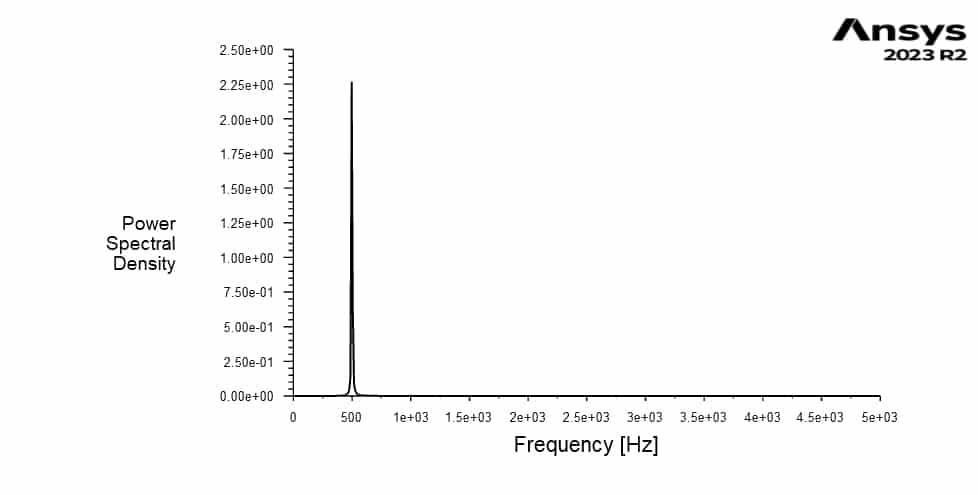
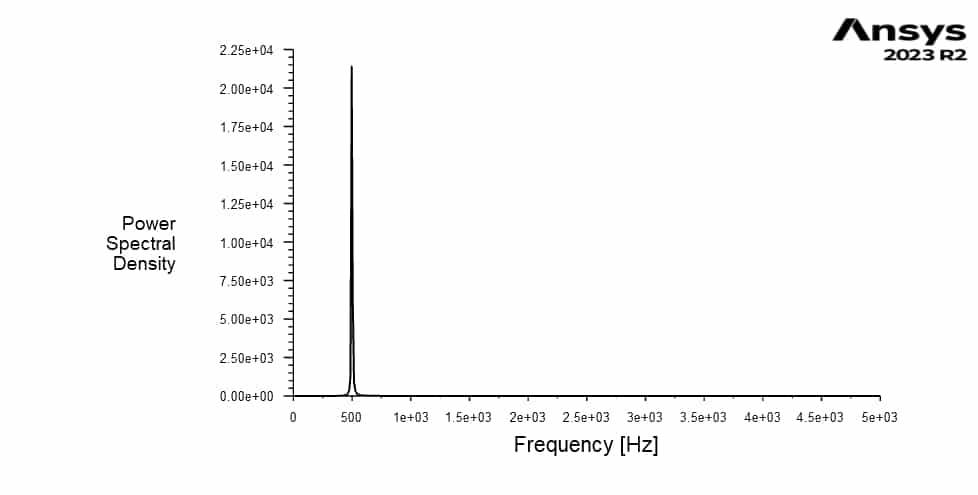
Contours of pressure and turbulence kinetic energy are presented in the central plane, and an animation of the pressure field over time is also provided. Plots of static pressure at four receiver points are extracted. The graph of Sound Pressure Level shows that the frequency of the generated sound is exactly equal to the diaphragm frequency, and the sound amplitude reduces as it propagates downstream. It is clear from the above graphs that the frequency of pressure fluctuations is exactly 500 Hz, which is the frequency of the speaker diaphragm vibration. From receiver 1 to 4, as the distance from the speaker increases, the amplitude of pressure fluctuations (loudness of noise) decreases.


Reviews
There are no reviews yet.