Taxi Drone, Ansys Fluent Simulation
$100.00 $50.00 Student Discount
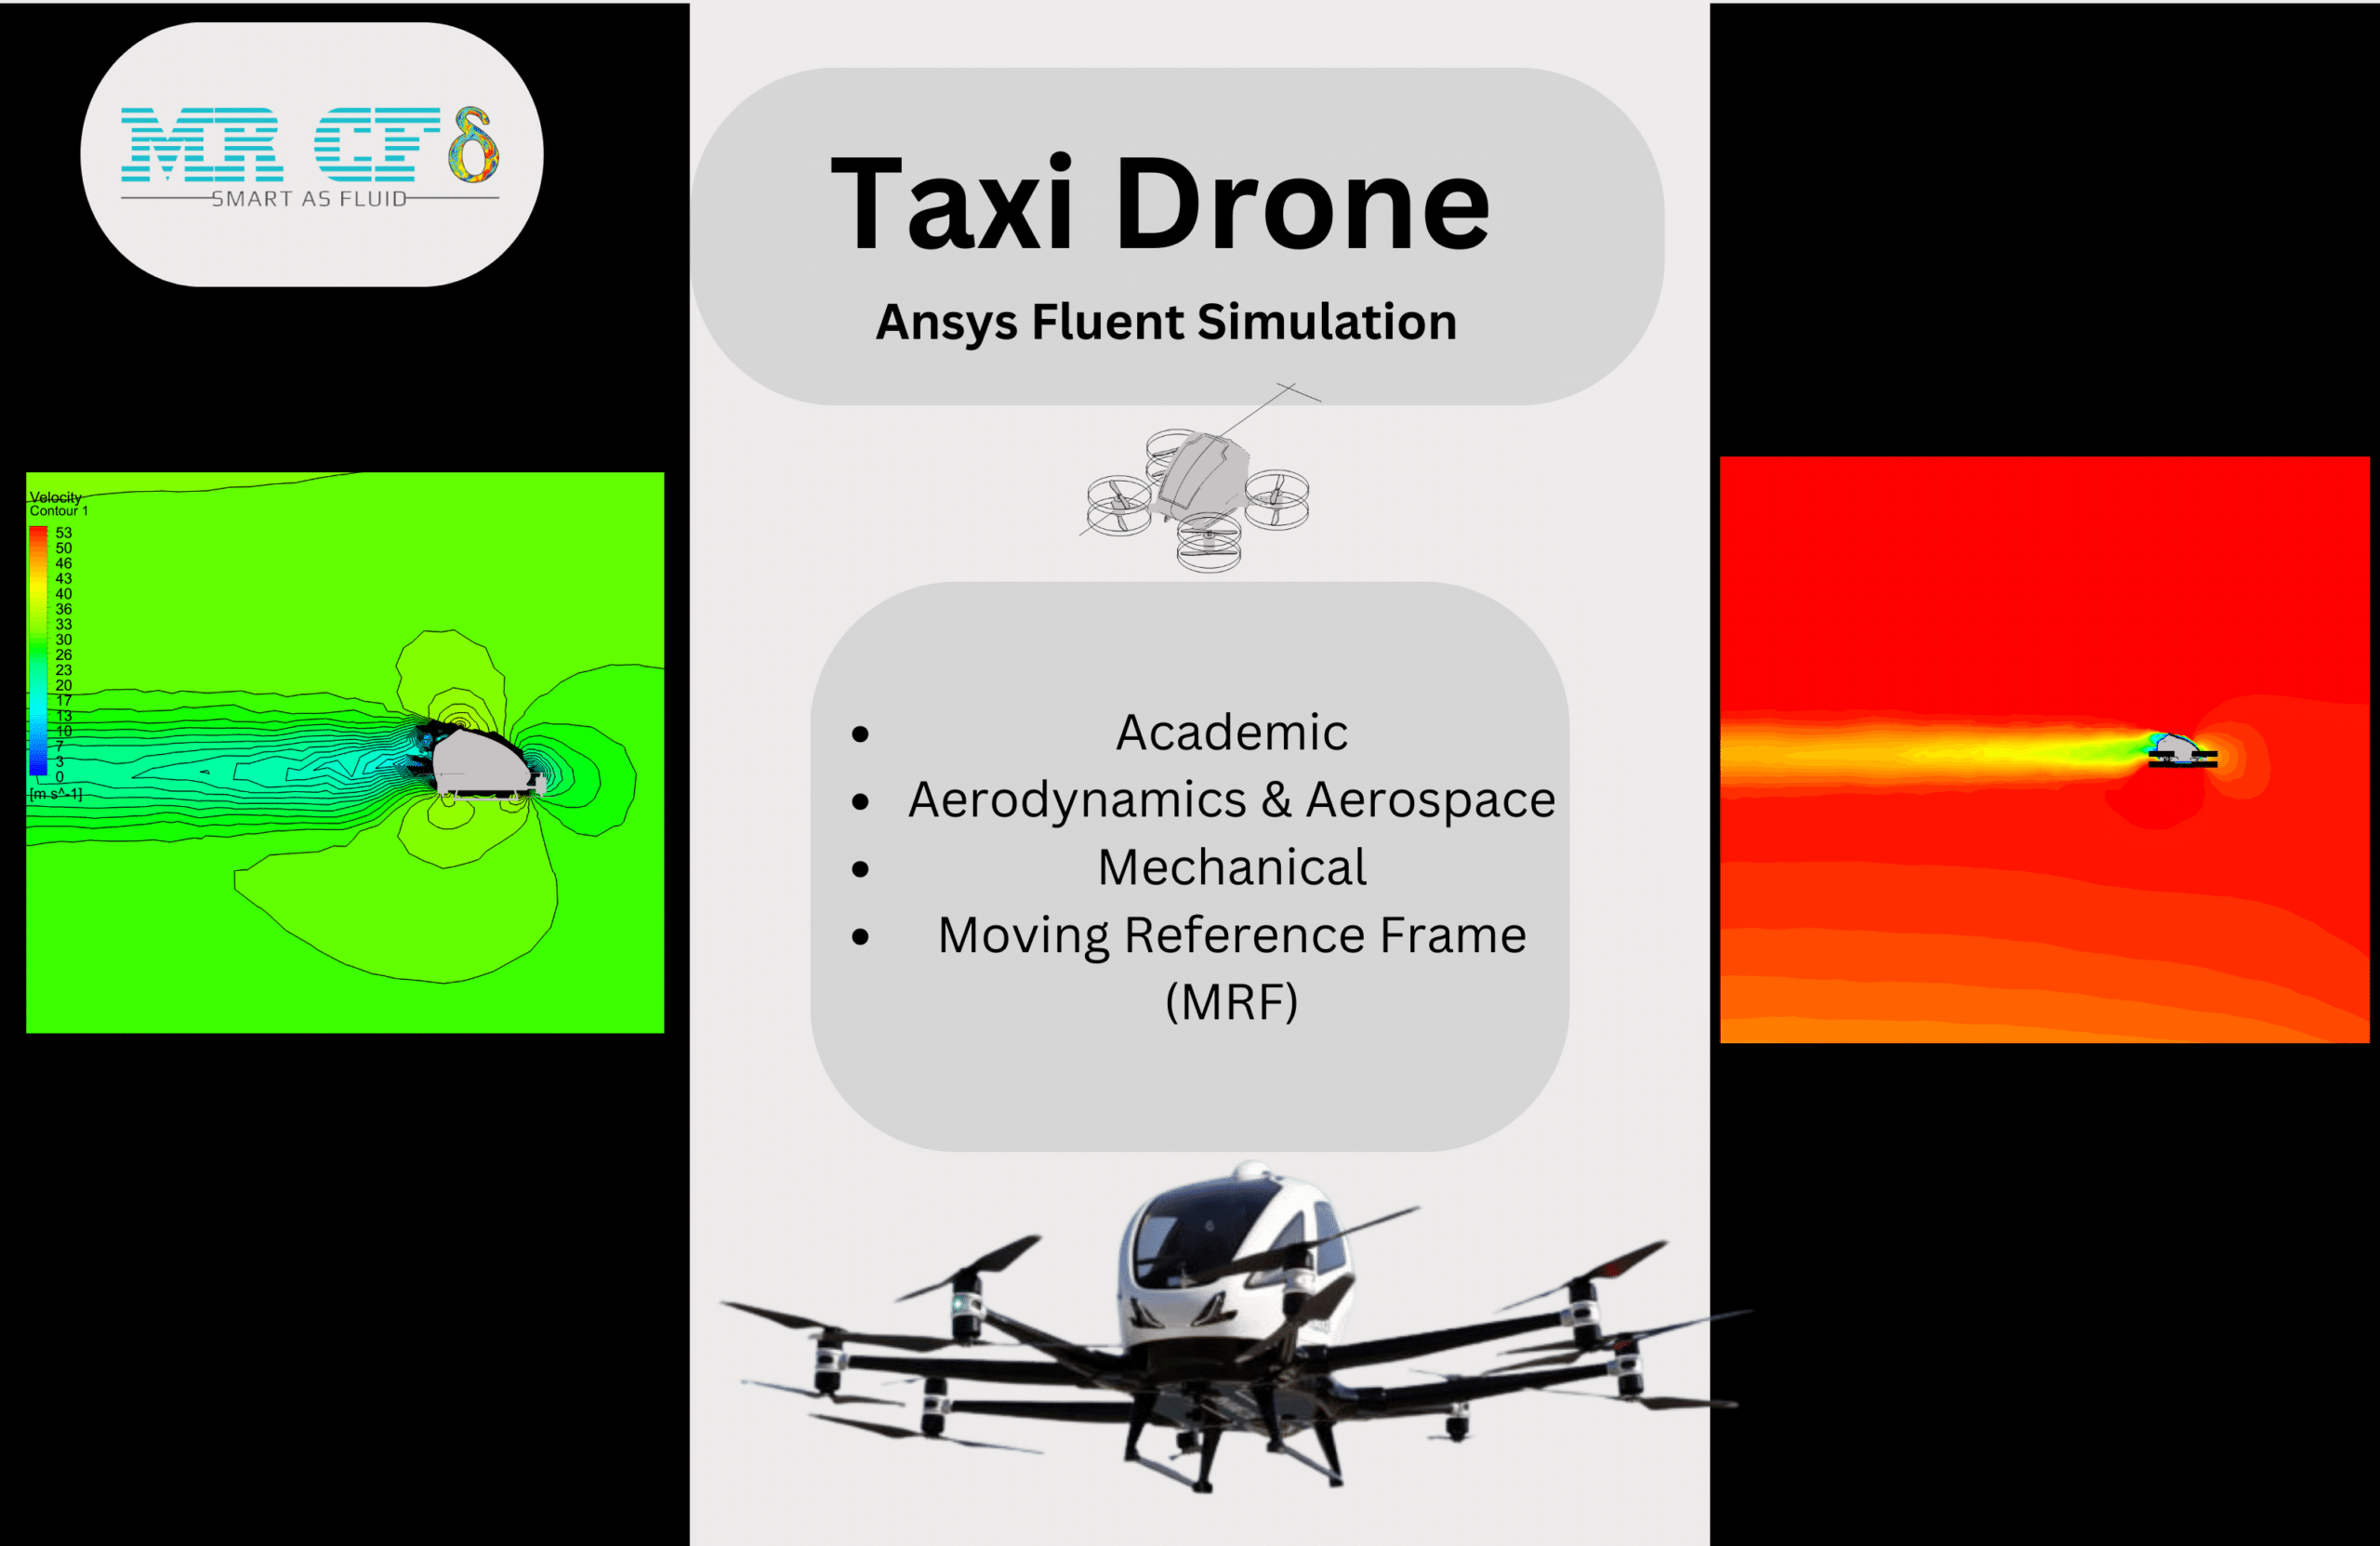
- Taxi Drone Ansys Fluent Simulation involves using advanced CFD software to analyze the aerodynamic performance of urban air mobility vehicles
- The geometry of the taxi drone was designed using ANSYS SpaceClaim , The mesh was generated using ANSYS Meshing, resulting in a total of 2,829,977 elements
- The velocity inlet was set to 30 m/s with an angle of attack of 5 degrees. The rotational speed of the blades was configured with MRF method at 5000 RPM, with the upper and lower blades rotating in opposite directions.
To Order Your Project or benefit from a CFD consultation, contact our experts via email (info@mr-cfd.com), online support tab, or WhatsApp at +44 7443 197273.
There are some Free Products to check our service quality.
If you want the training video in another language instead of English, ask it via info@mr-cfd.com after you buy the product.
Description
Geometry and Mesh
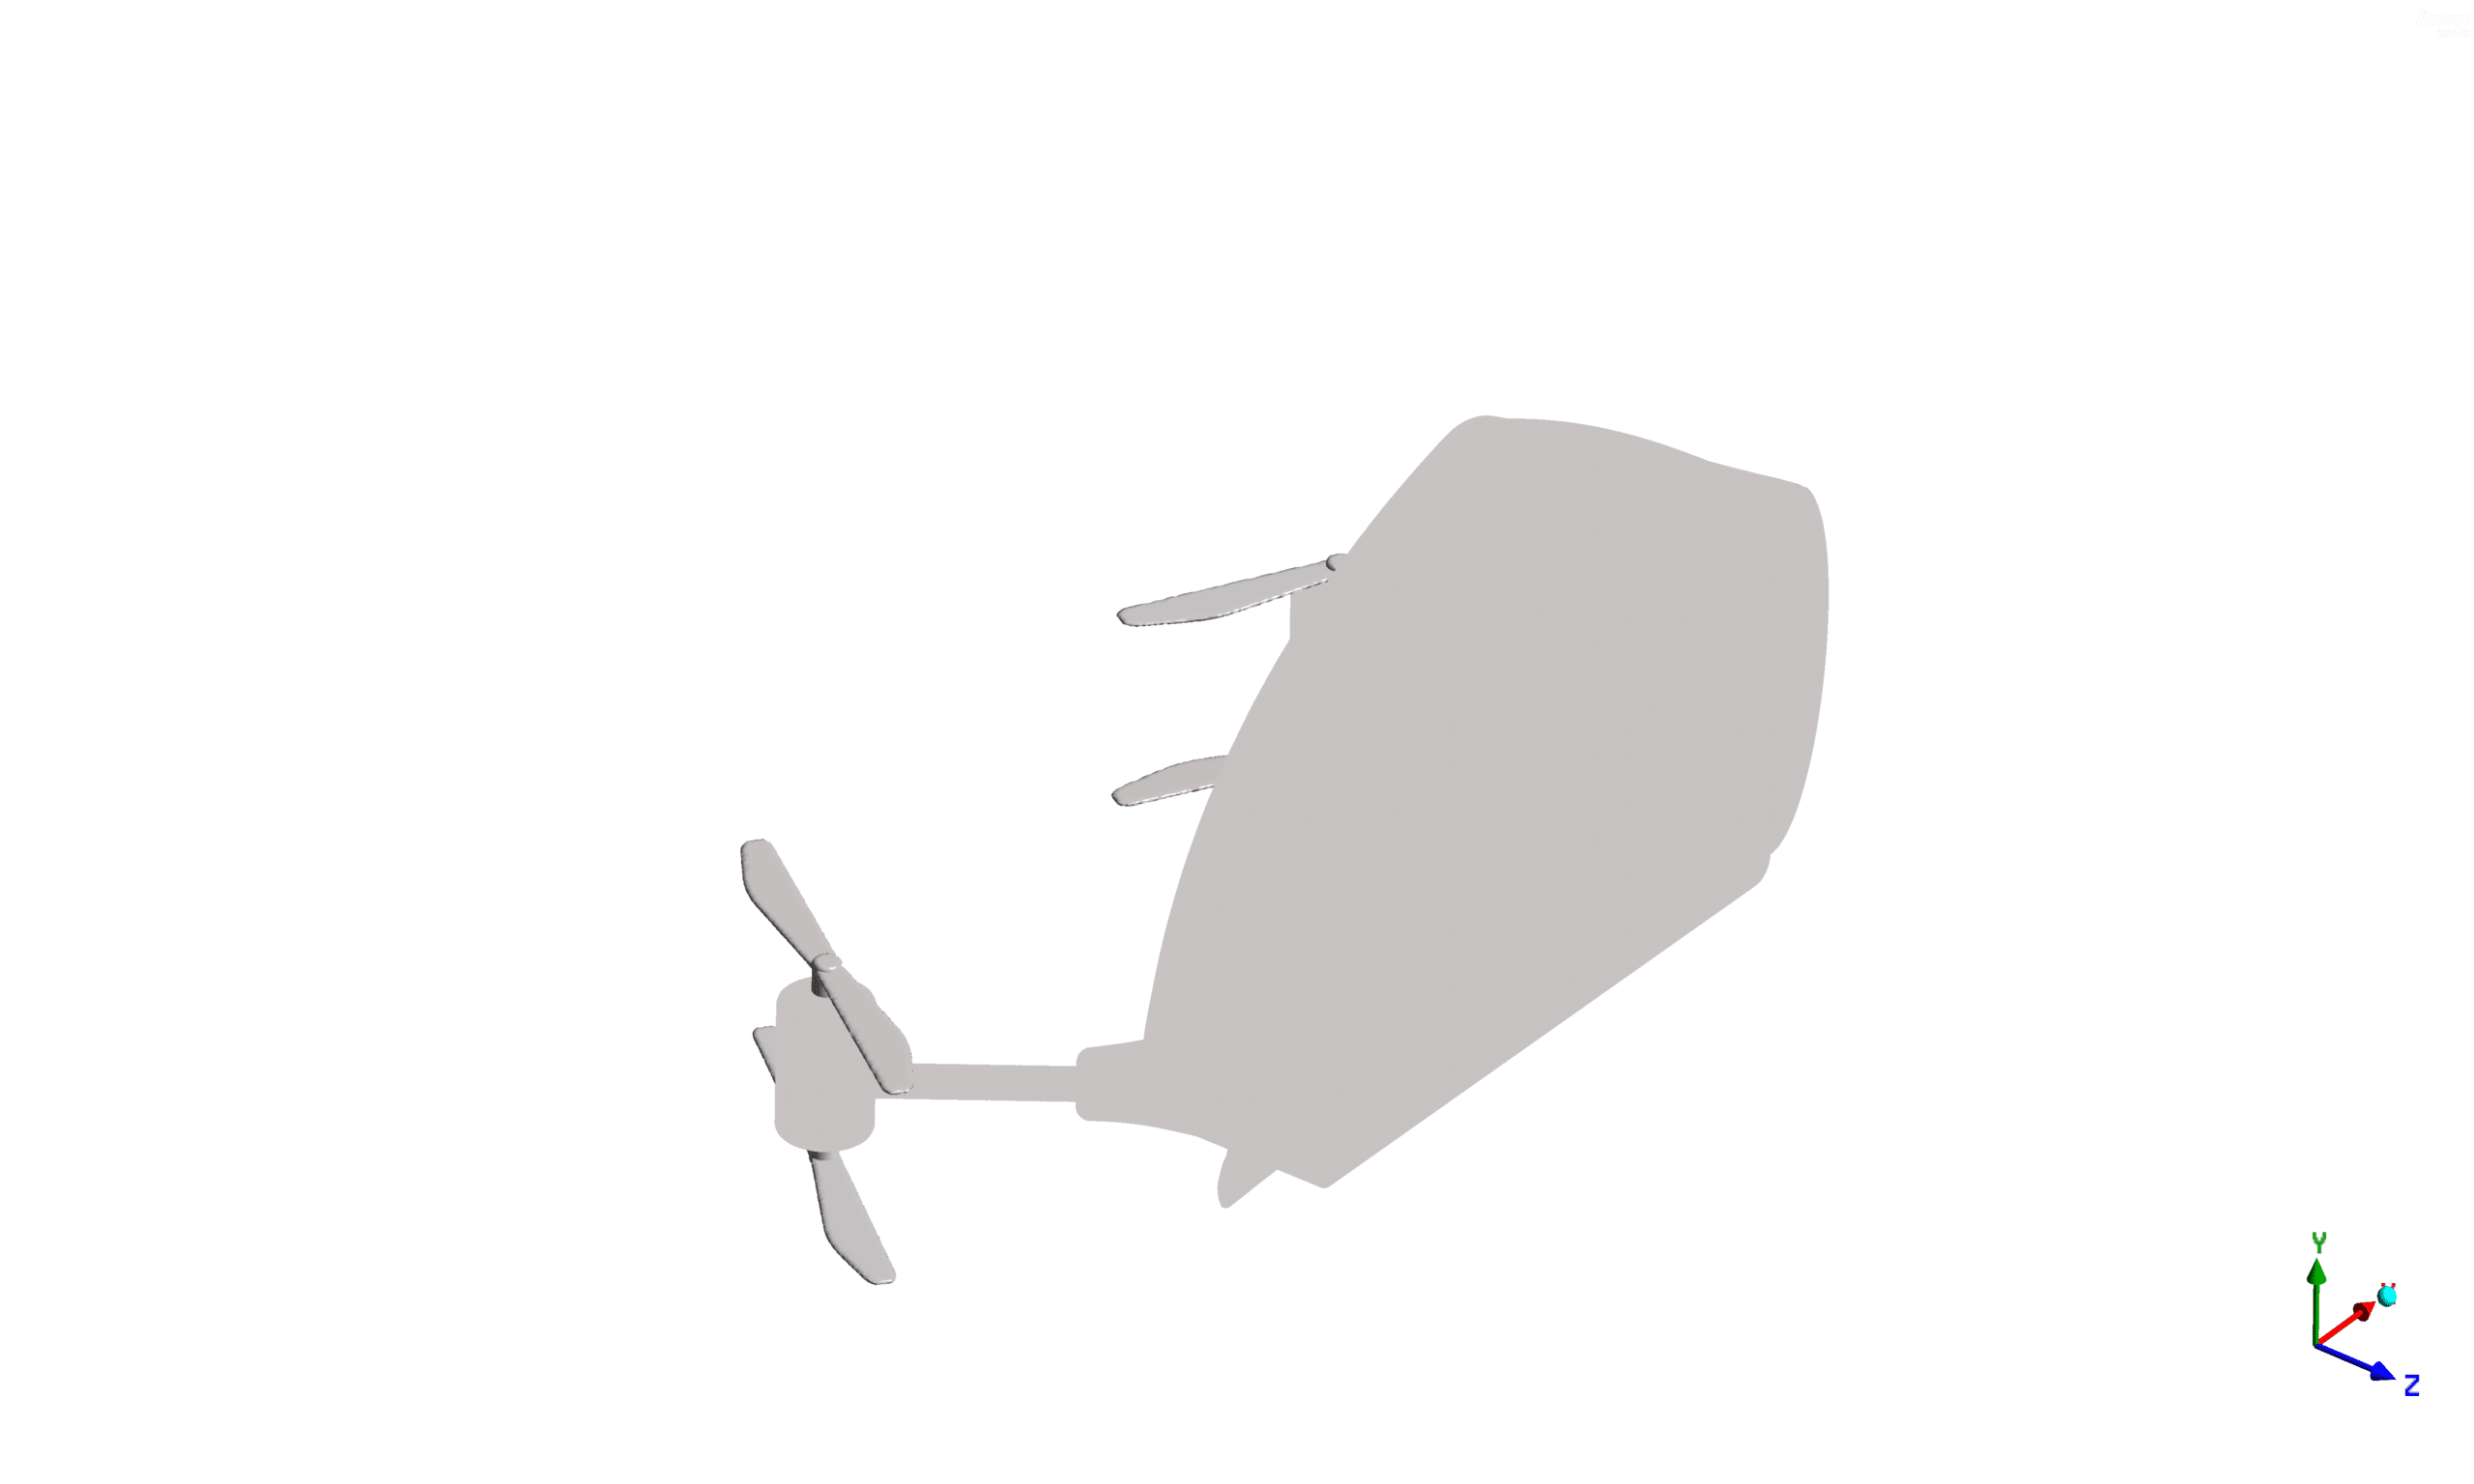
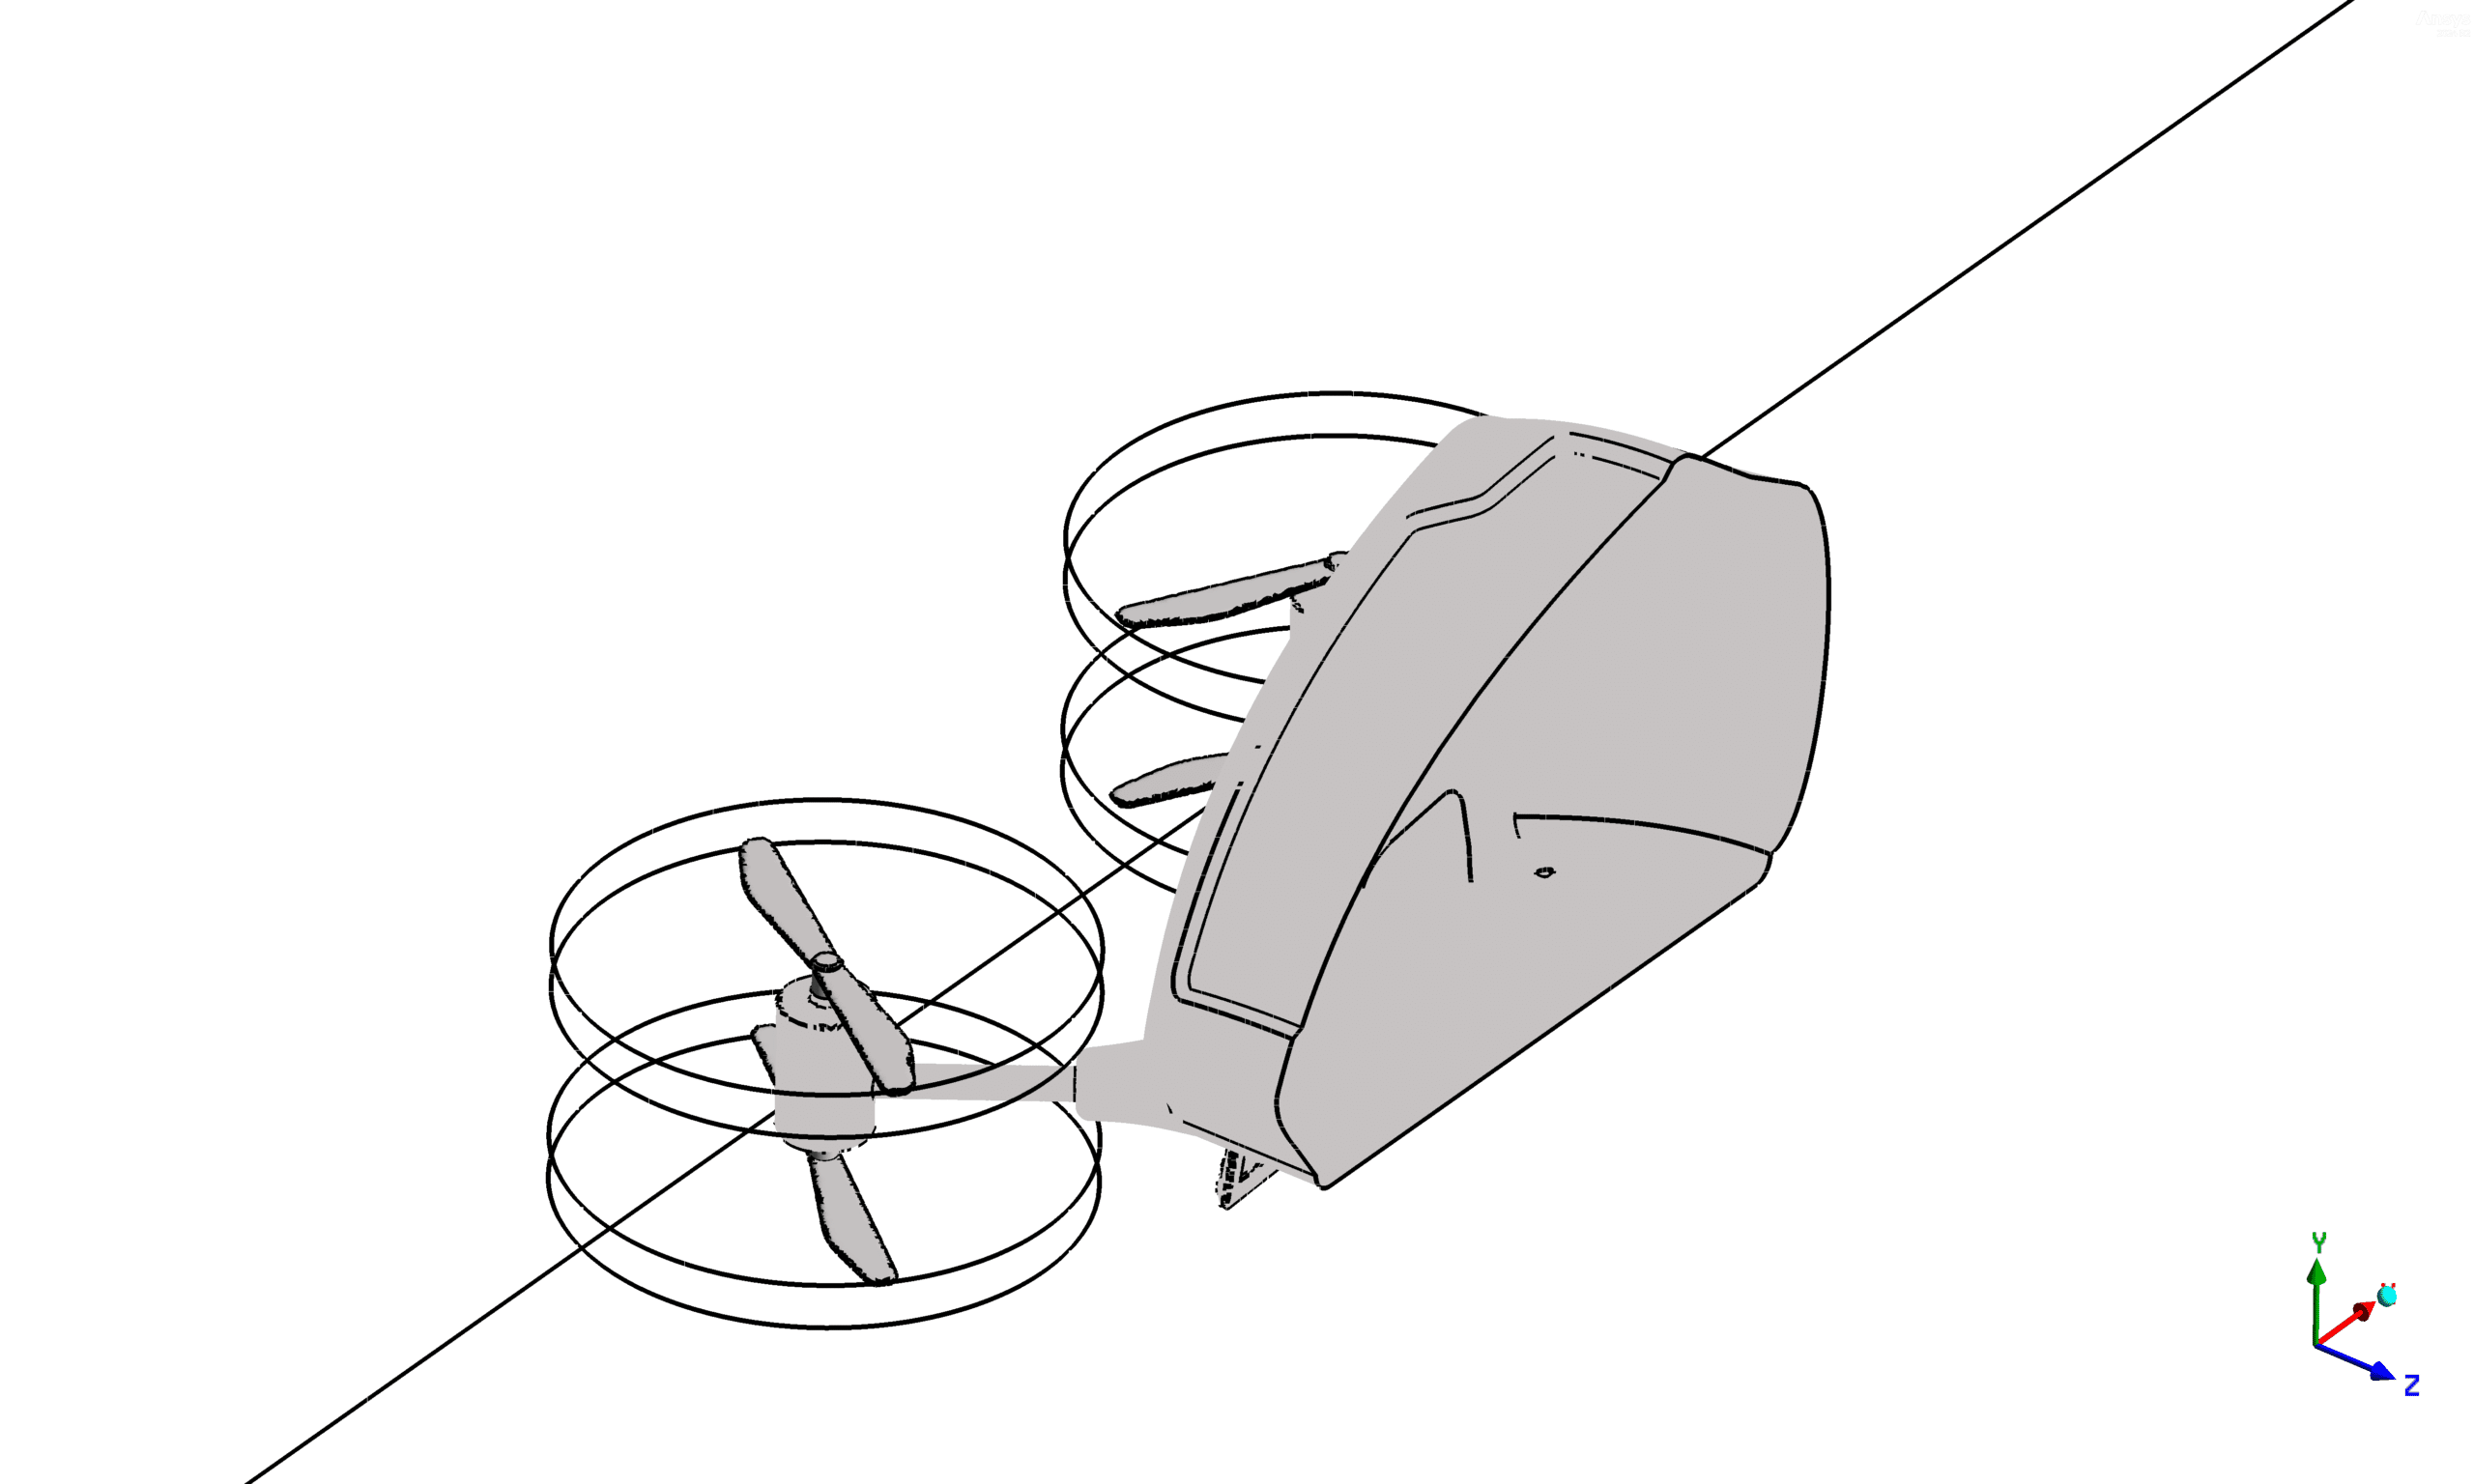
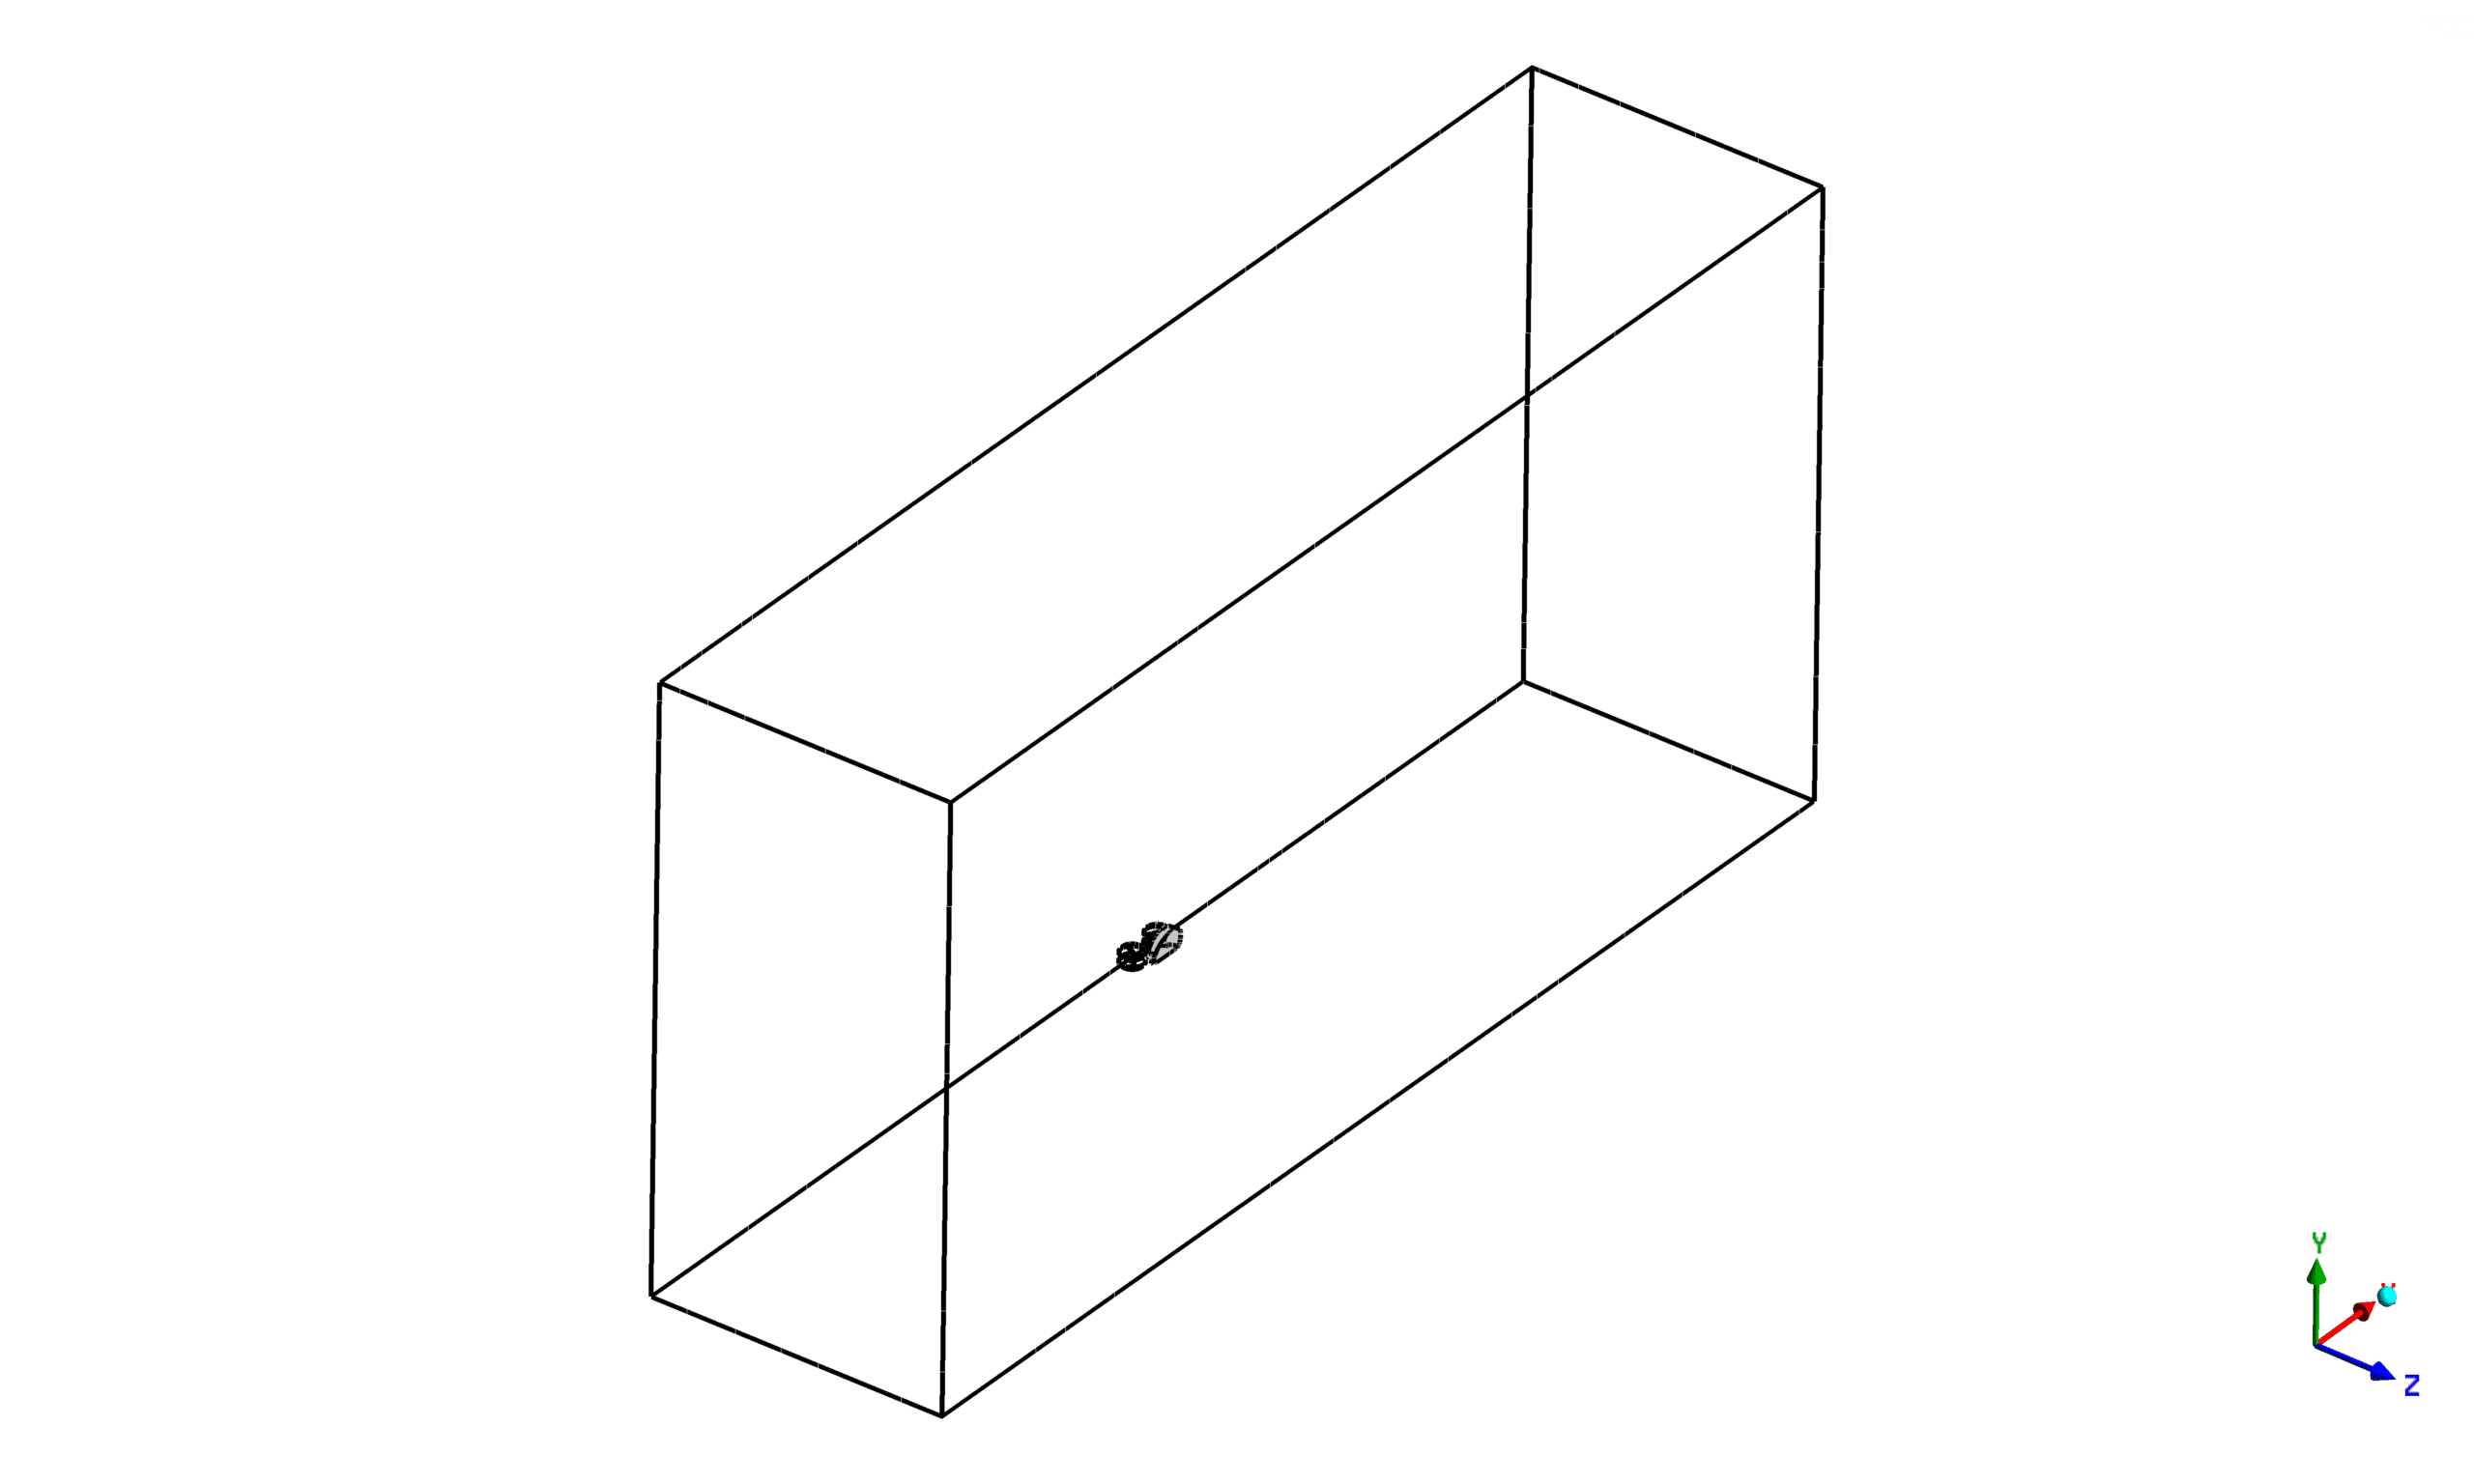
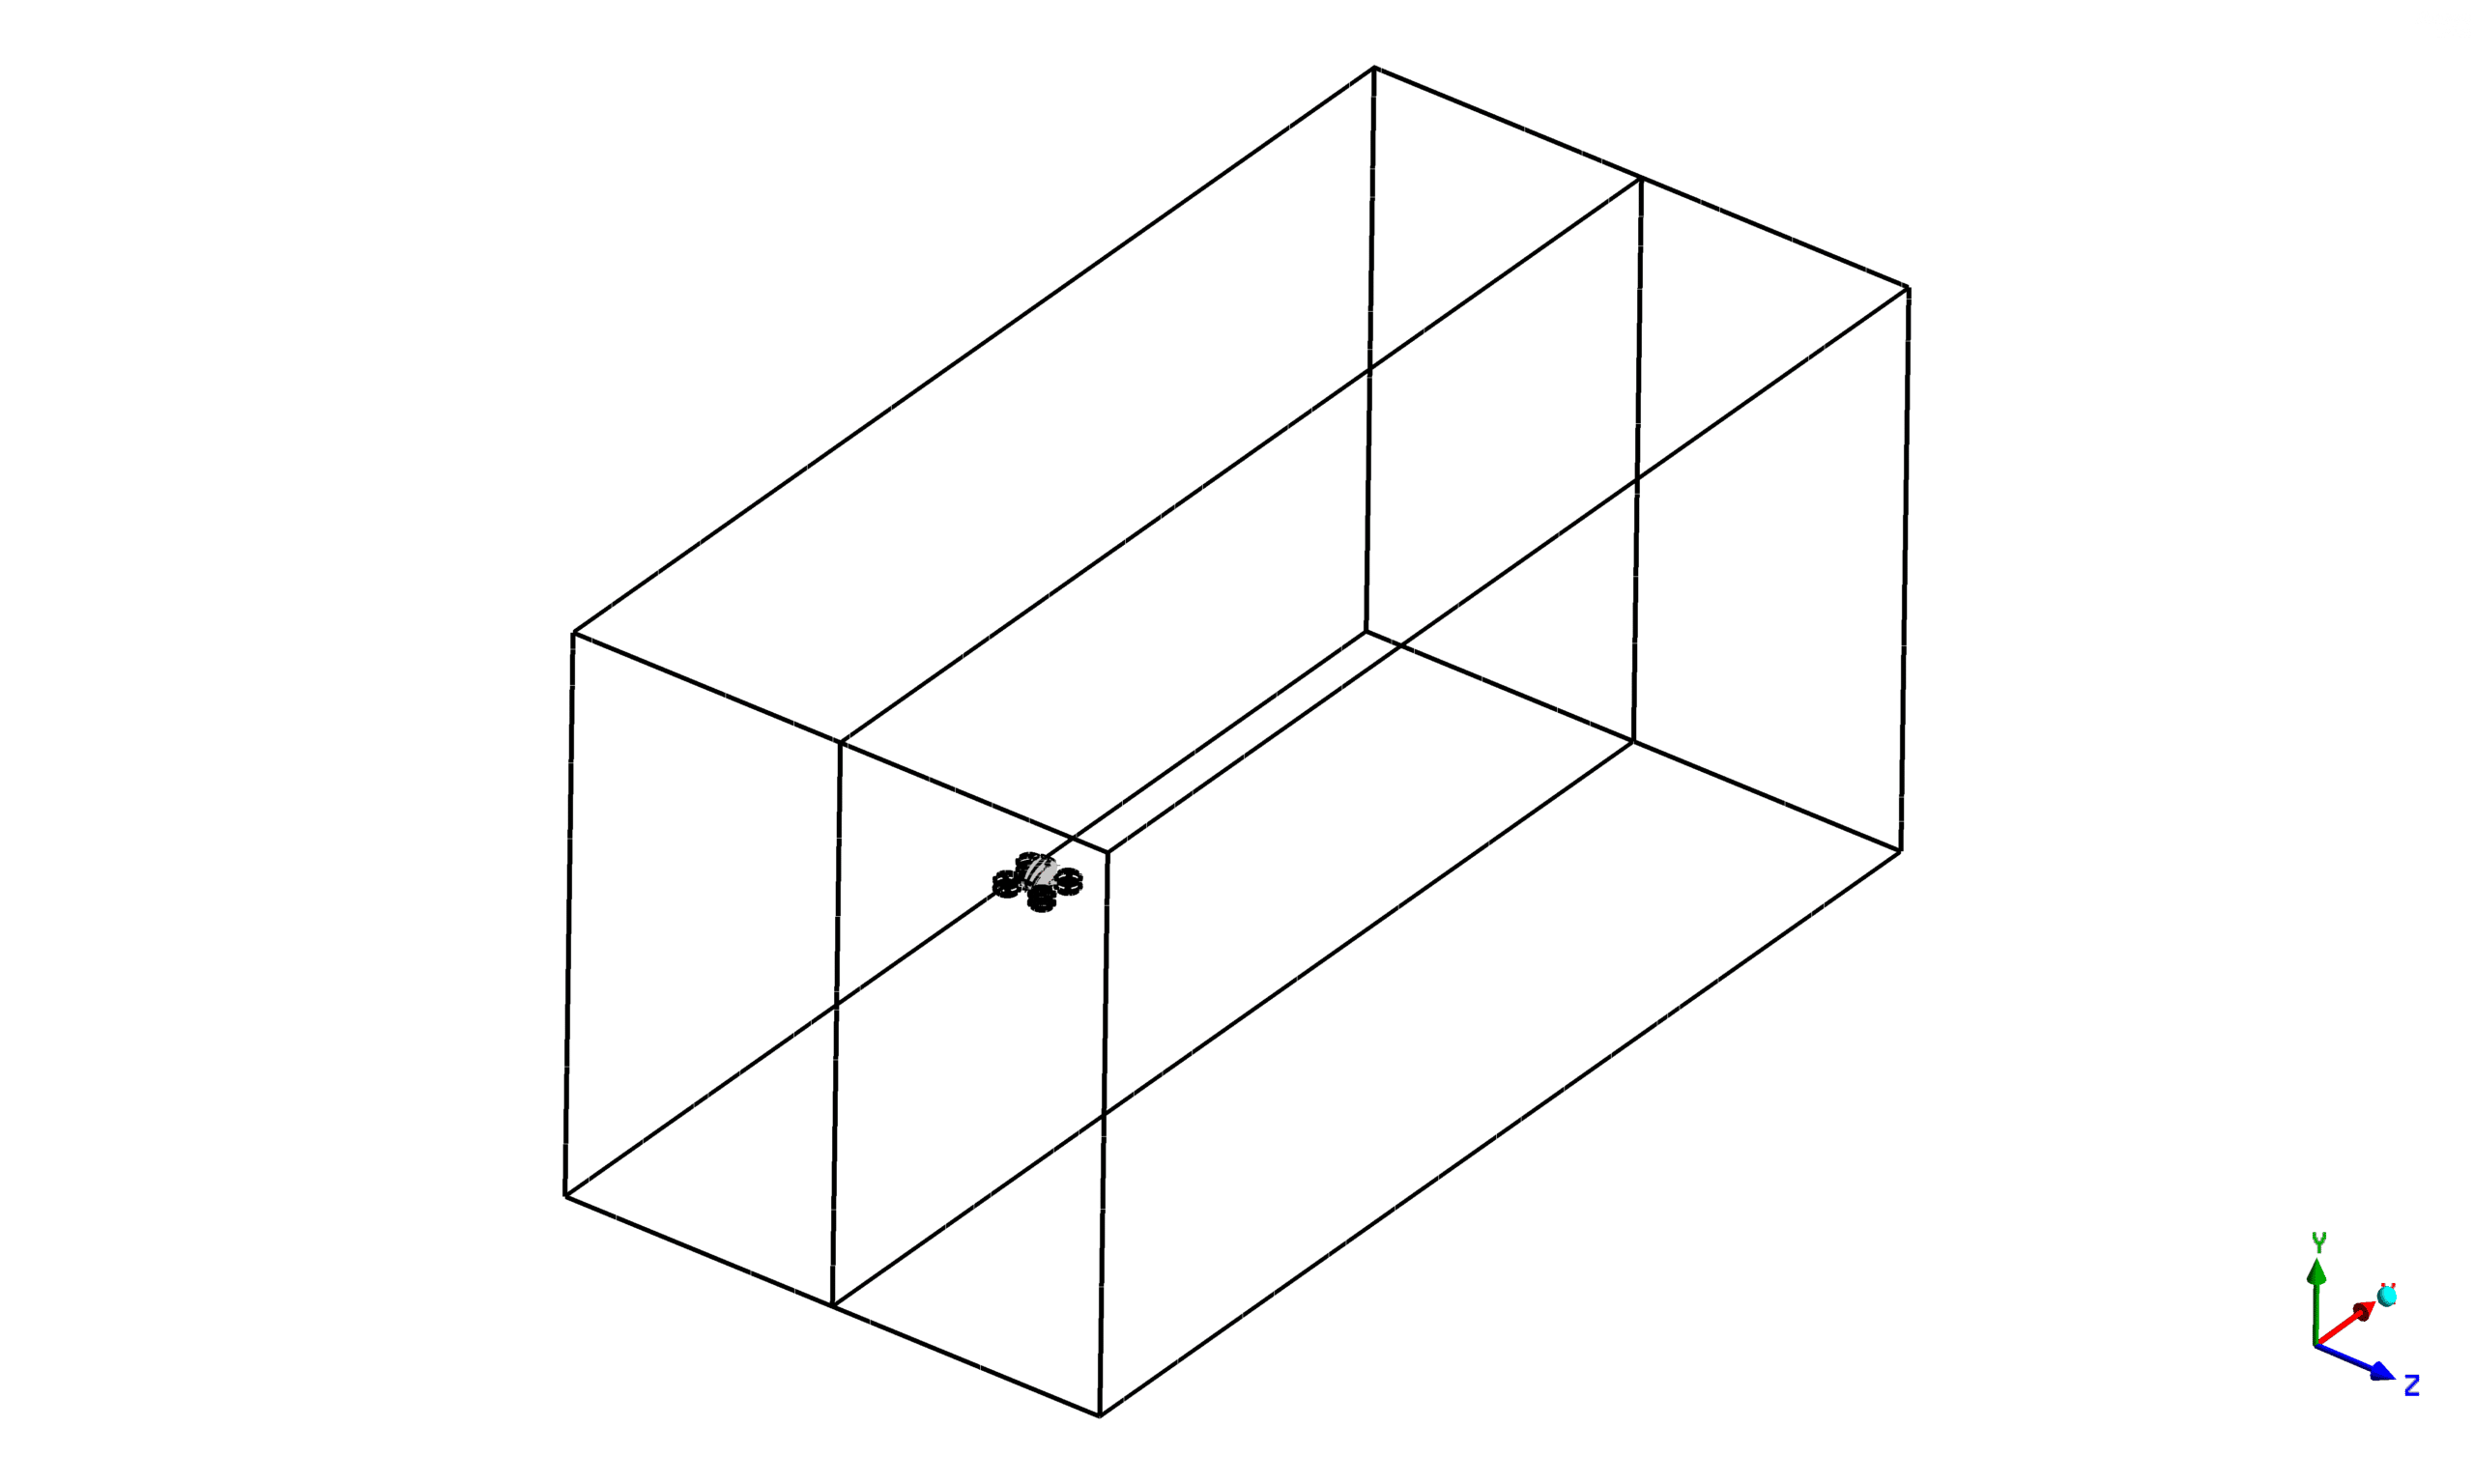
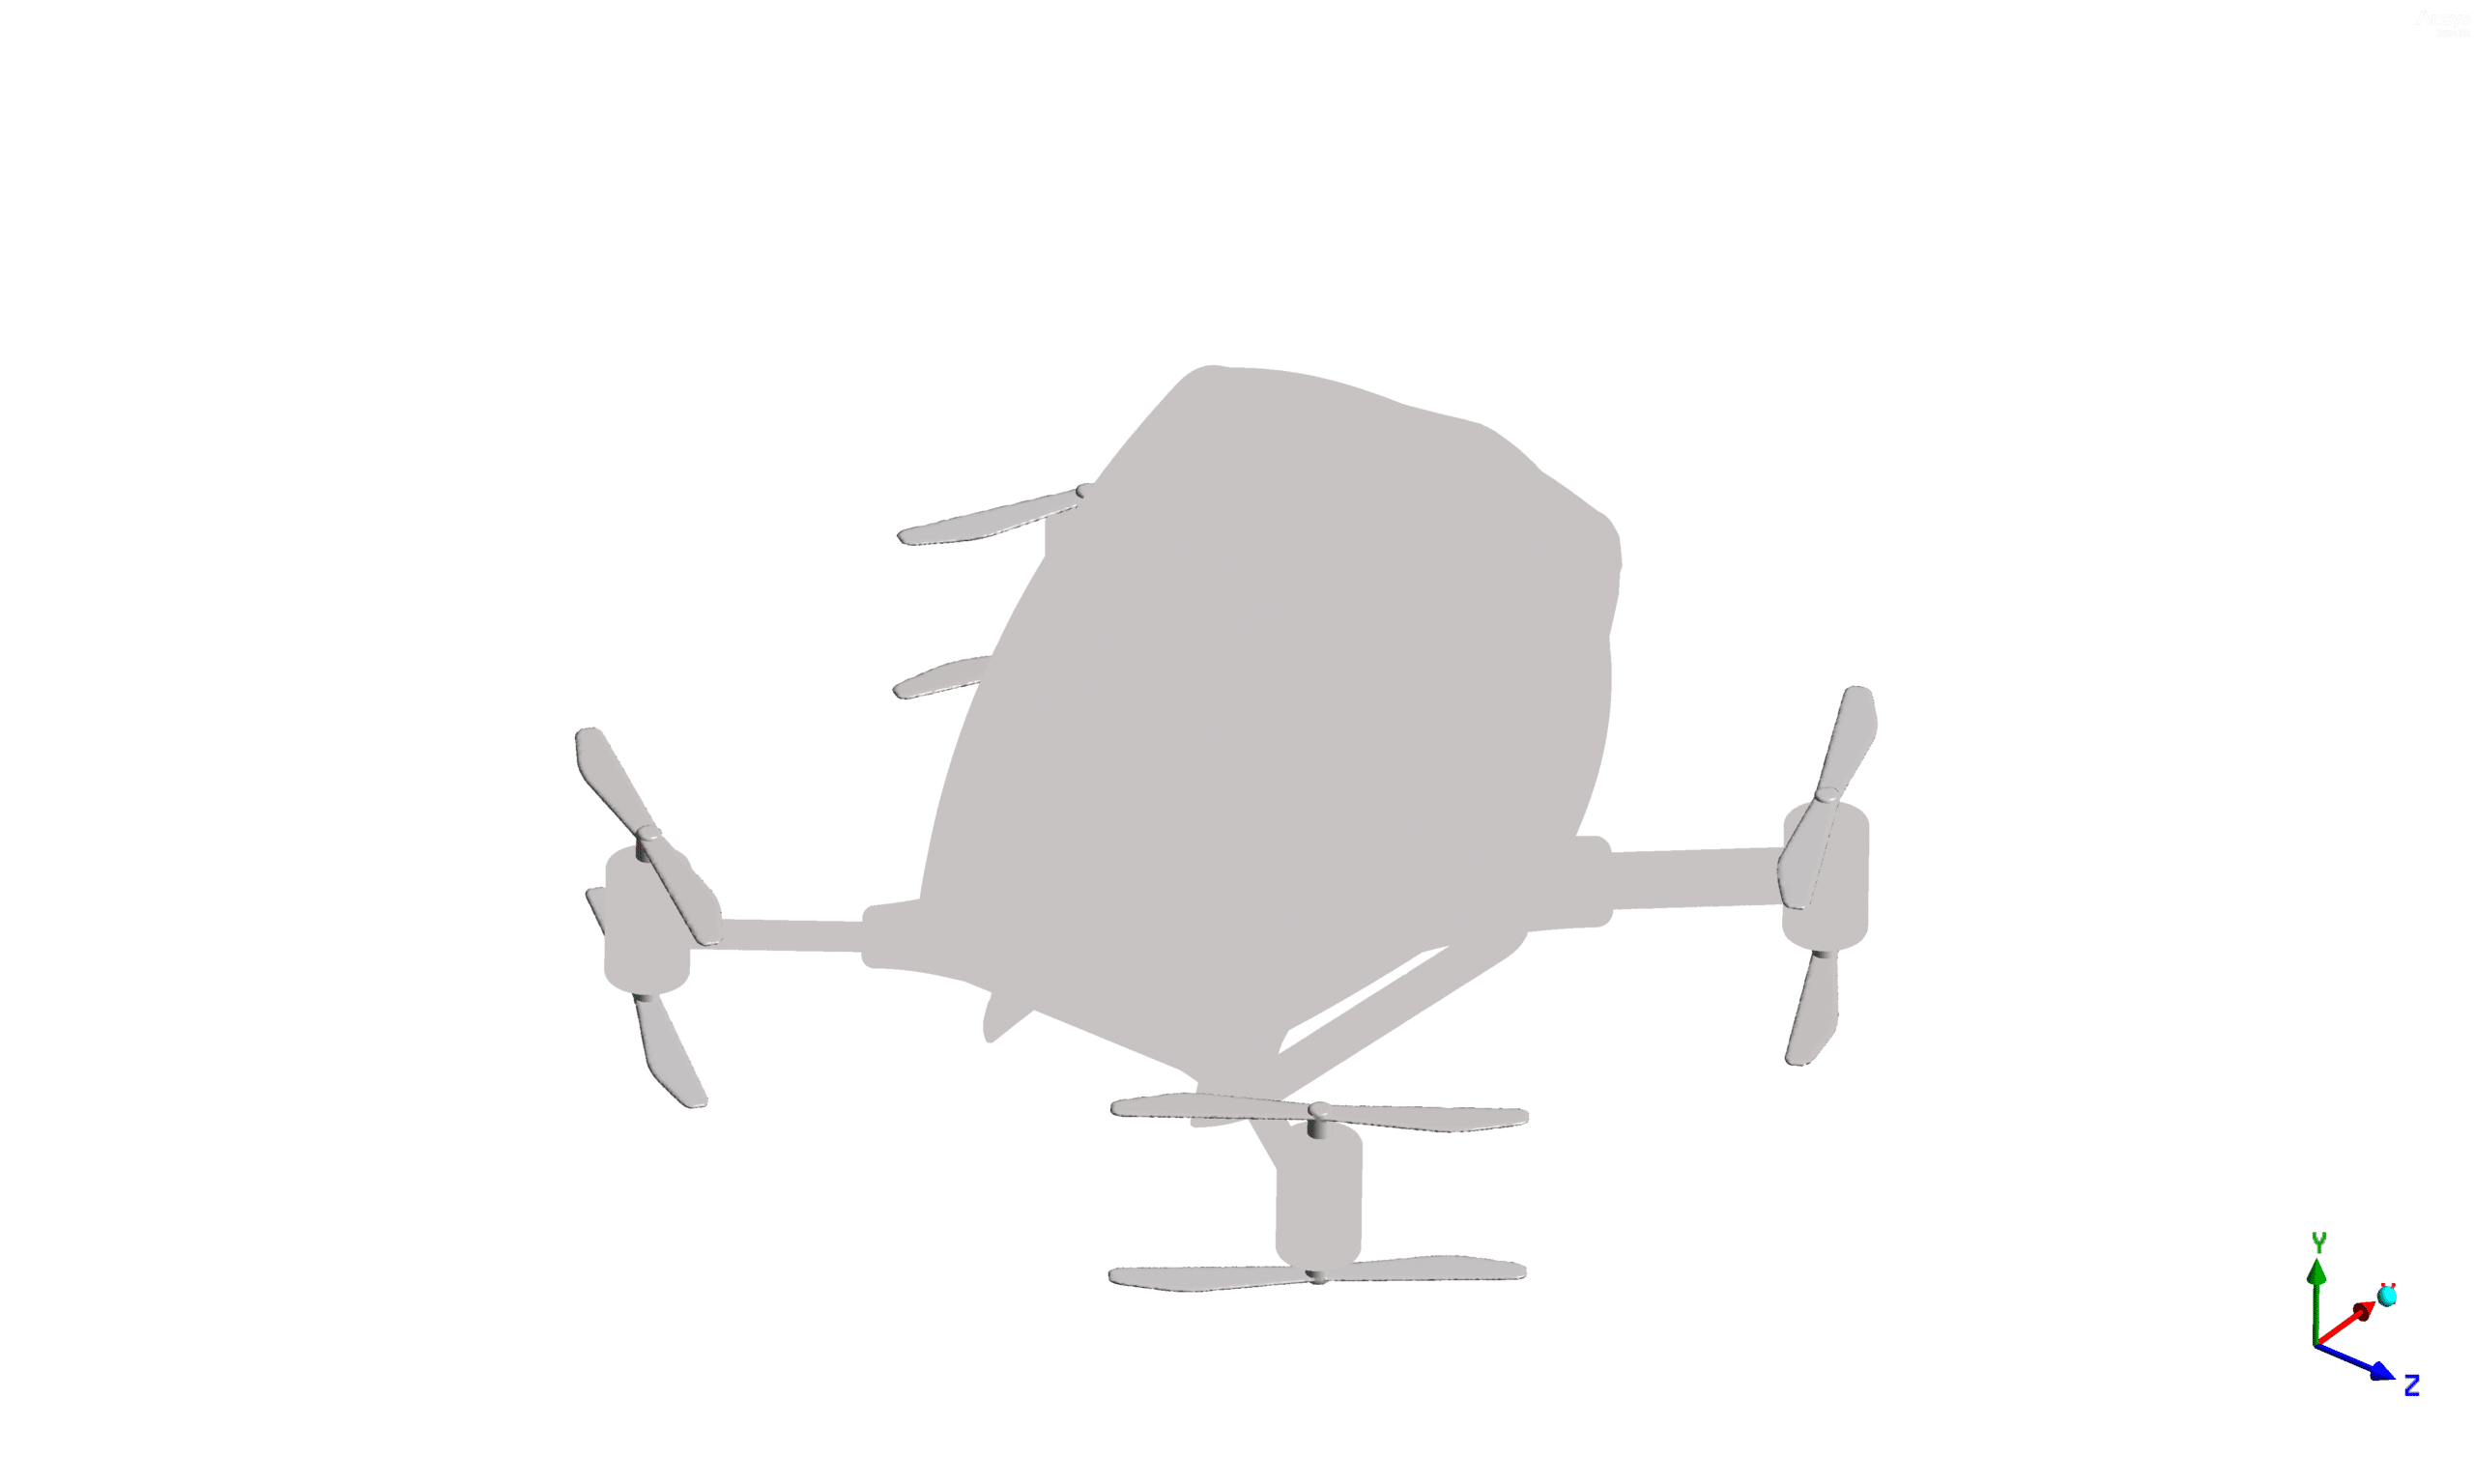
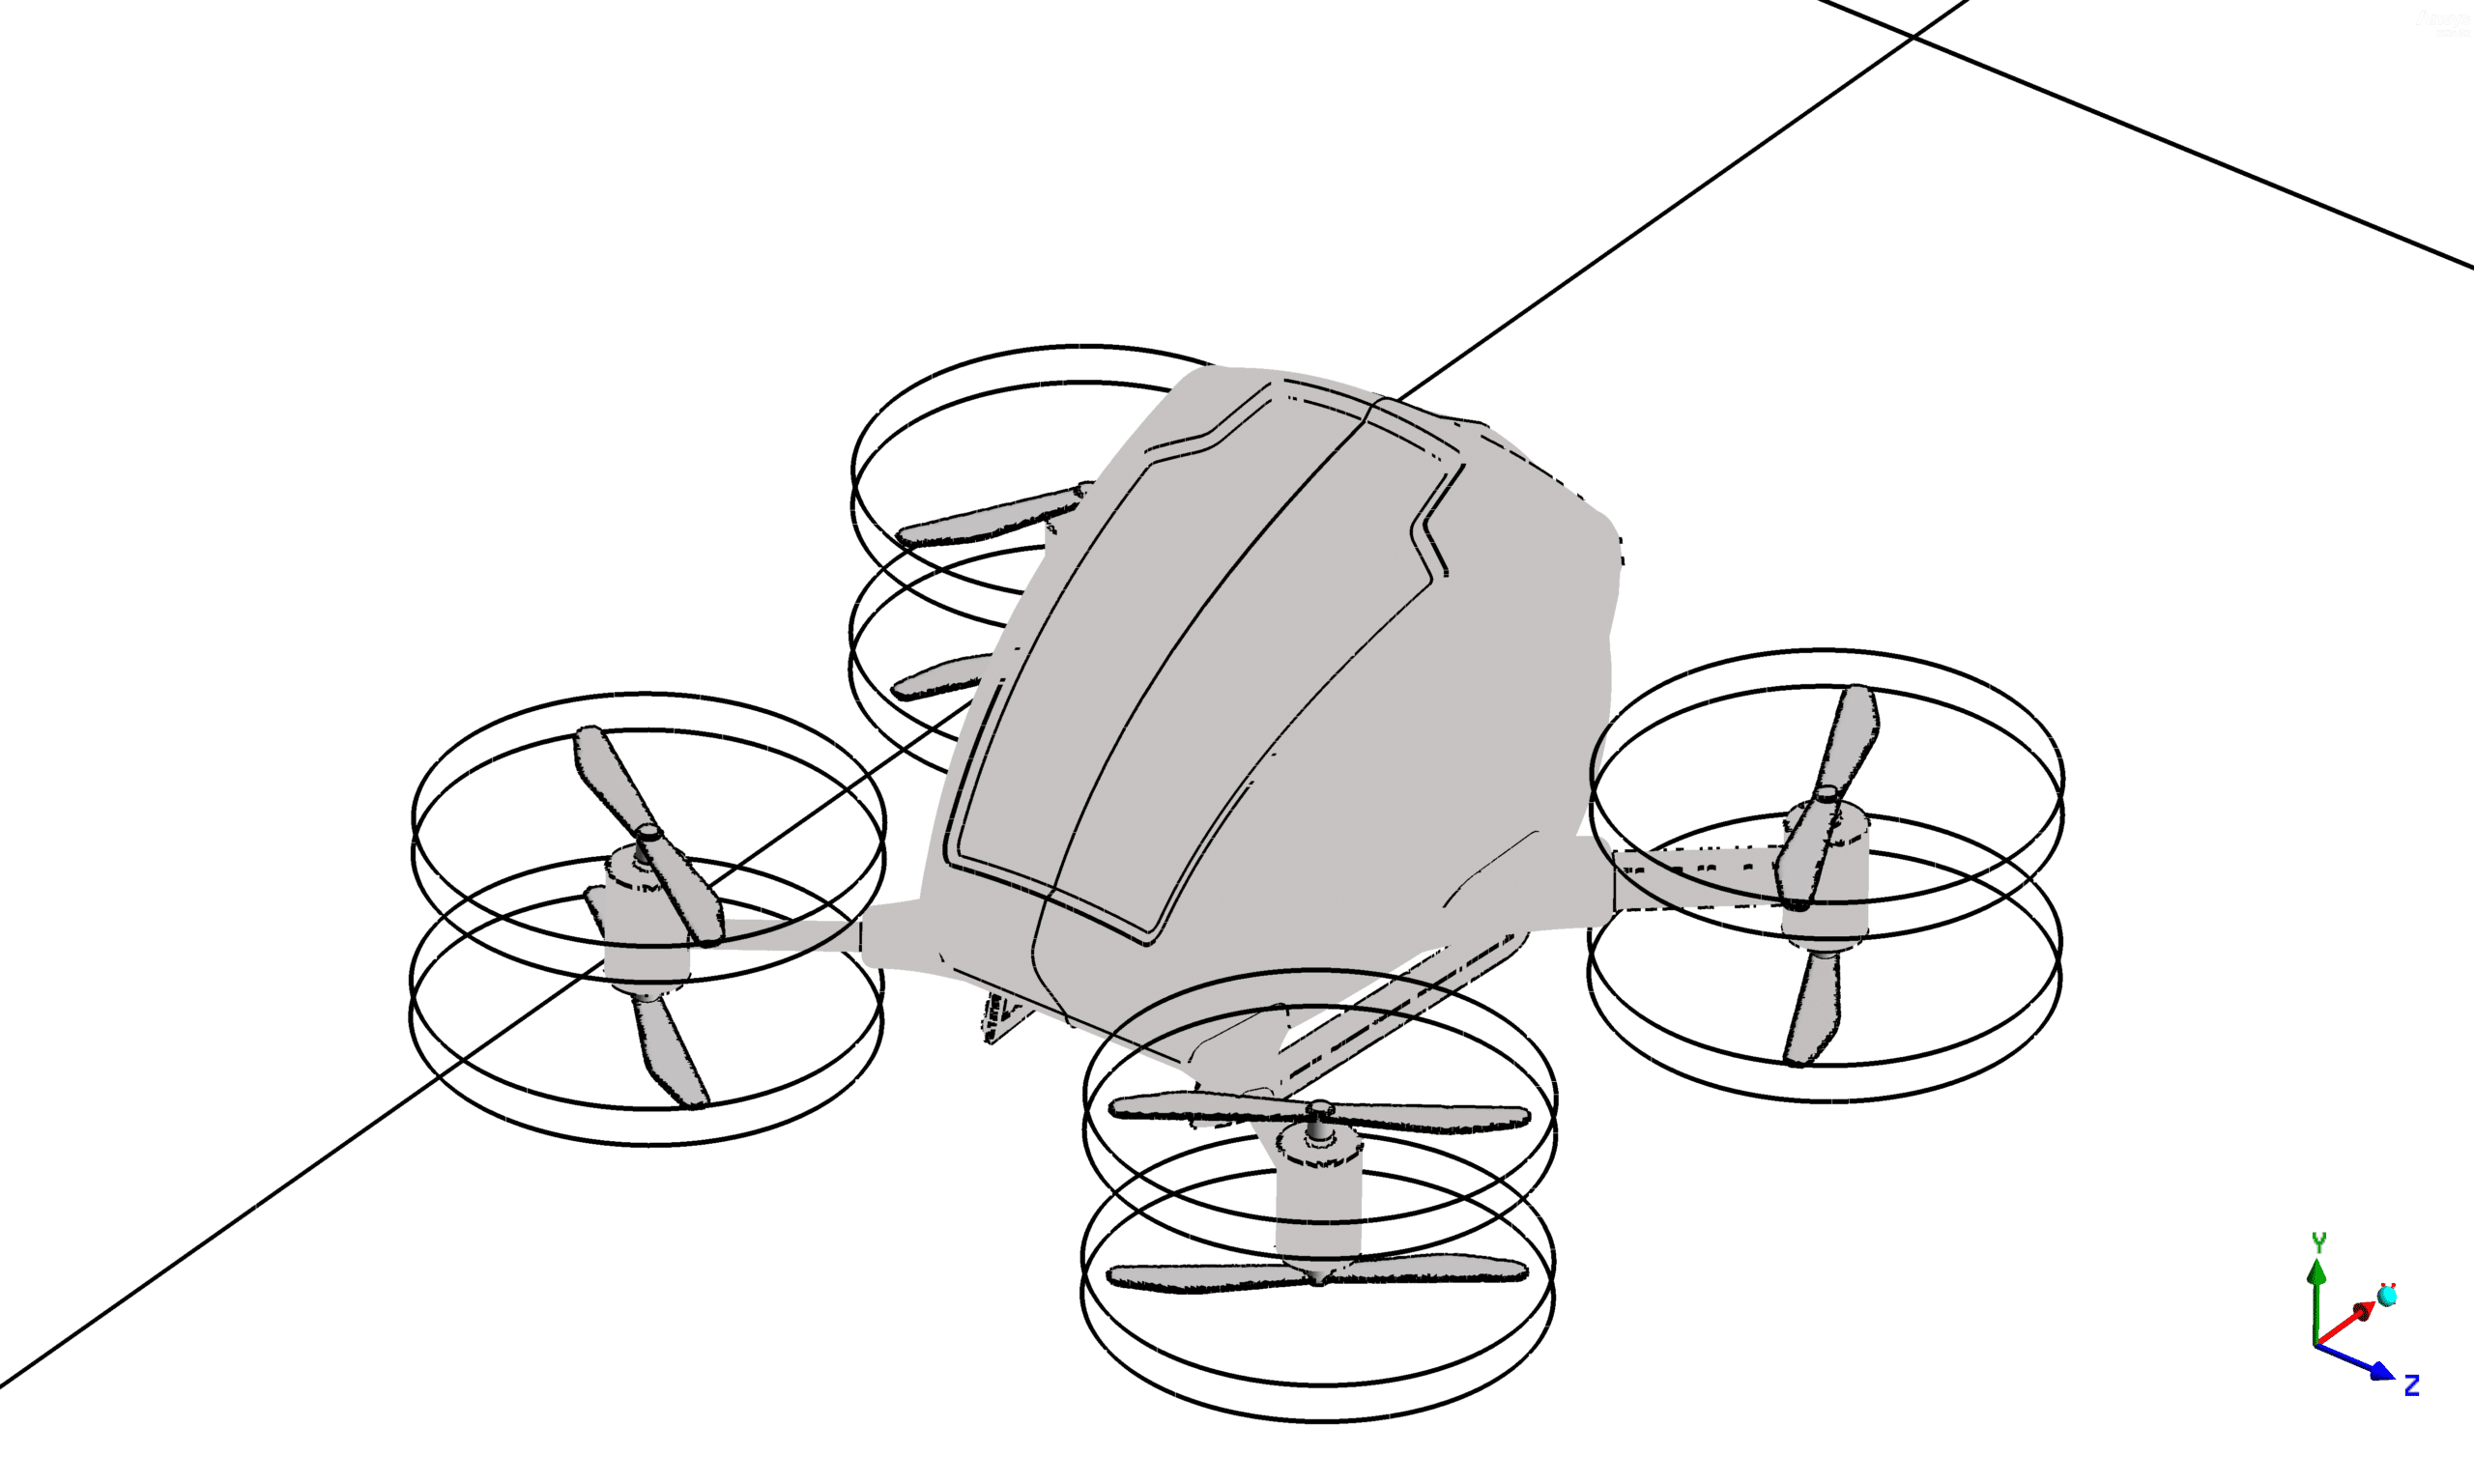
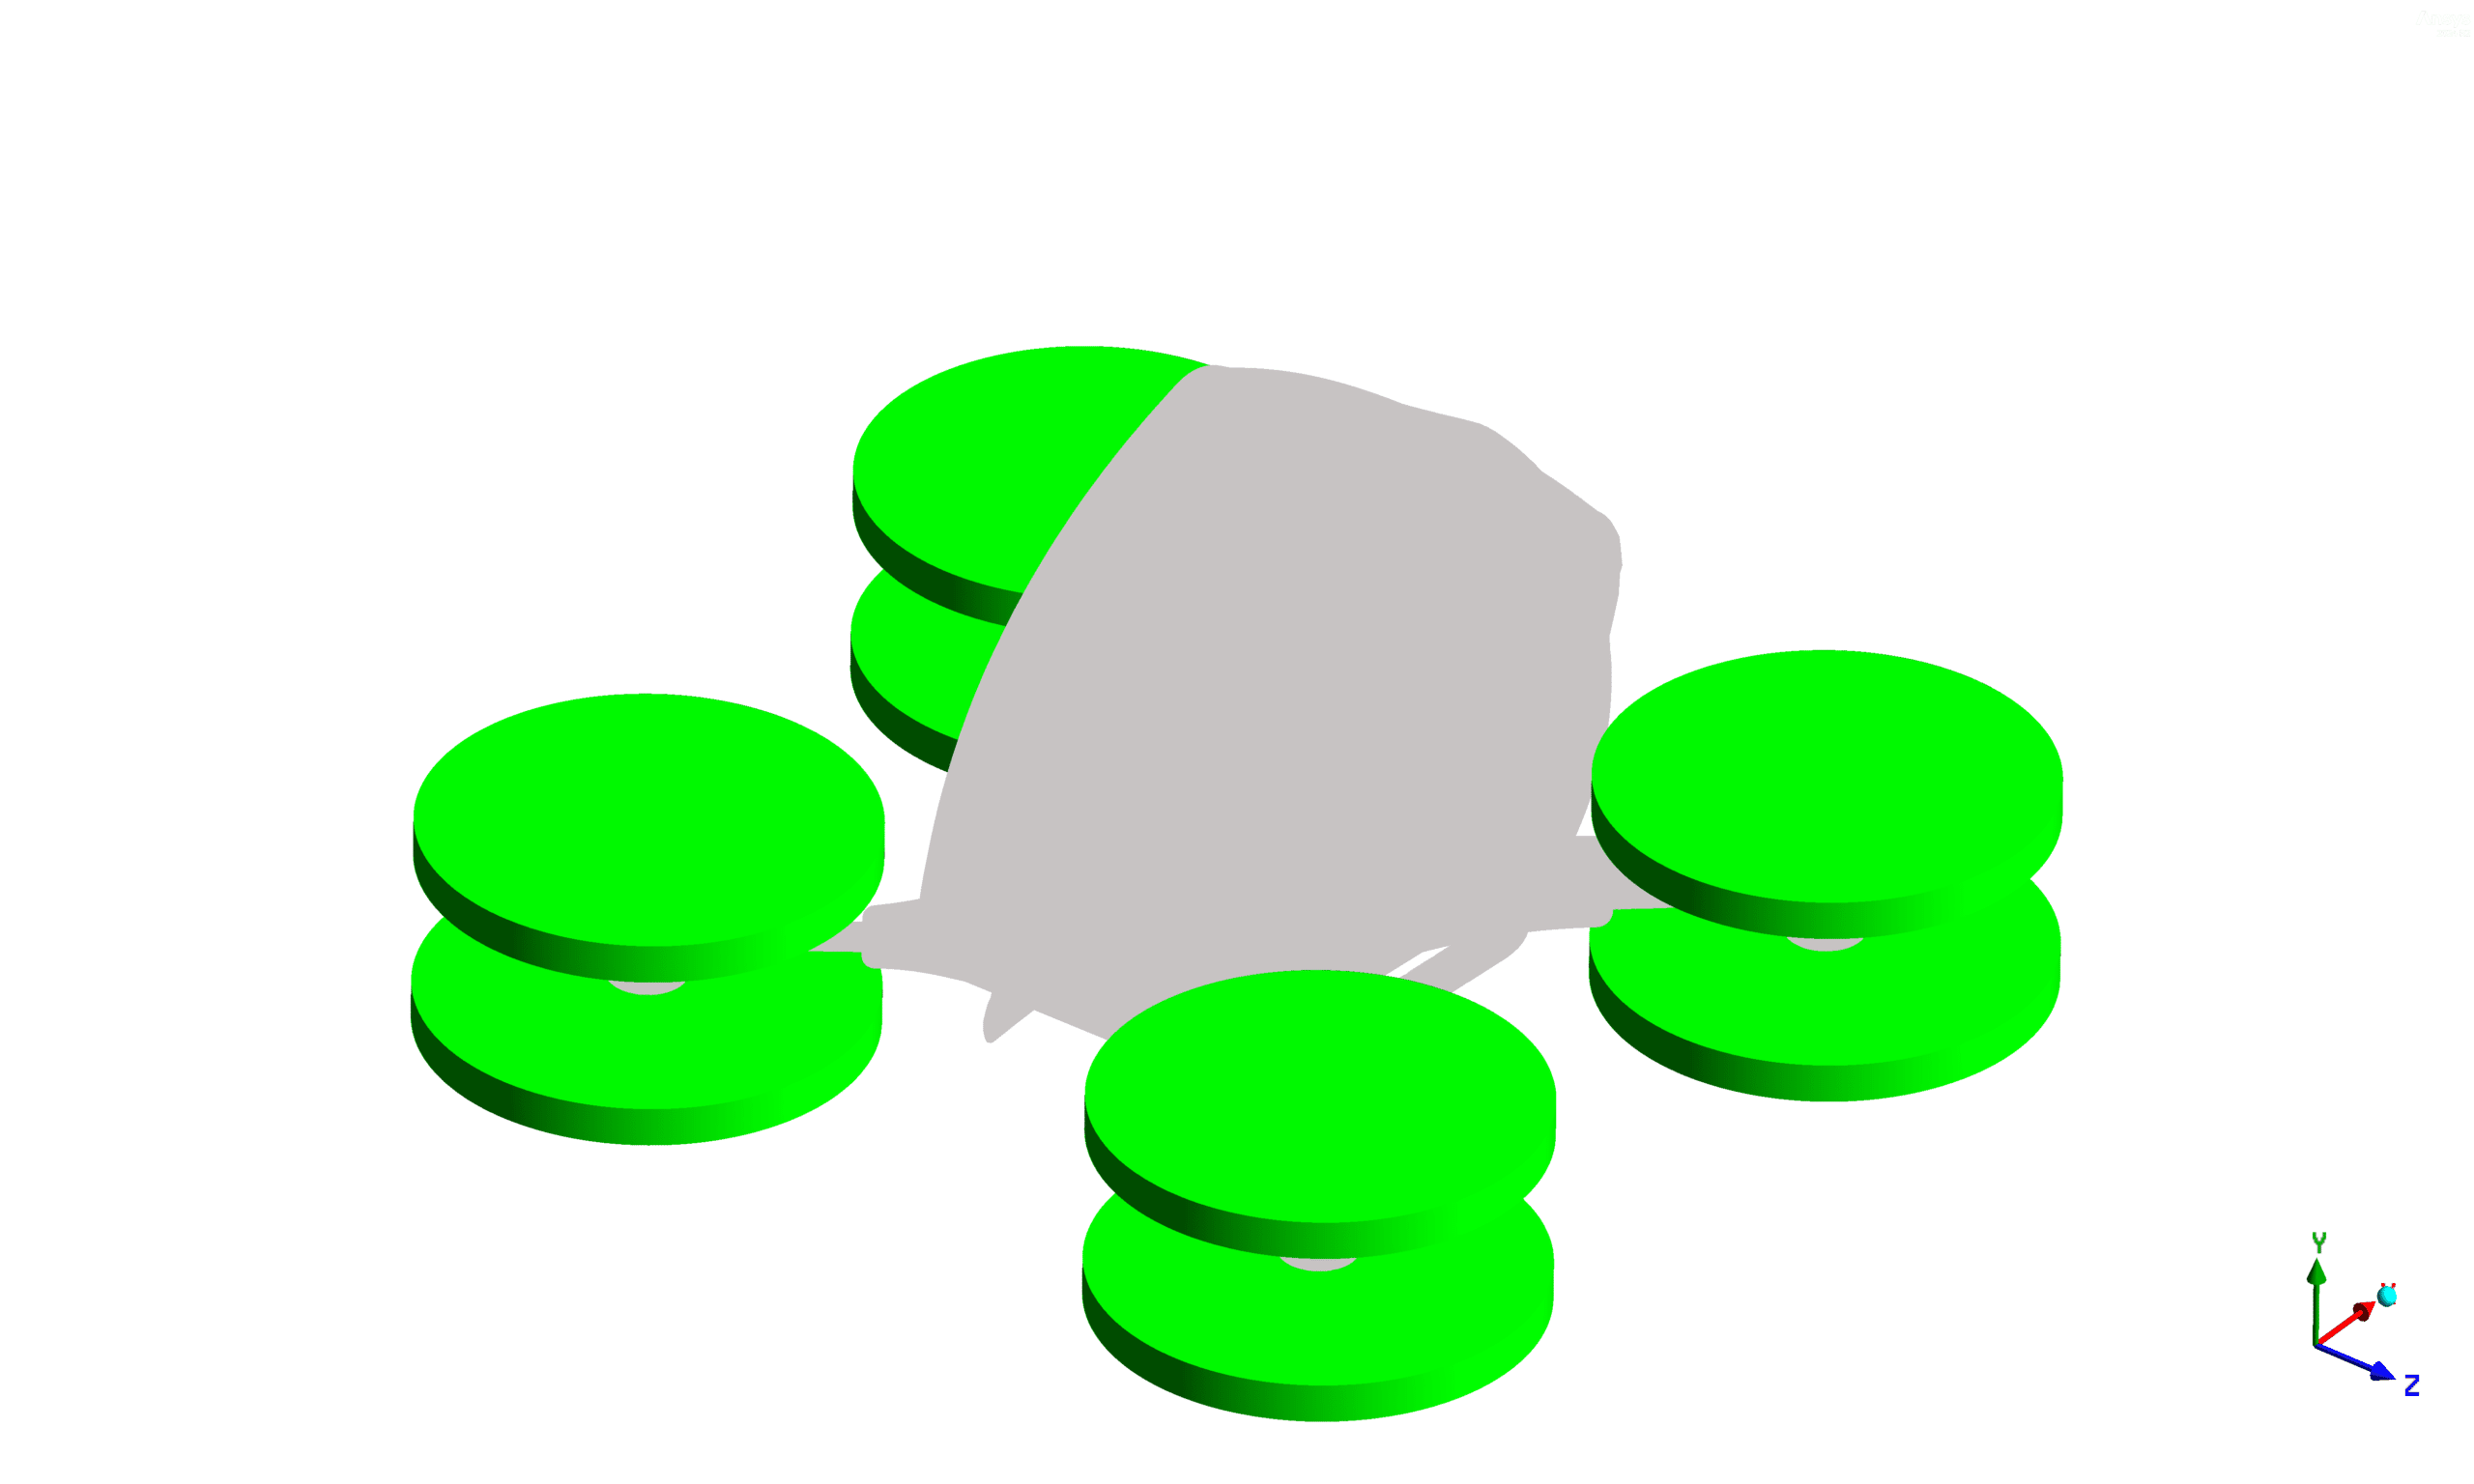
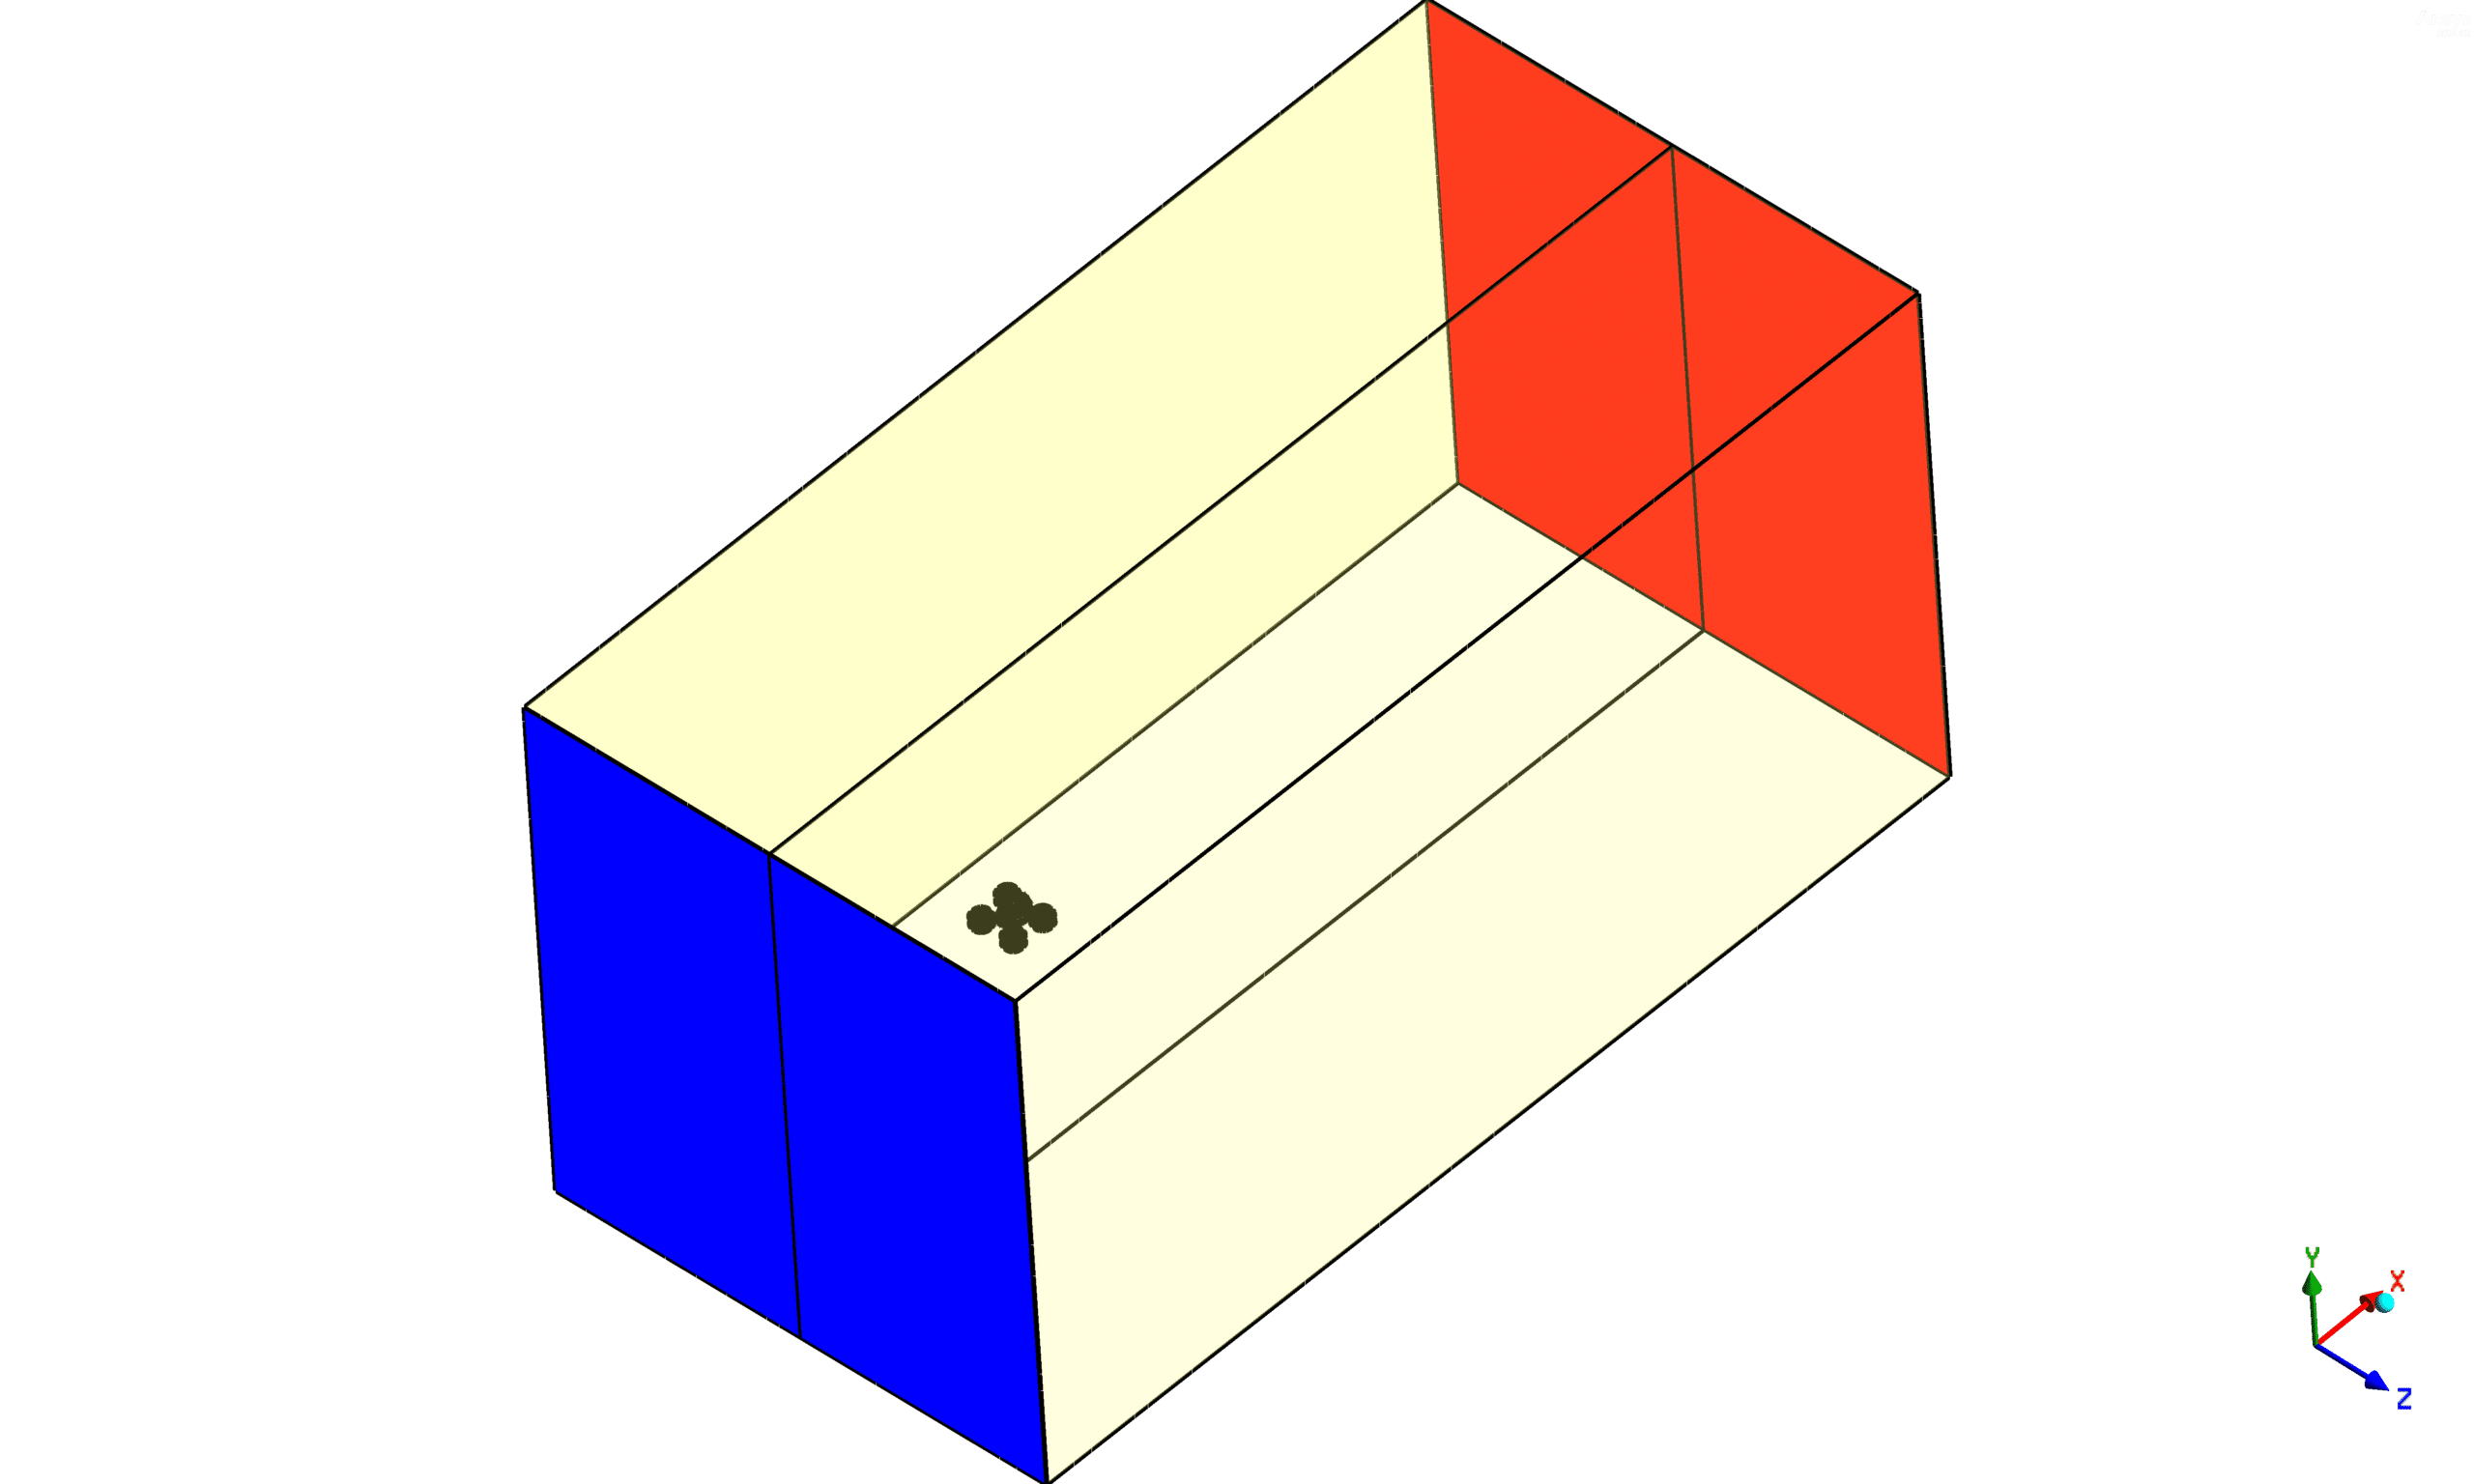
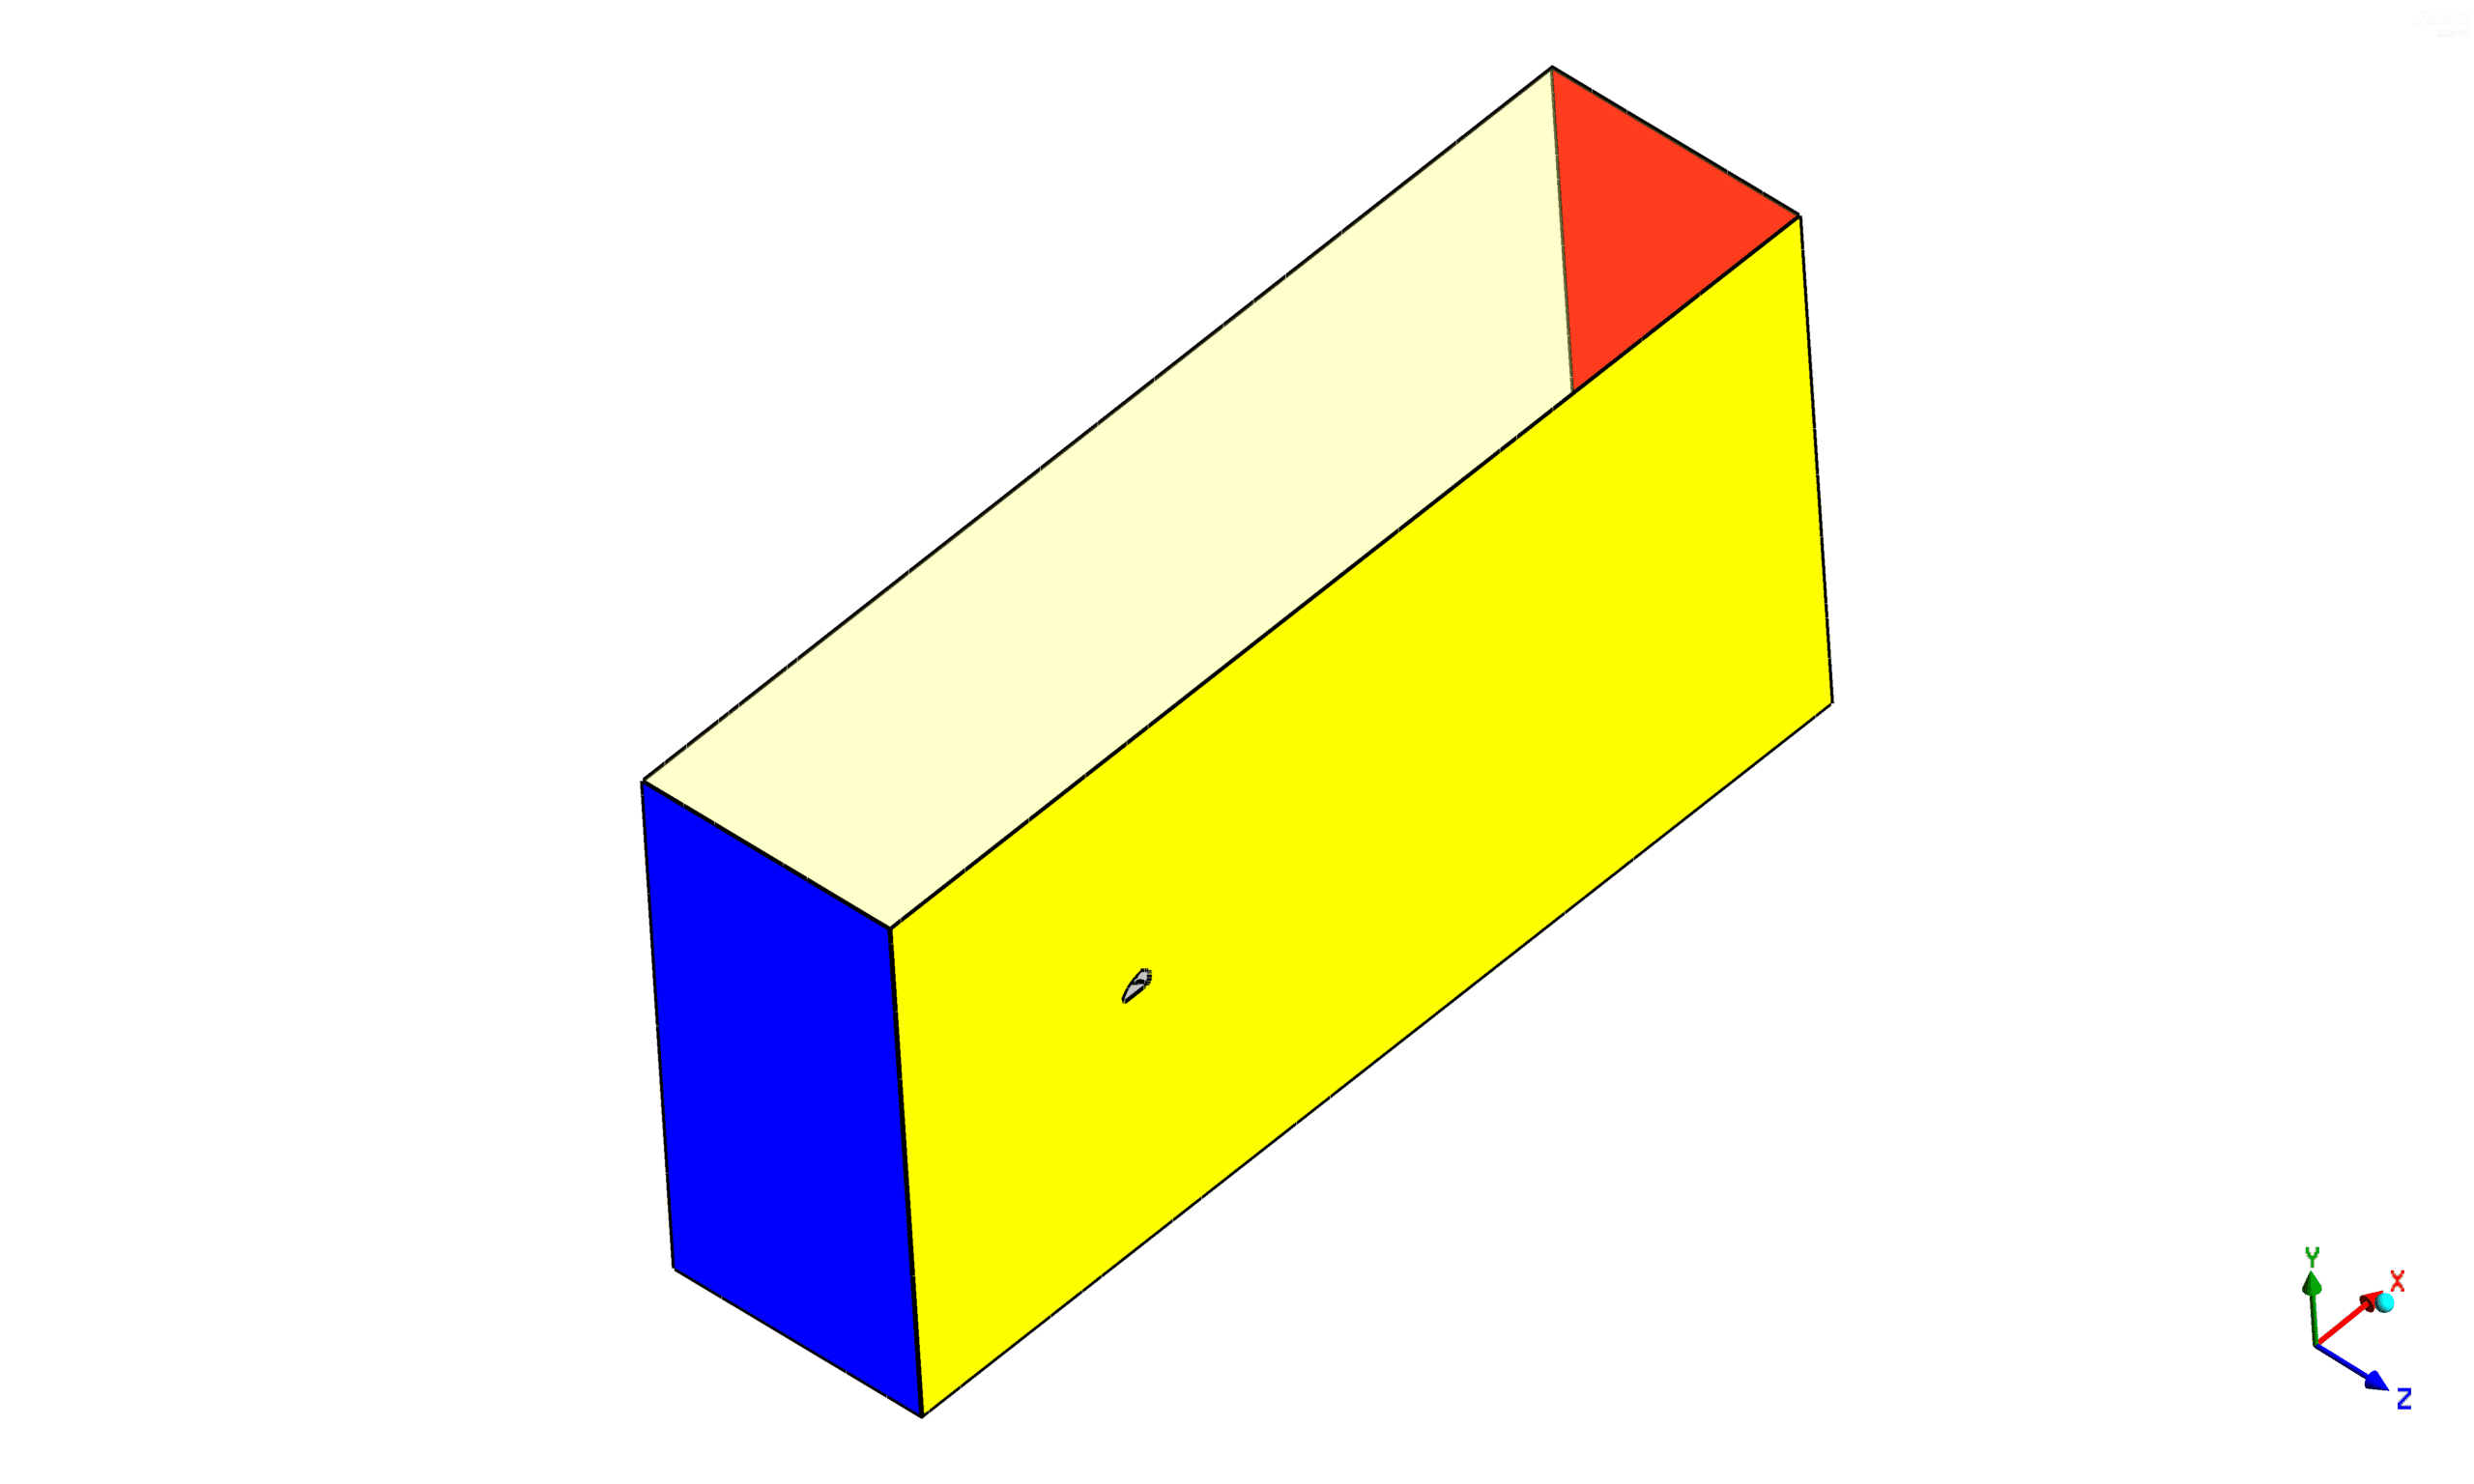
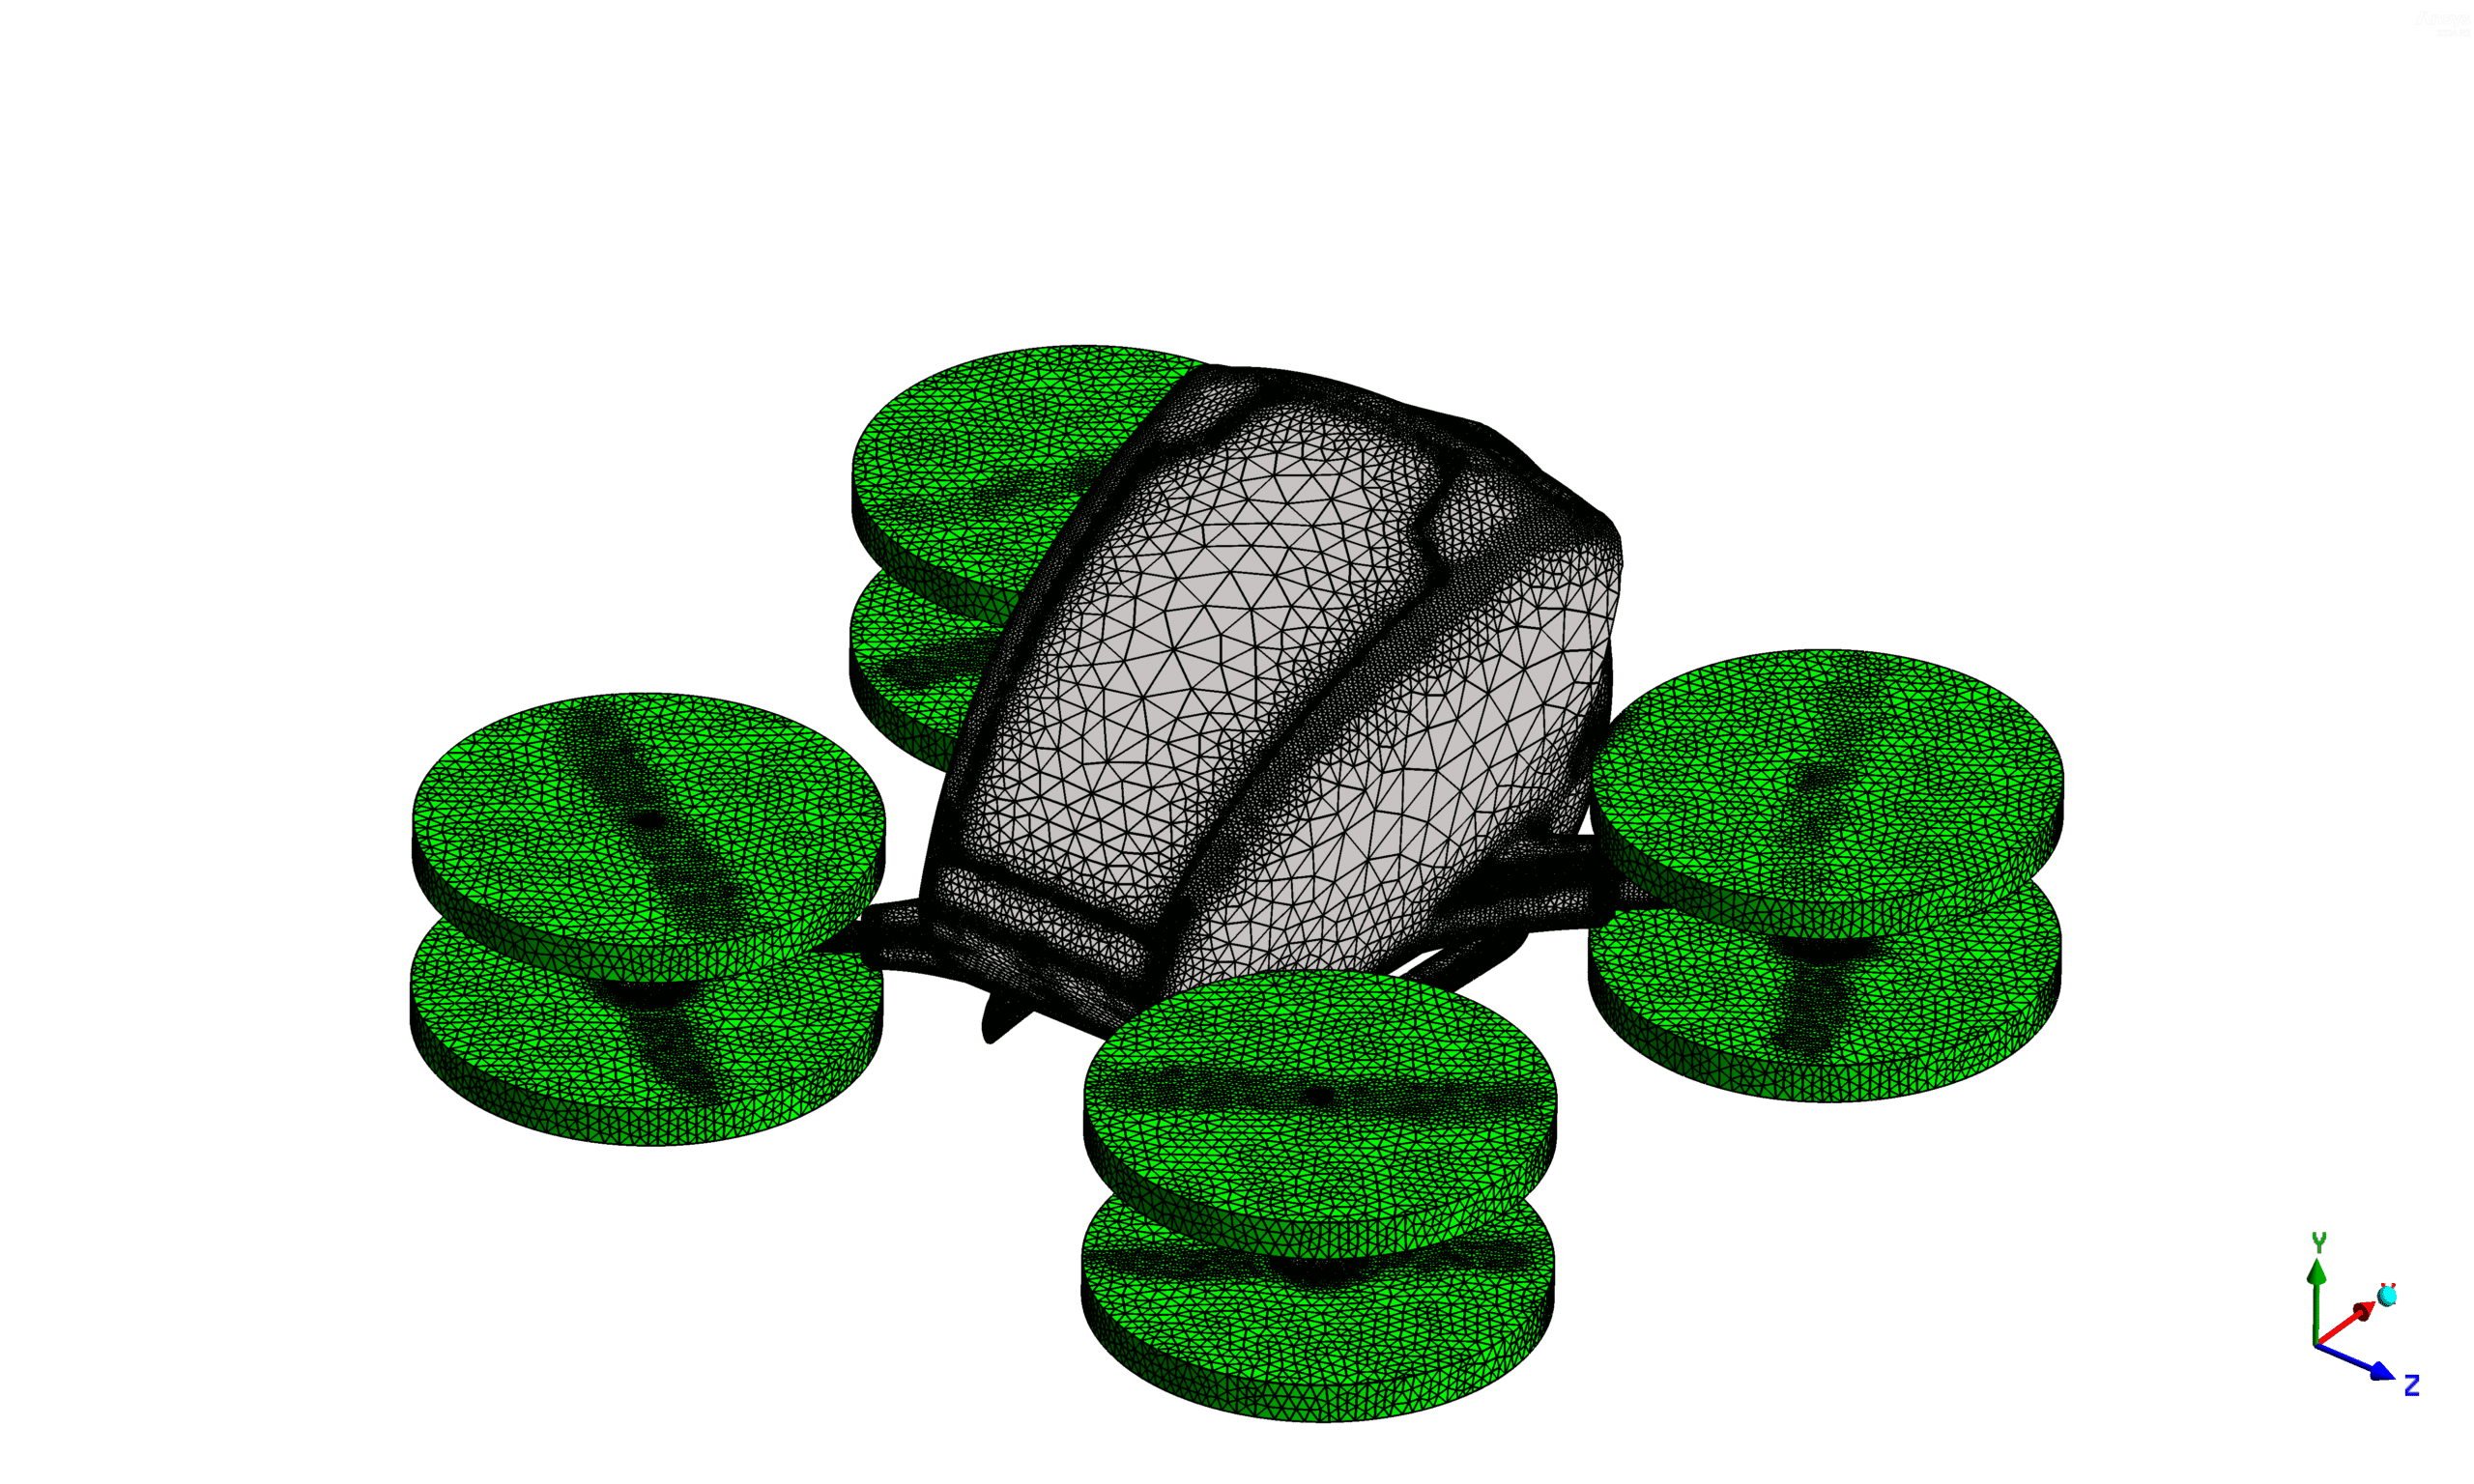
The geometry of the taxi drone was designed using ANSYS SpaceClaim as shown in Fig. 1. This geometry captures the essential features of the drone, which includes the upper and lower rotors. The mesh was generated using ANSYS Meshing, resulting in a total of 2,829,977 elements, as depicted in Fig. 2. The mesh is conformal, ensuring a high-quality discretization suitable for accurate simulation results.
Simulation Setup in ANSYS Fluent
The simulations were conducted in ANSYS Fluent, where the governing equations were solved under specified conditions. The velocity inlet was set to 30 m/s with an angle of attack of 5 degrees. The rotational speed of the blades was configured with MRF method at 5000 RPM, with the upper and lower blades rotating in opposite directions. This counter-rotation helps in balancing the aerodynamic forces and improving stability.
Numerical Methodology
The SIMPLE algorithm was employed for pressure-velocity coupling, which is effective in stabilizing the solution and ensuring convergence.
Results
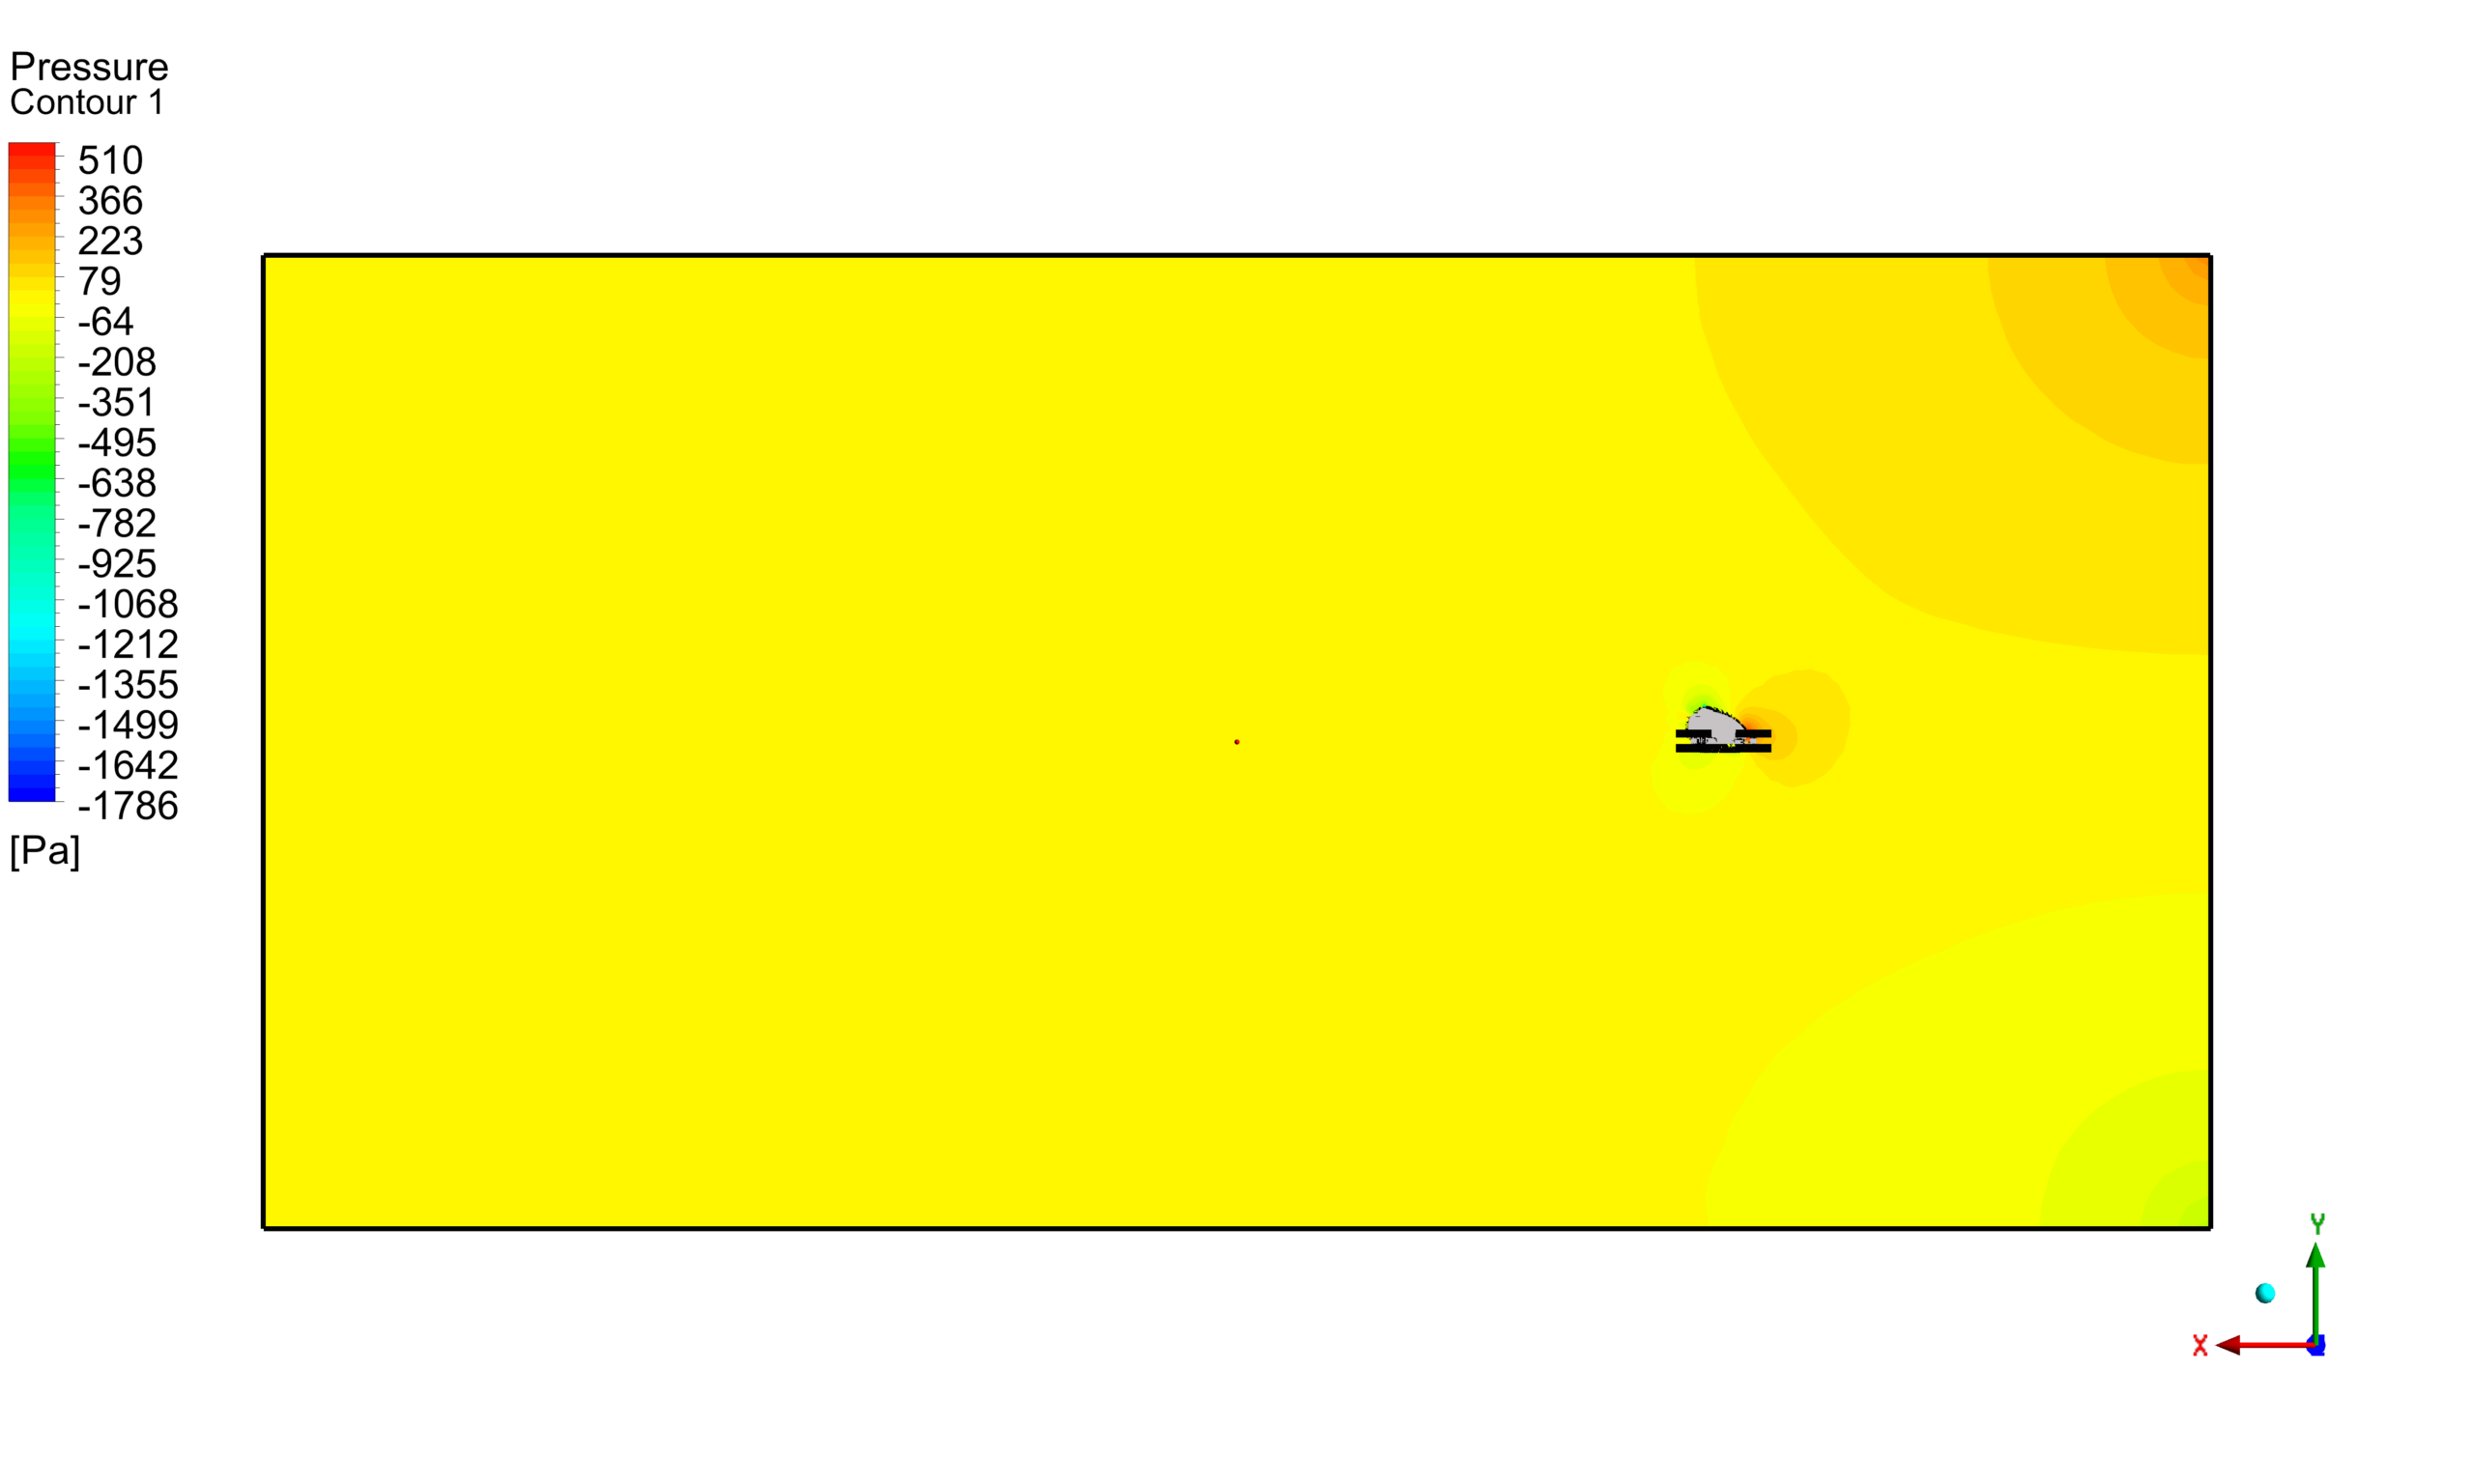
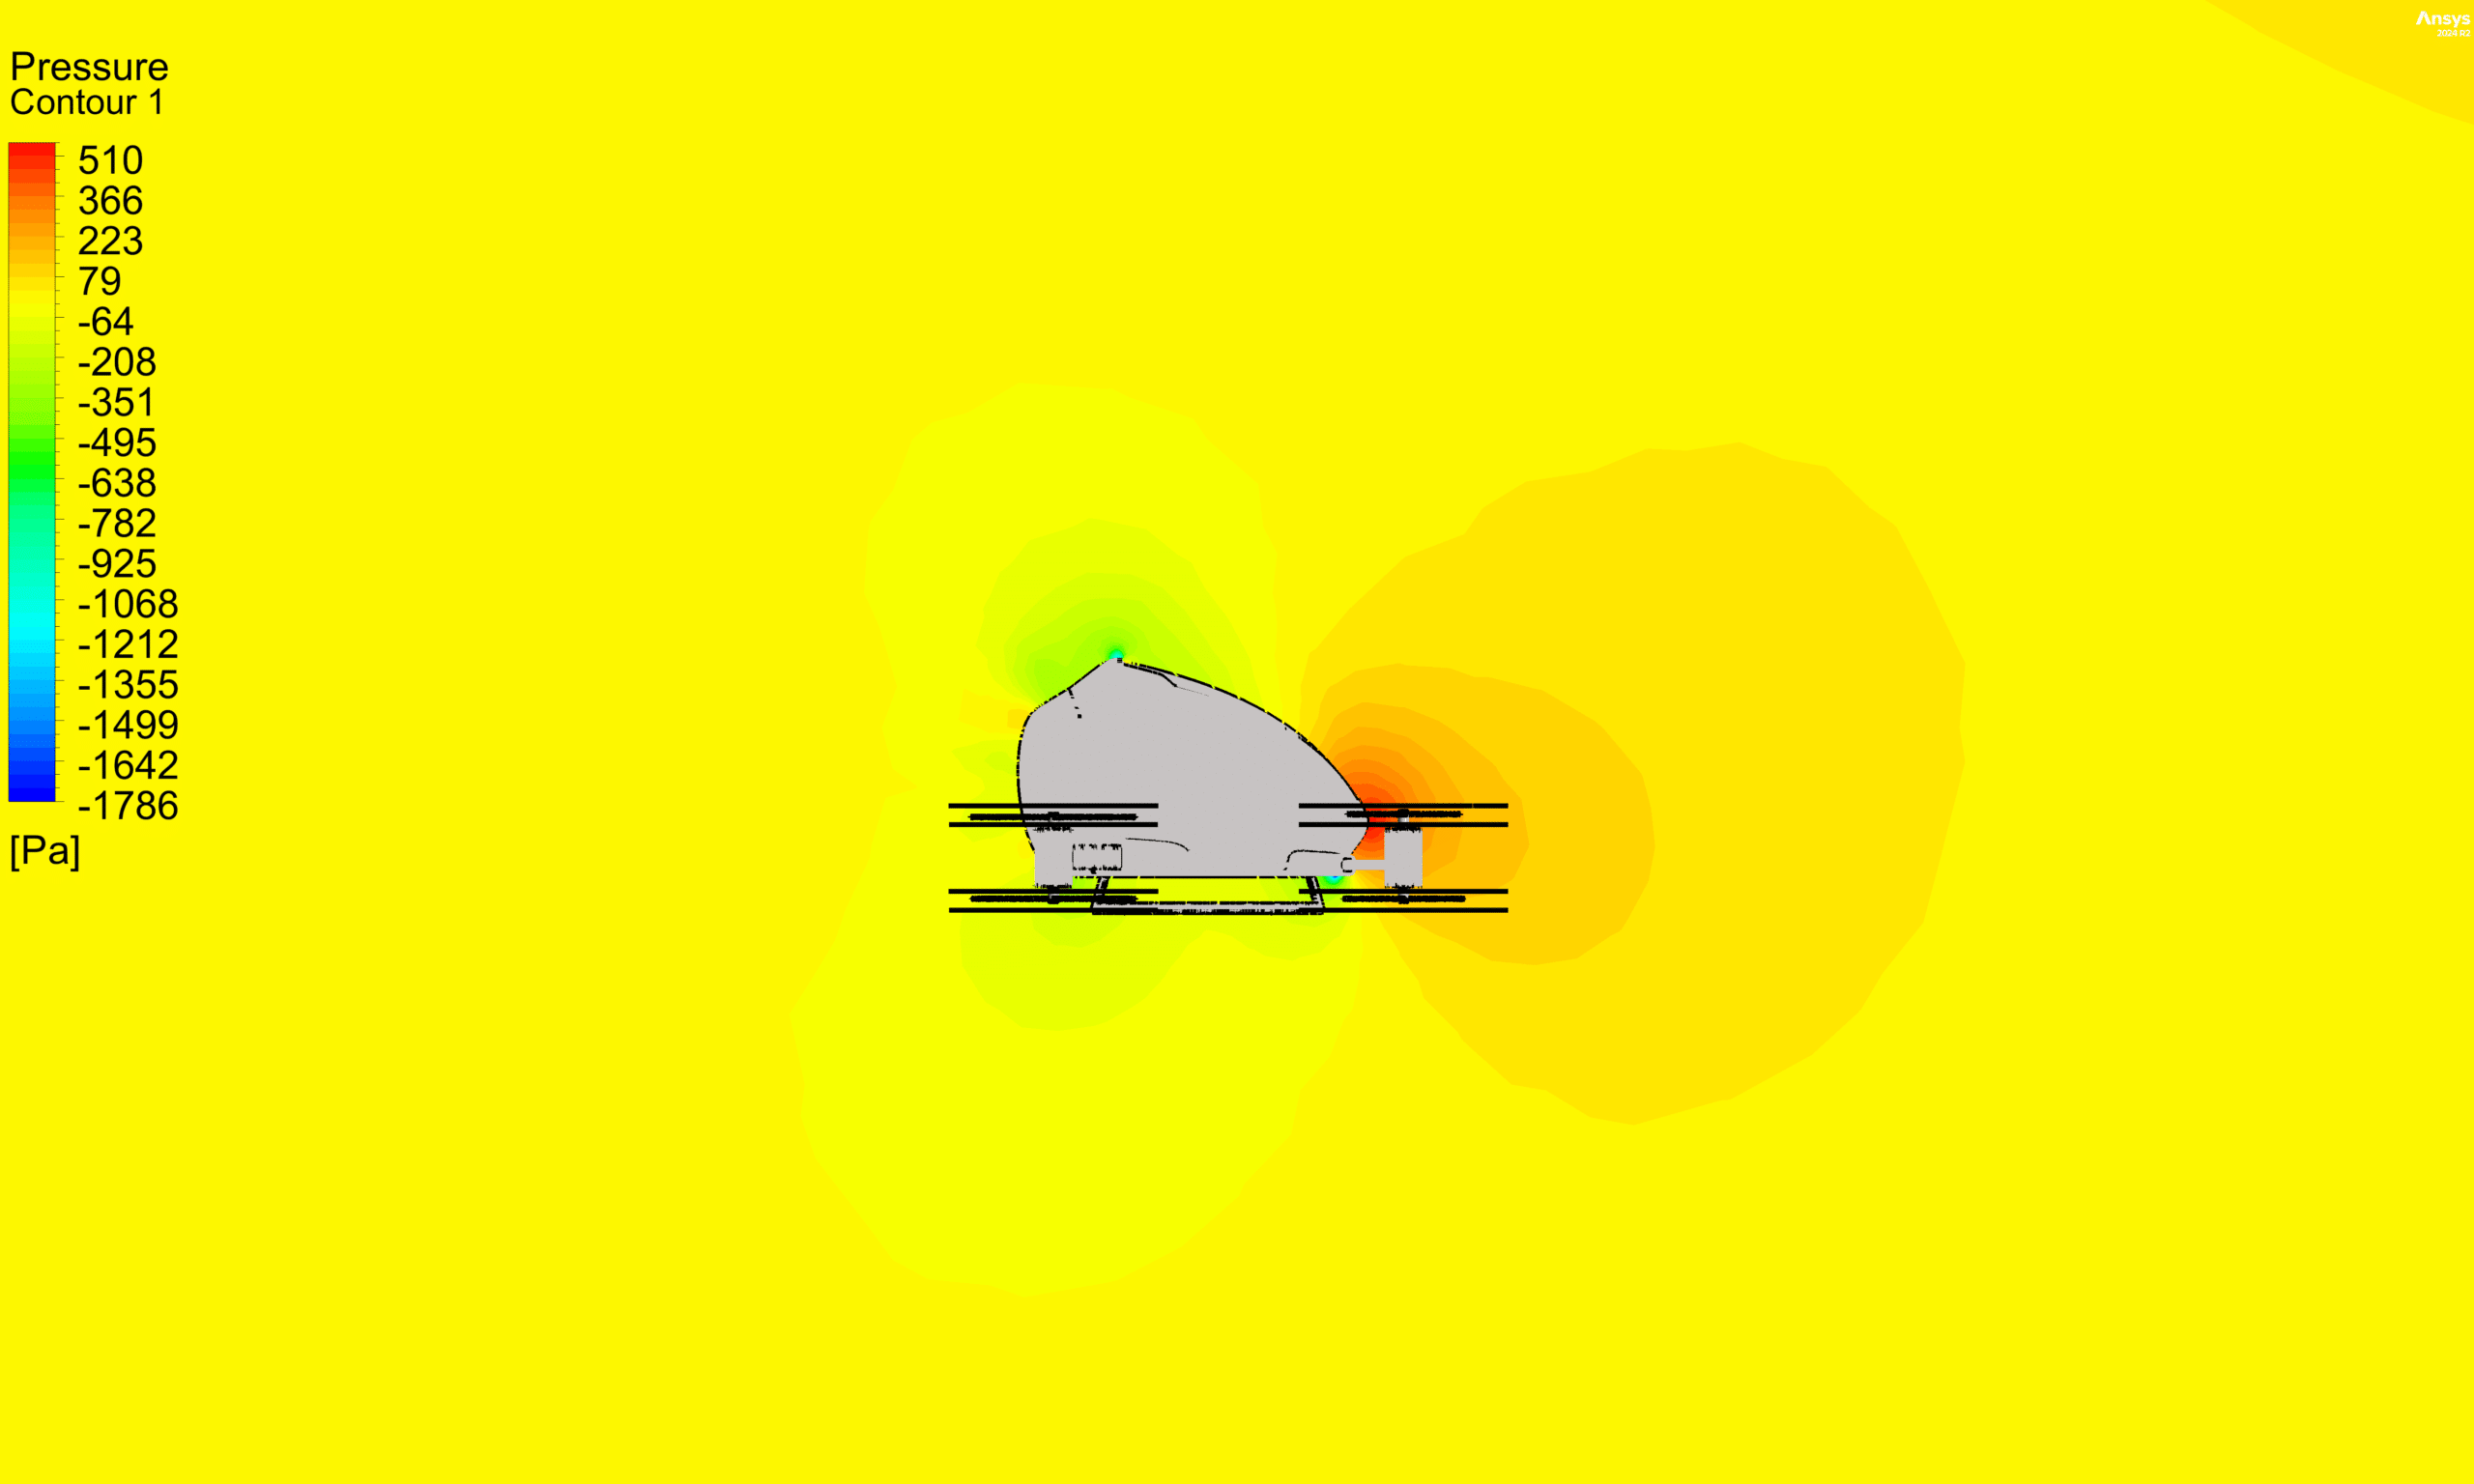
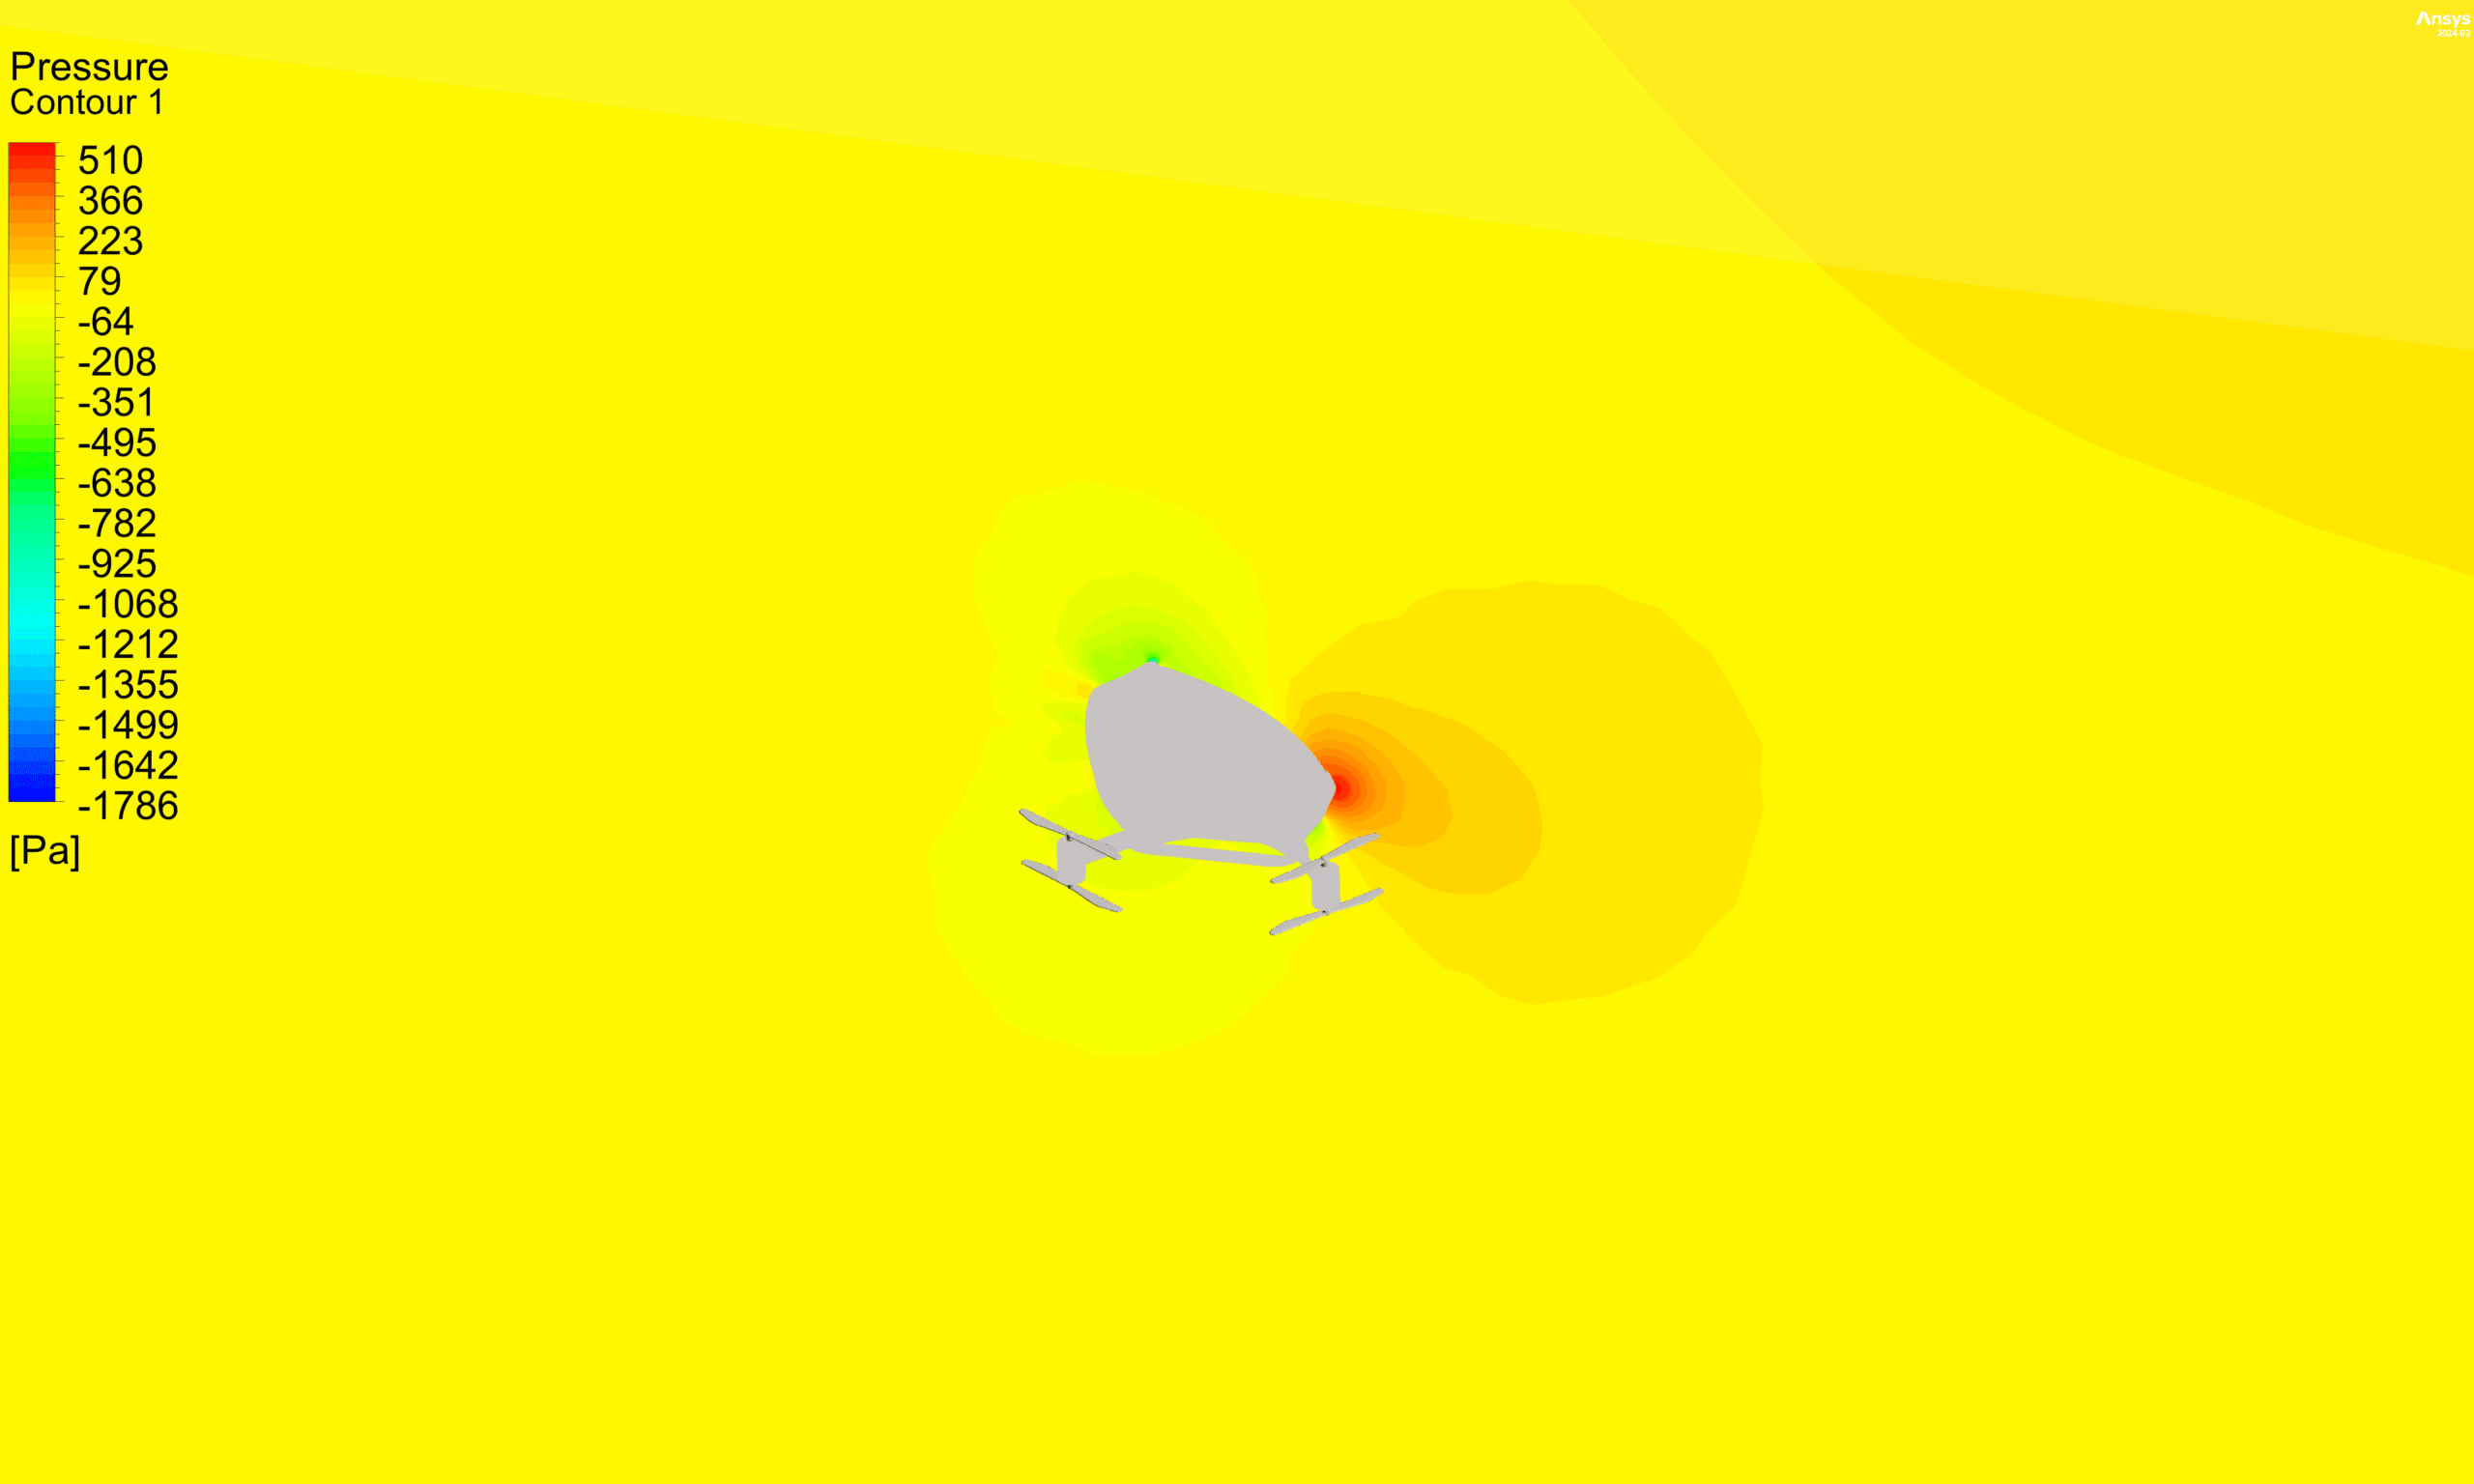
Pressure Contour: The resulting pressure distribution around the drone is illustrated in Fig. 3. This gives insights into the aerodynamic forces experienced by the drone during flight.
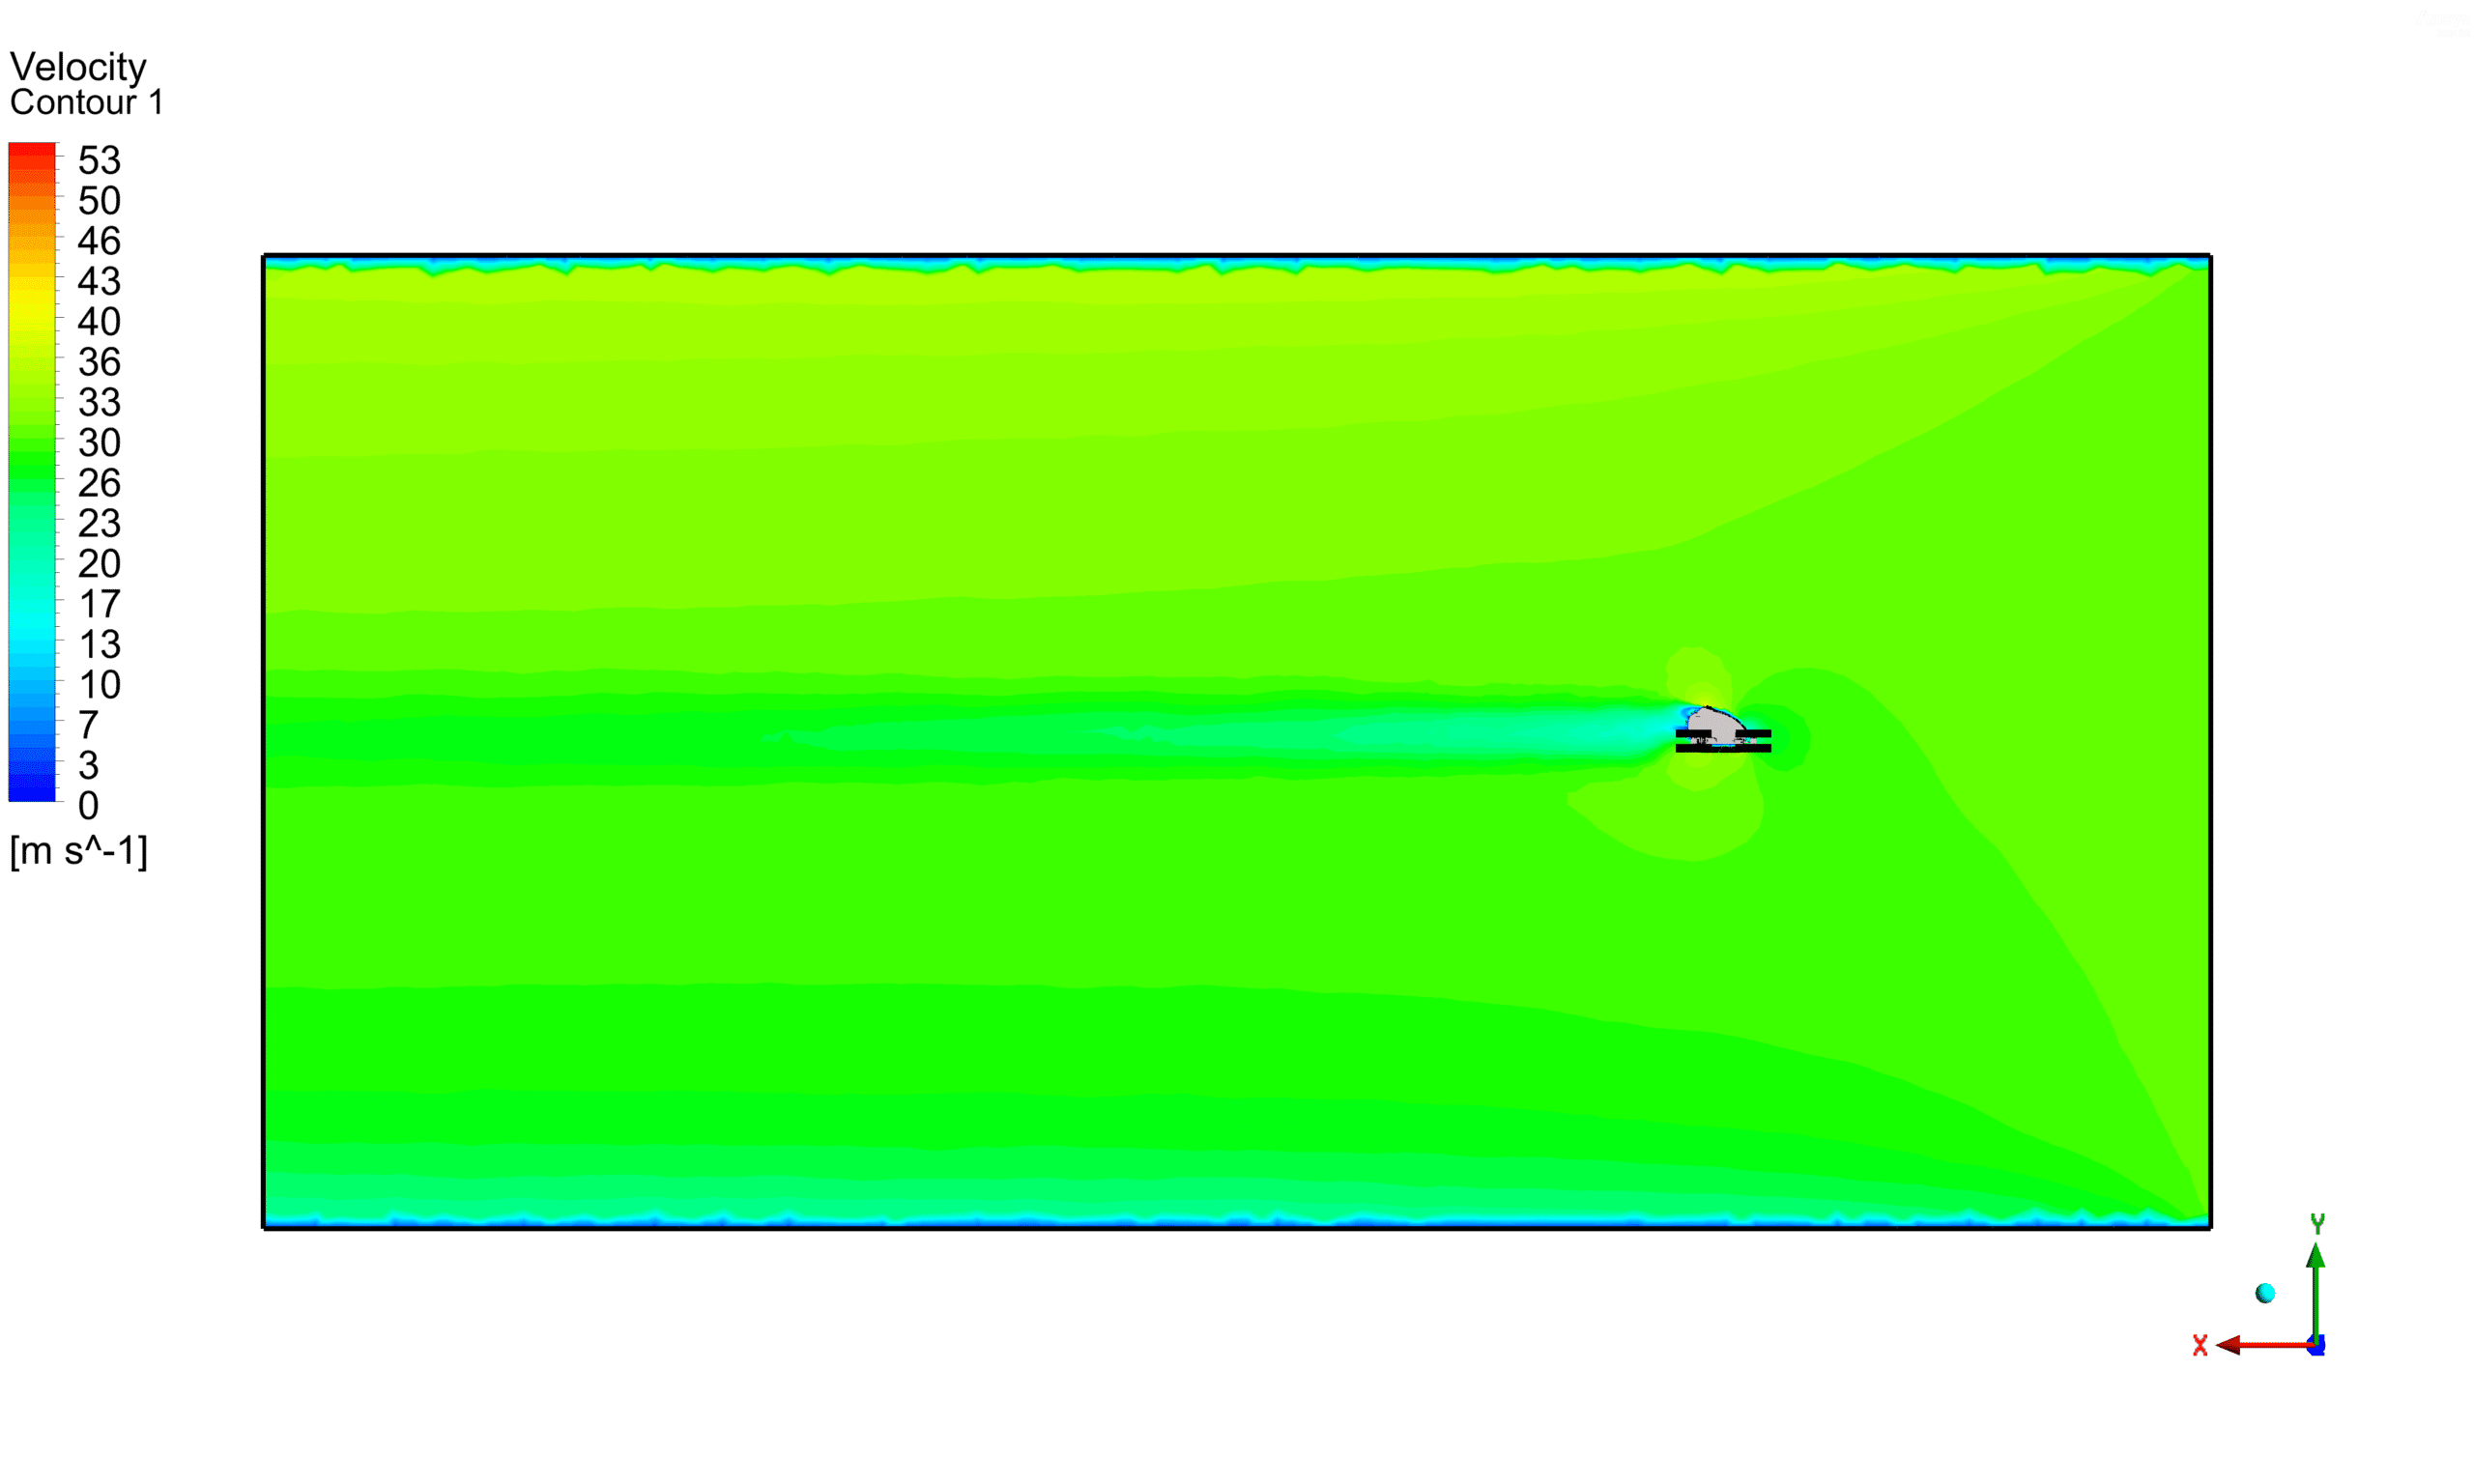
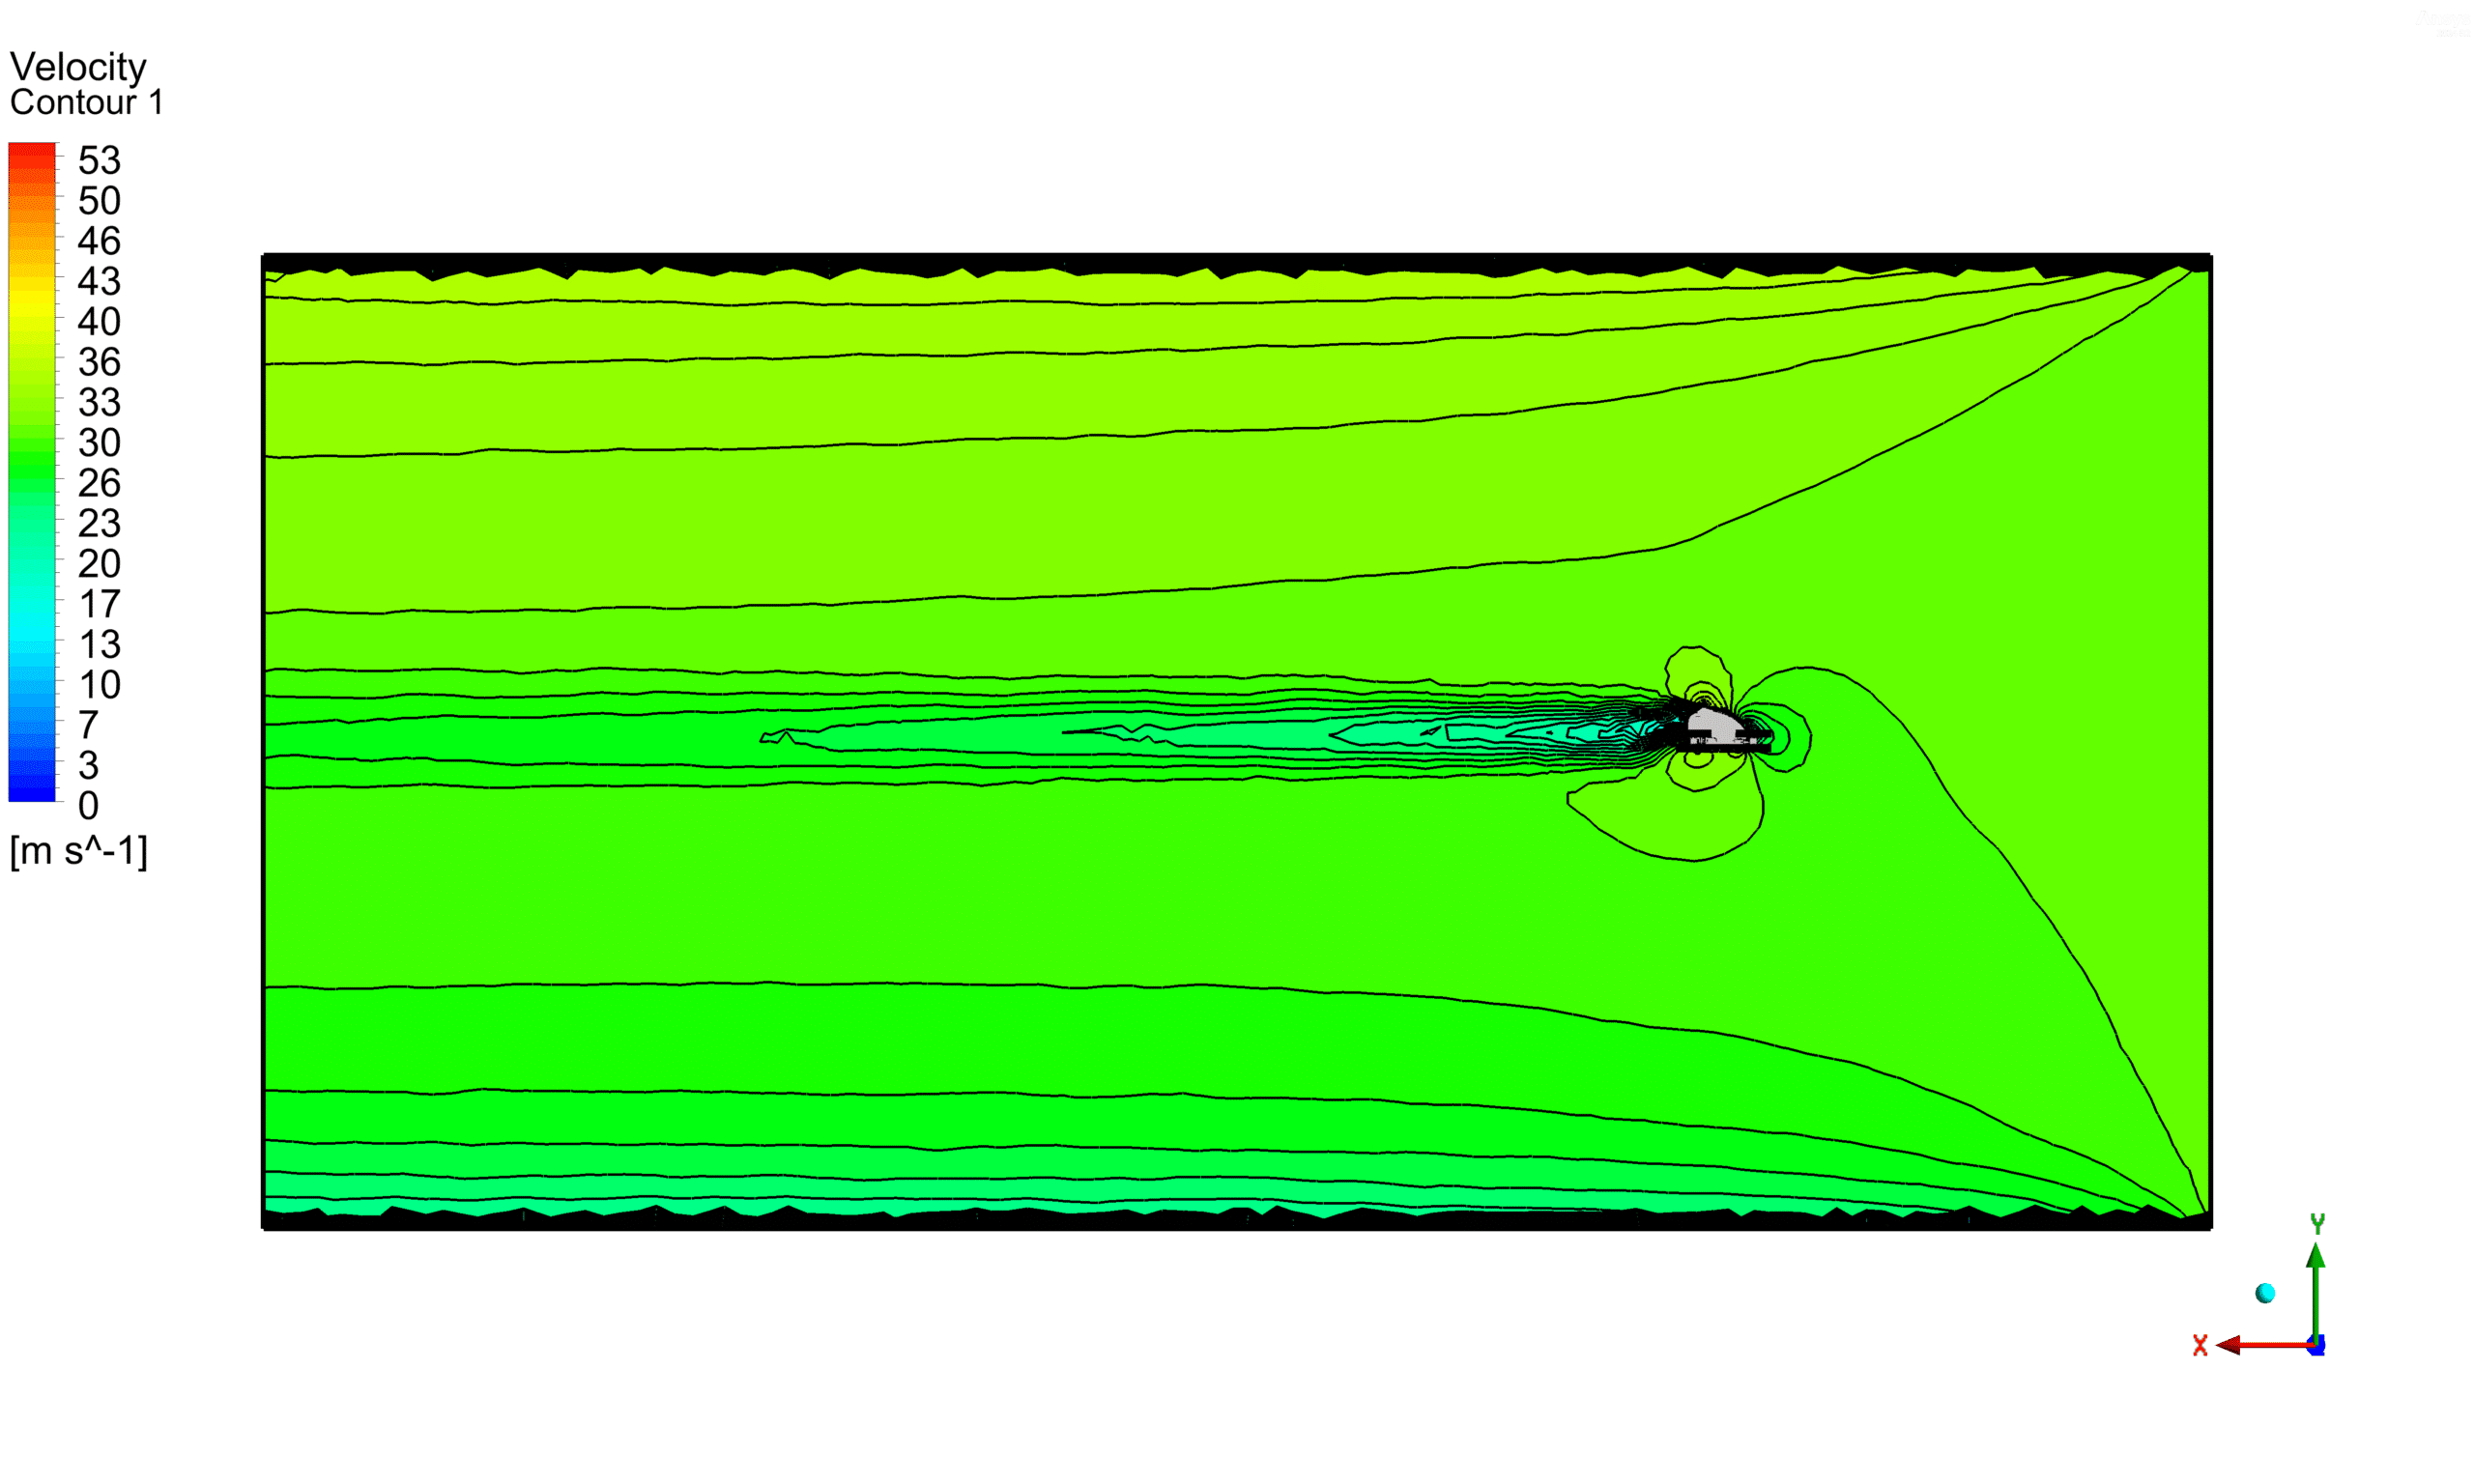
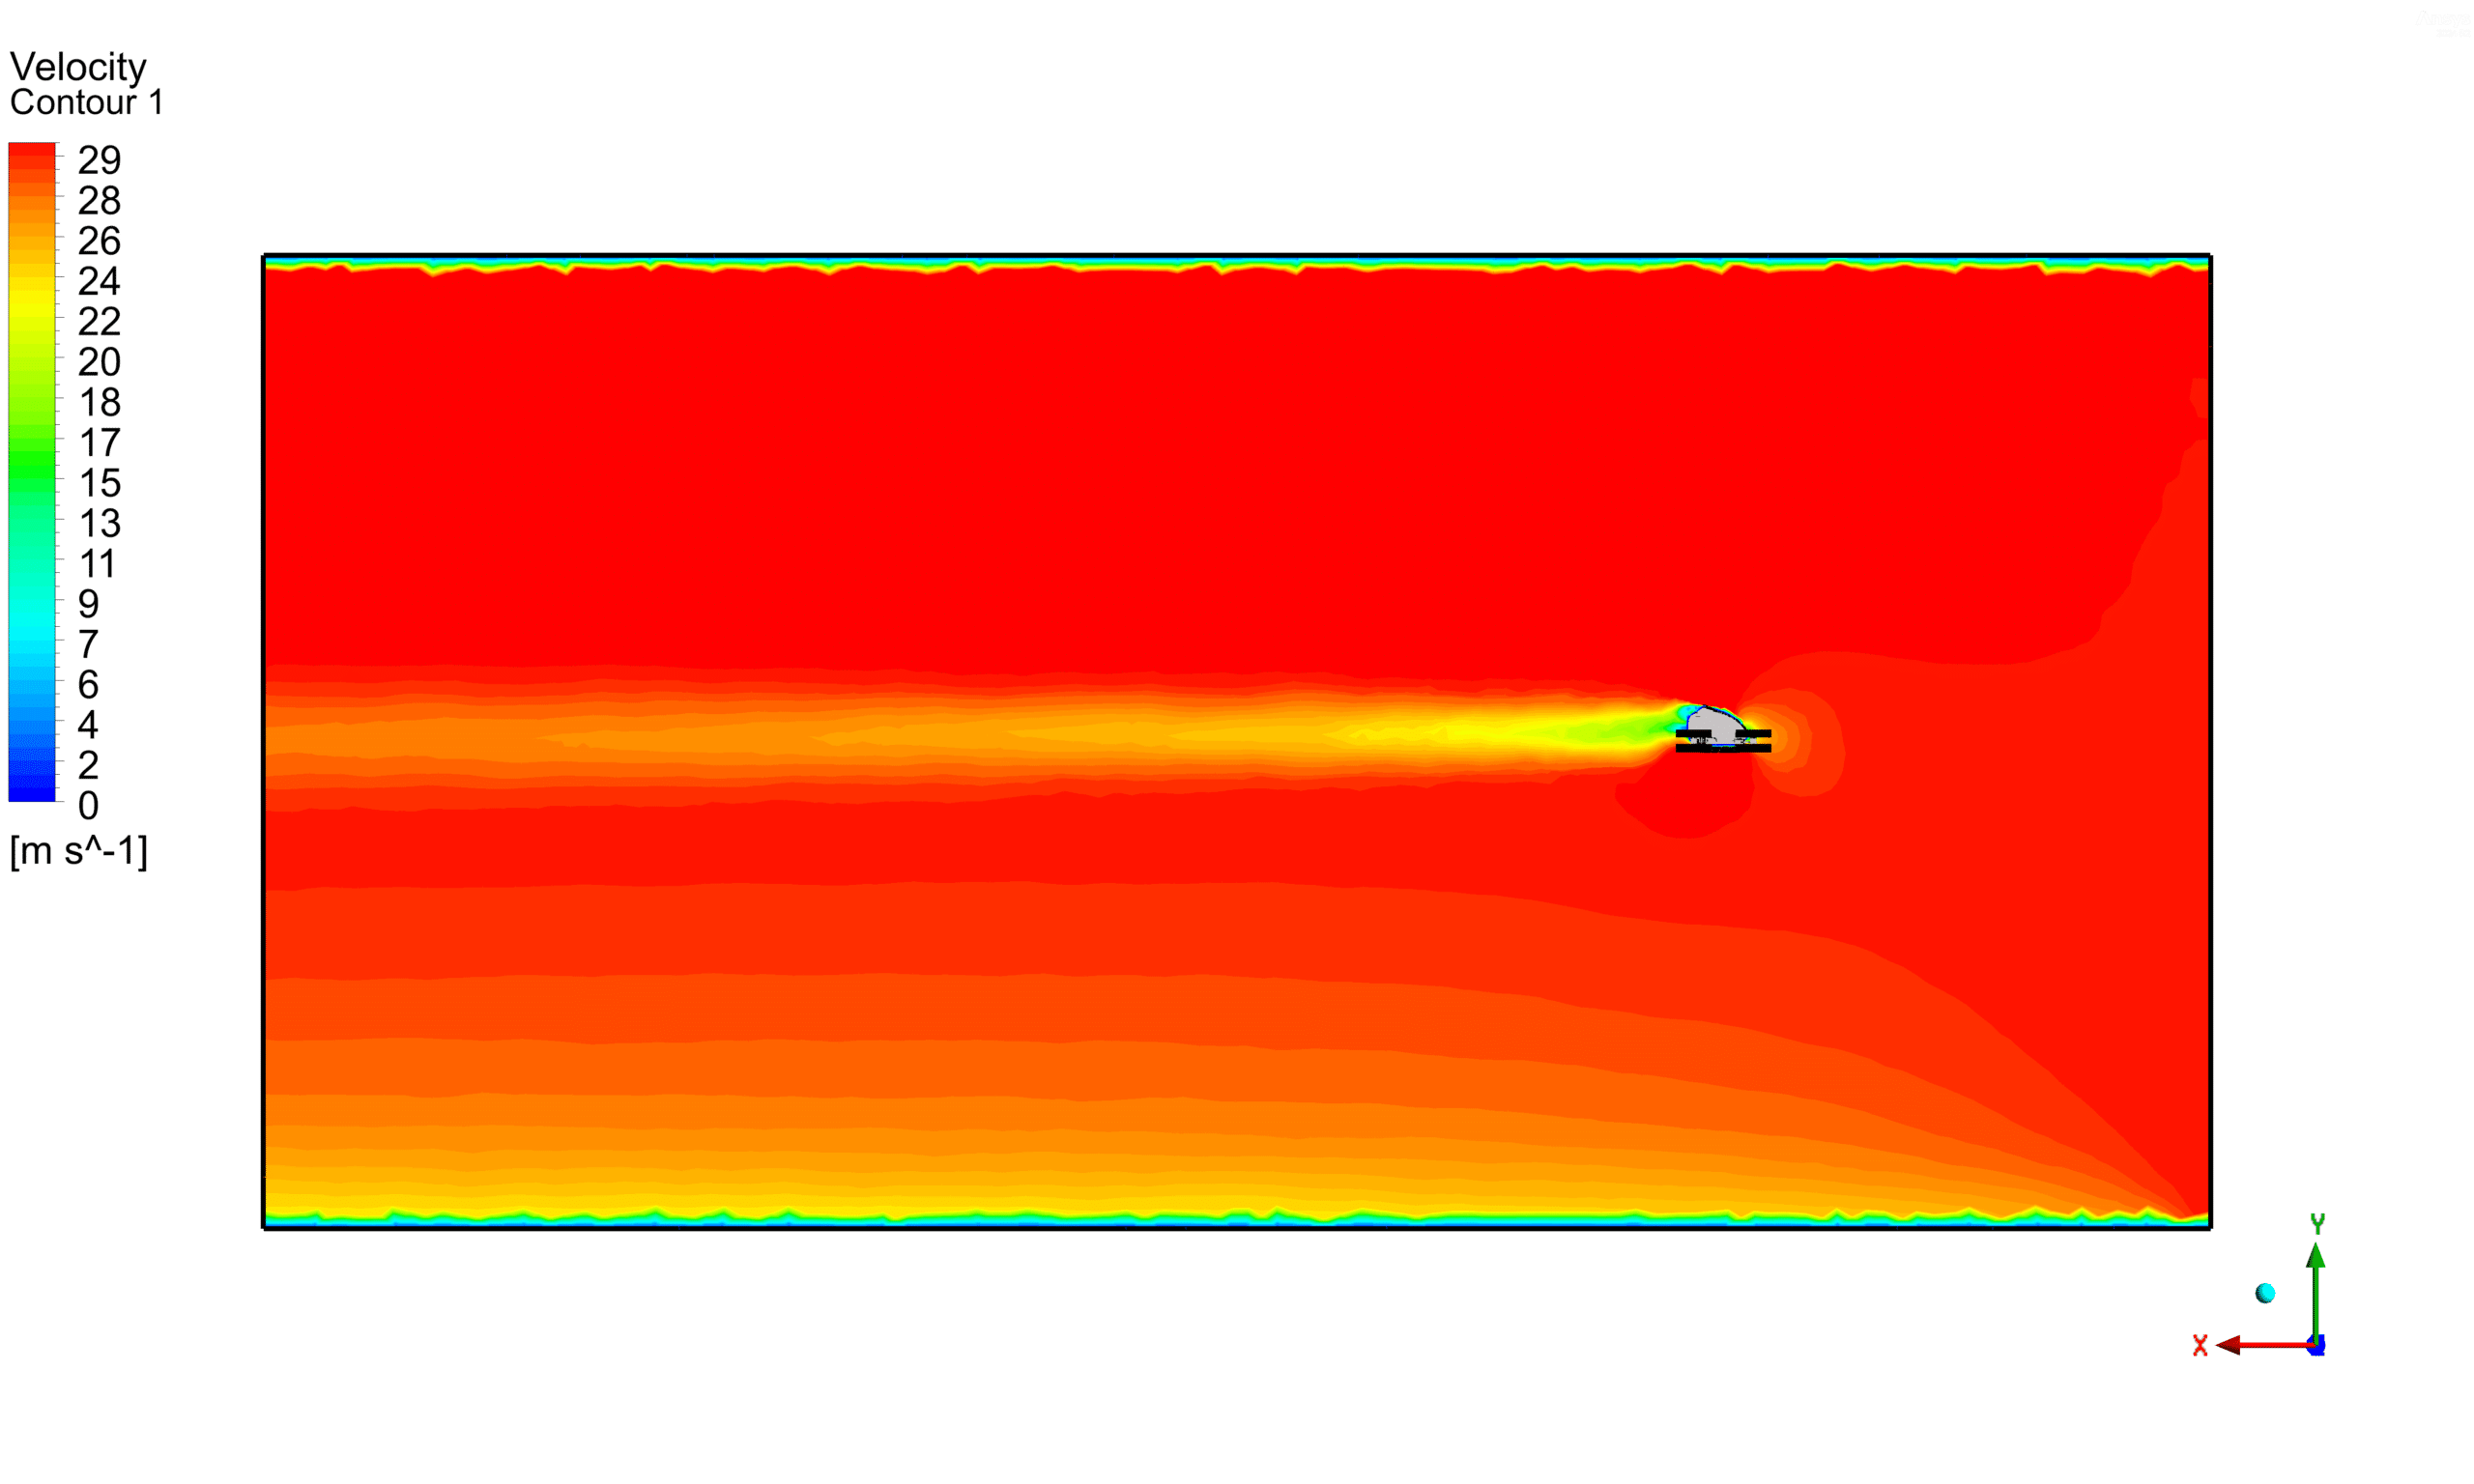
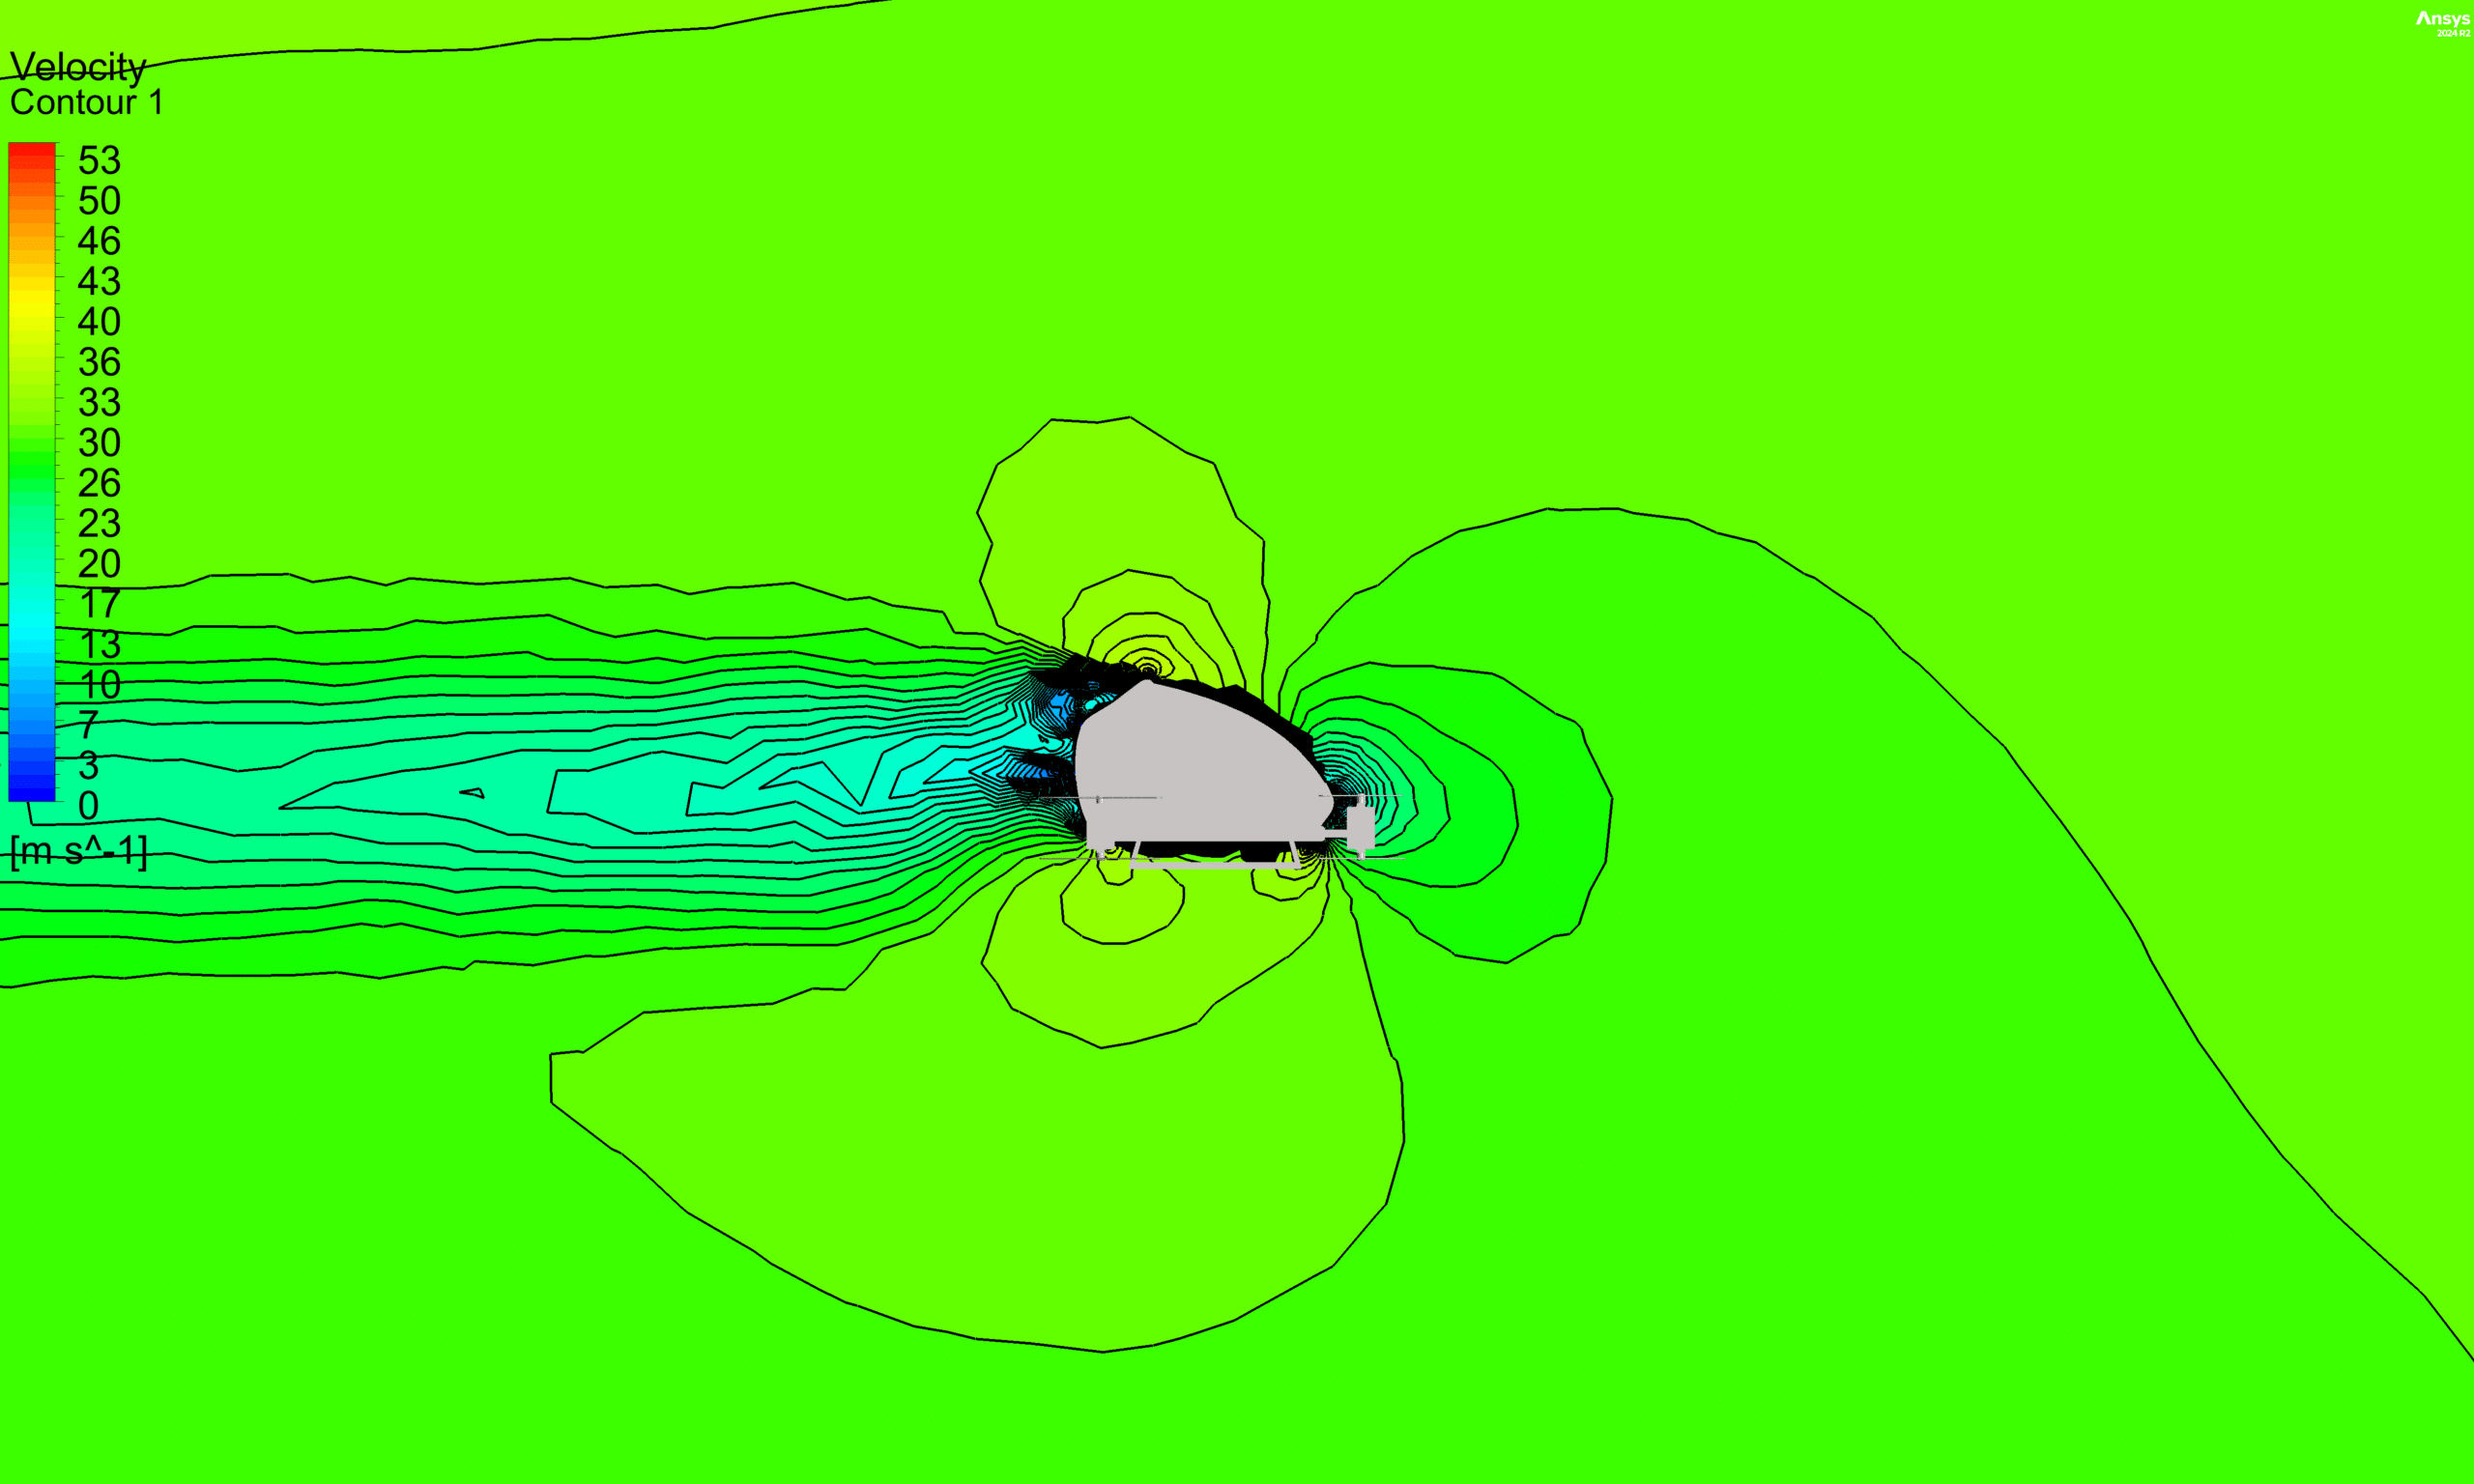
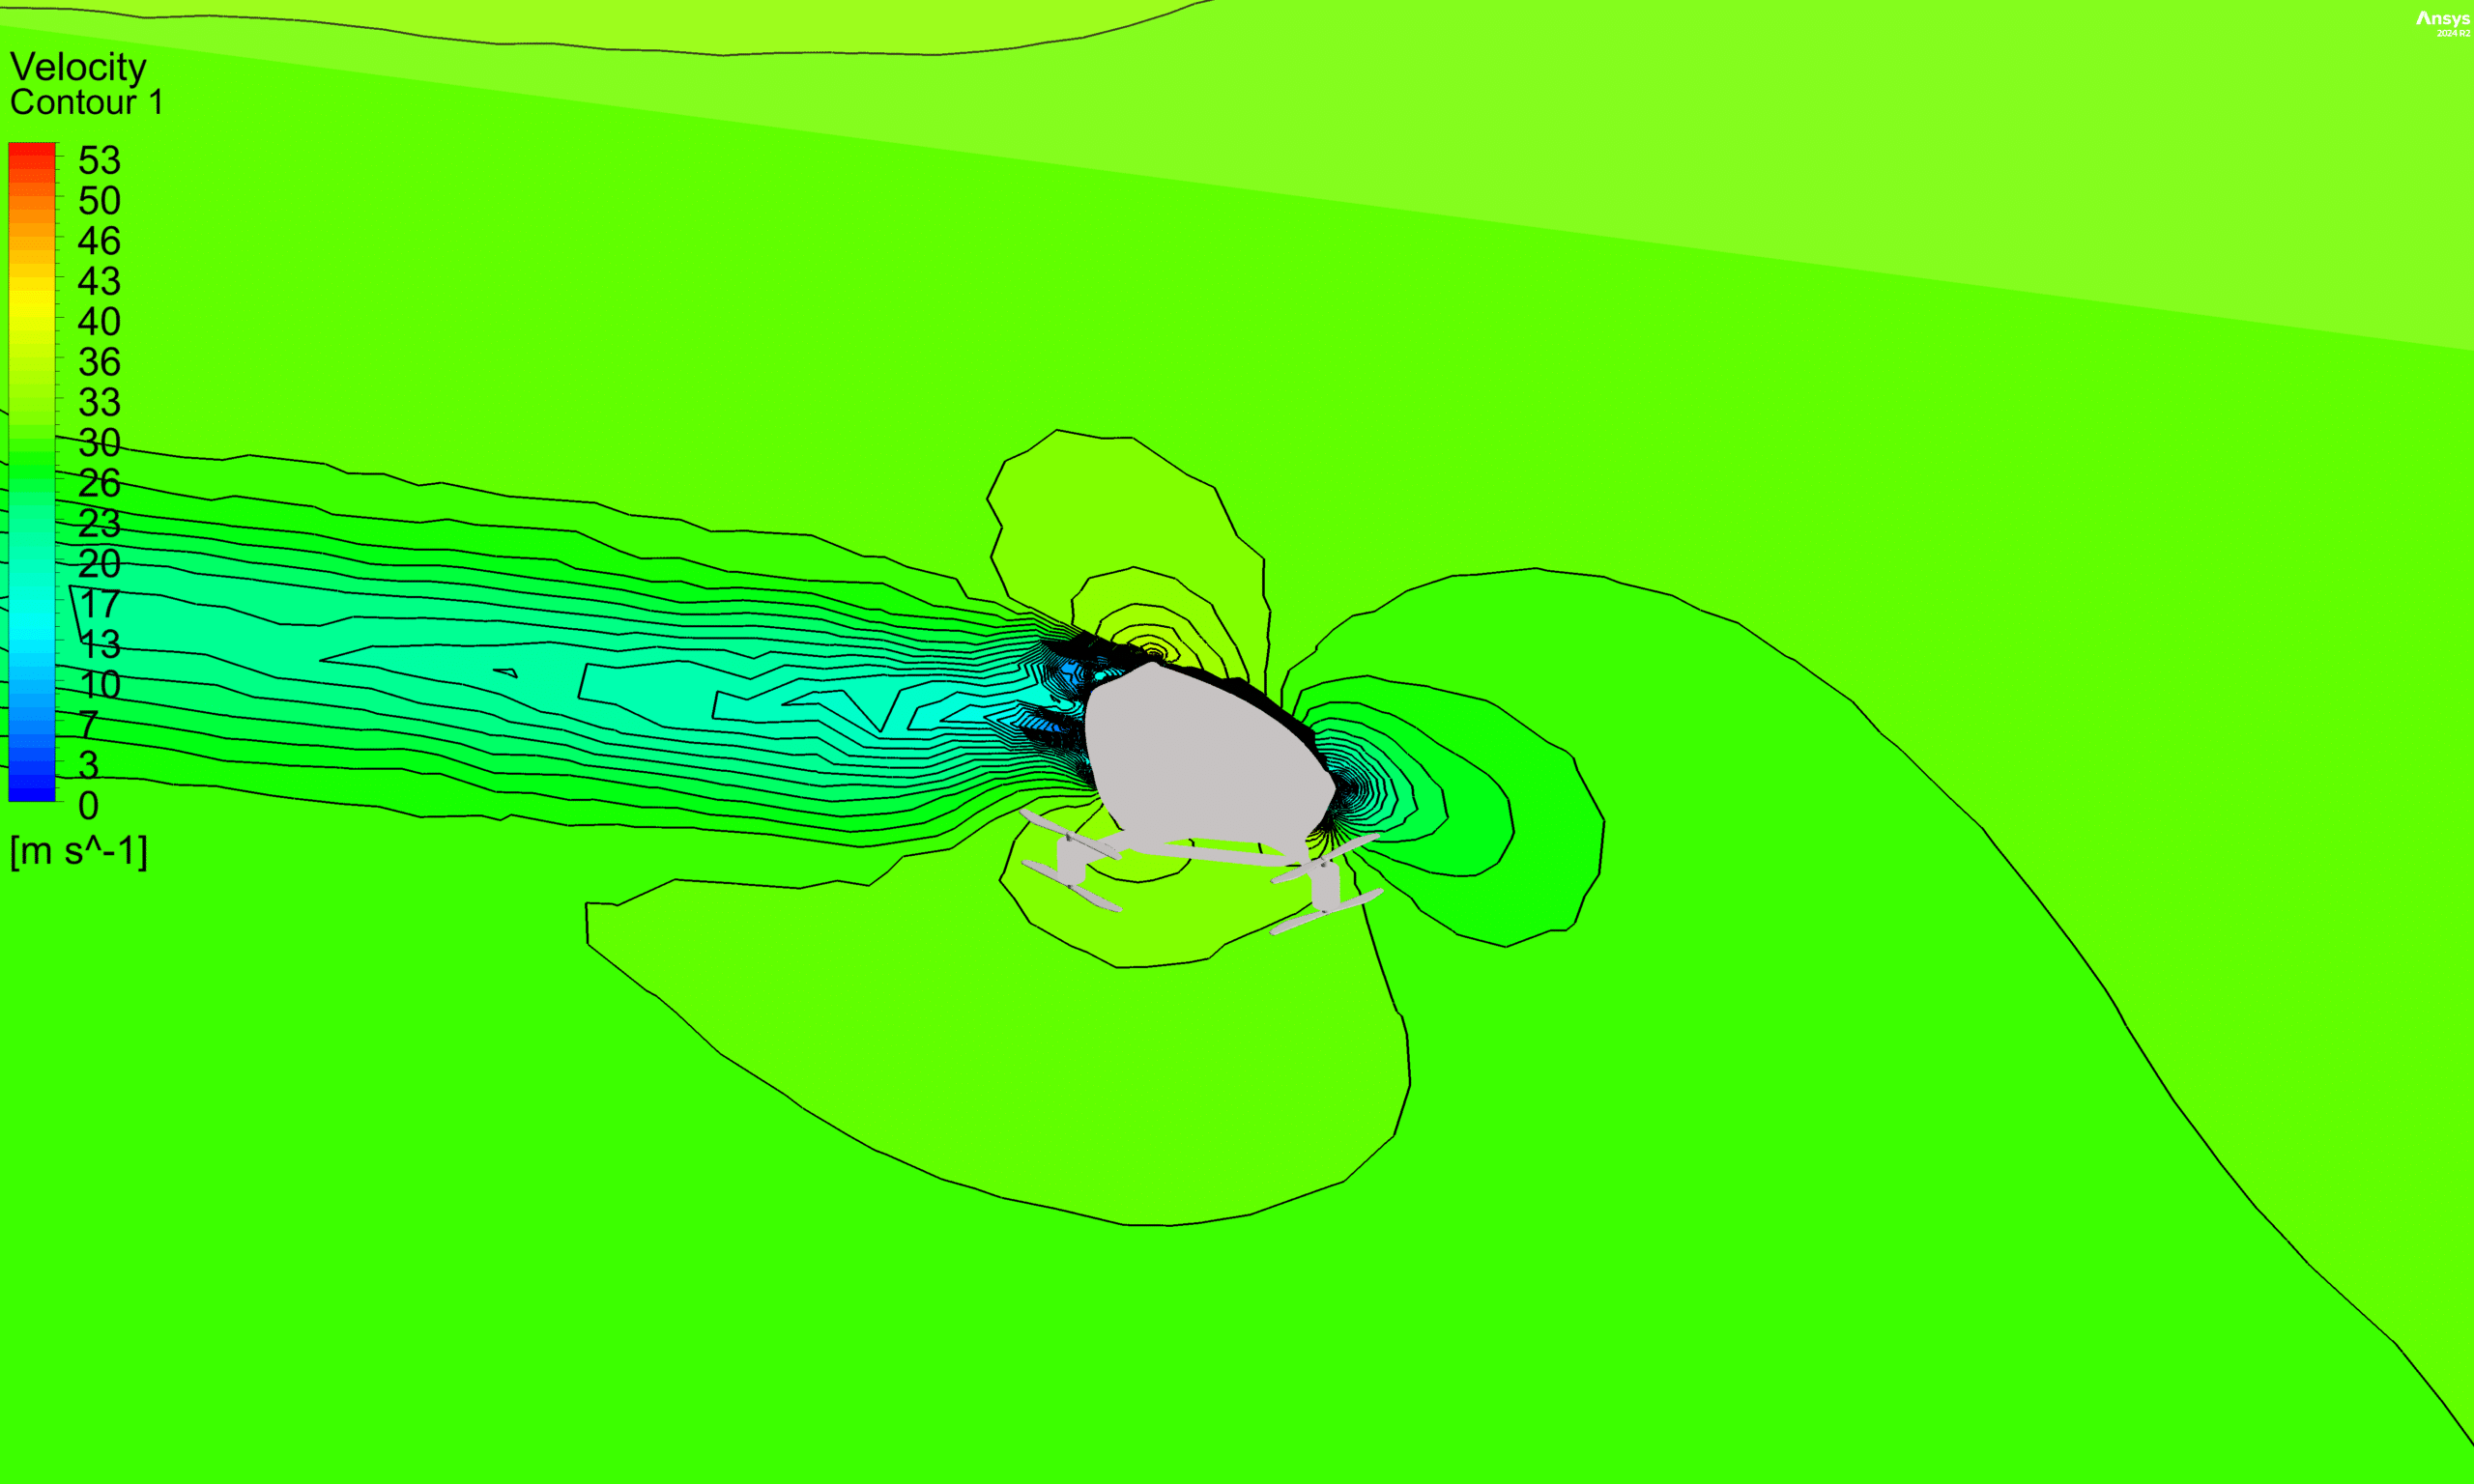
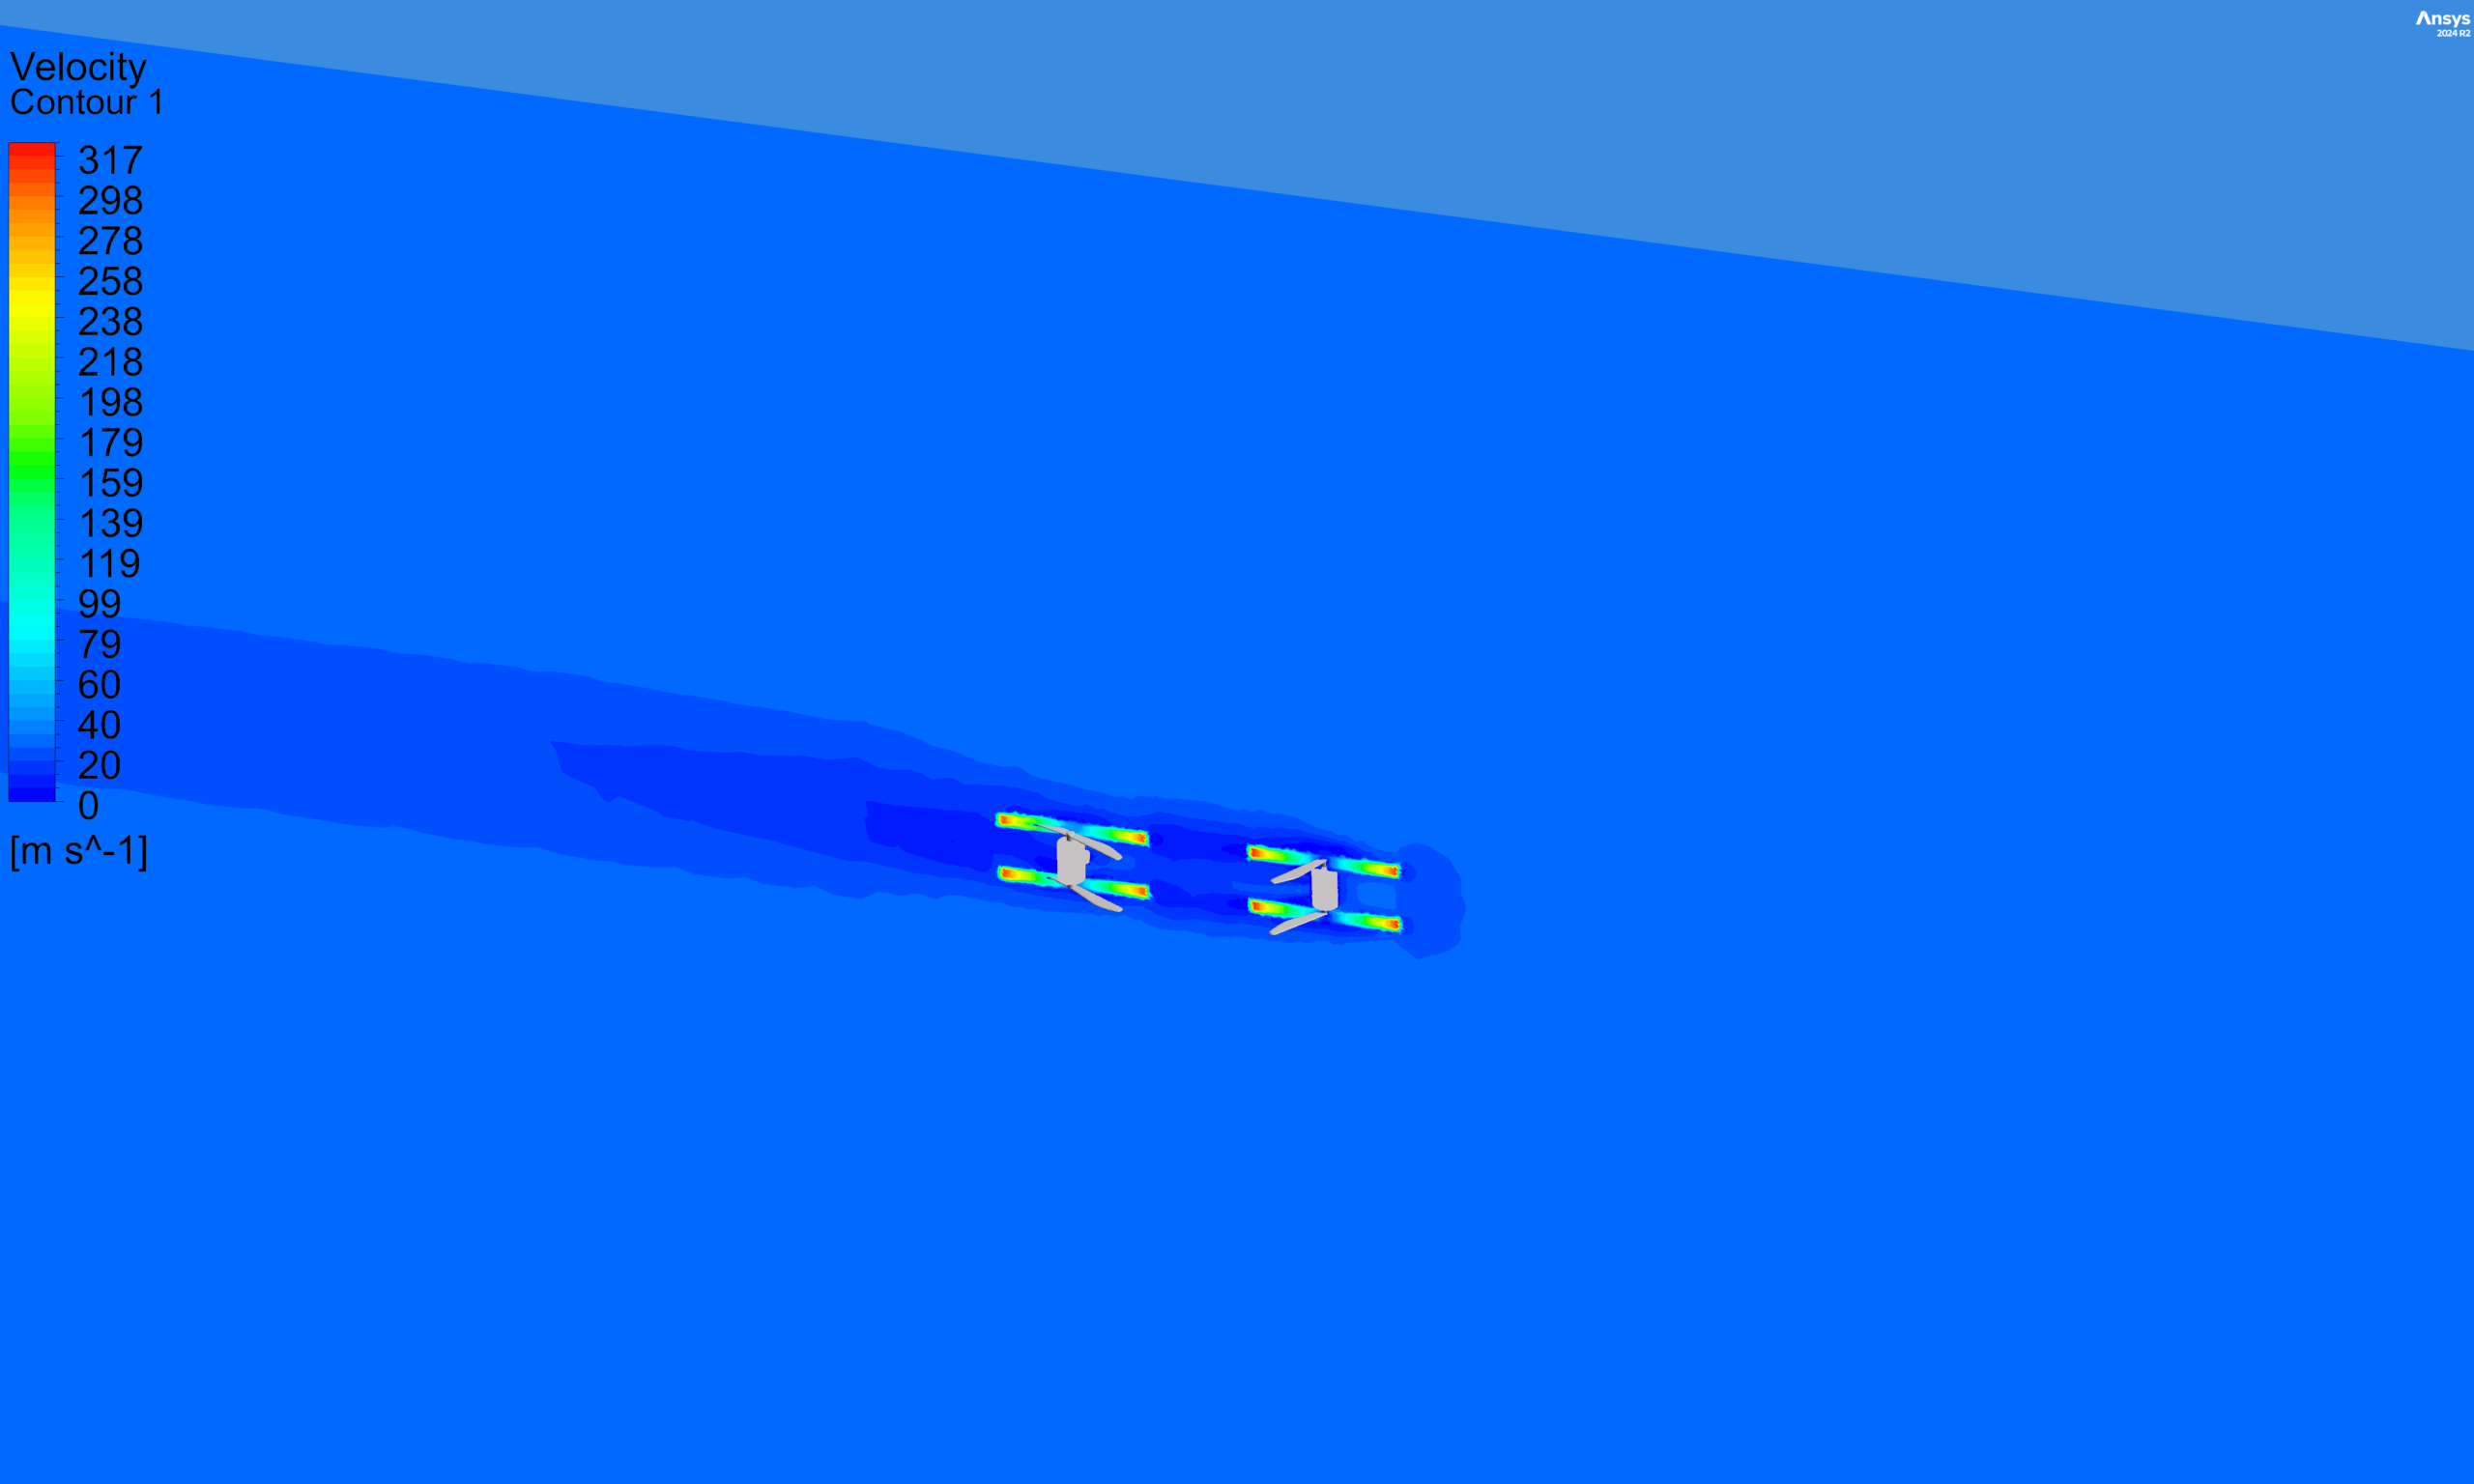
Velocity Contour: The velocity field is depicted in Fig. 4, illustrating how the flow behaves around the drone at a distance of 1.2 meters from the middle. This visualization helps in understanding the effects of the blades’ rotation and the angle of attack on the surrounding airflow.
These results provide crucial information for assessing the aerodynamic performance and can be used for further optimization of the drone design.



Reviews
There are no reviews yet.