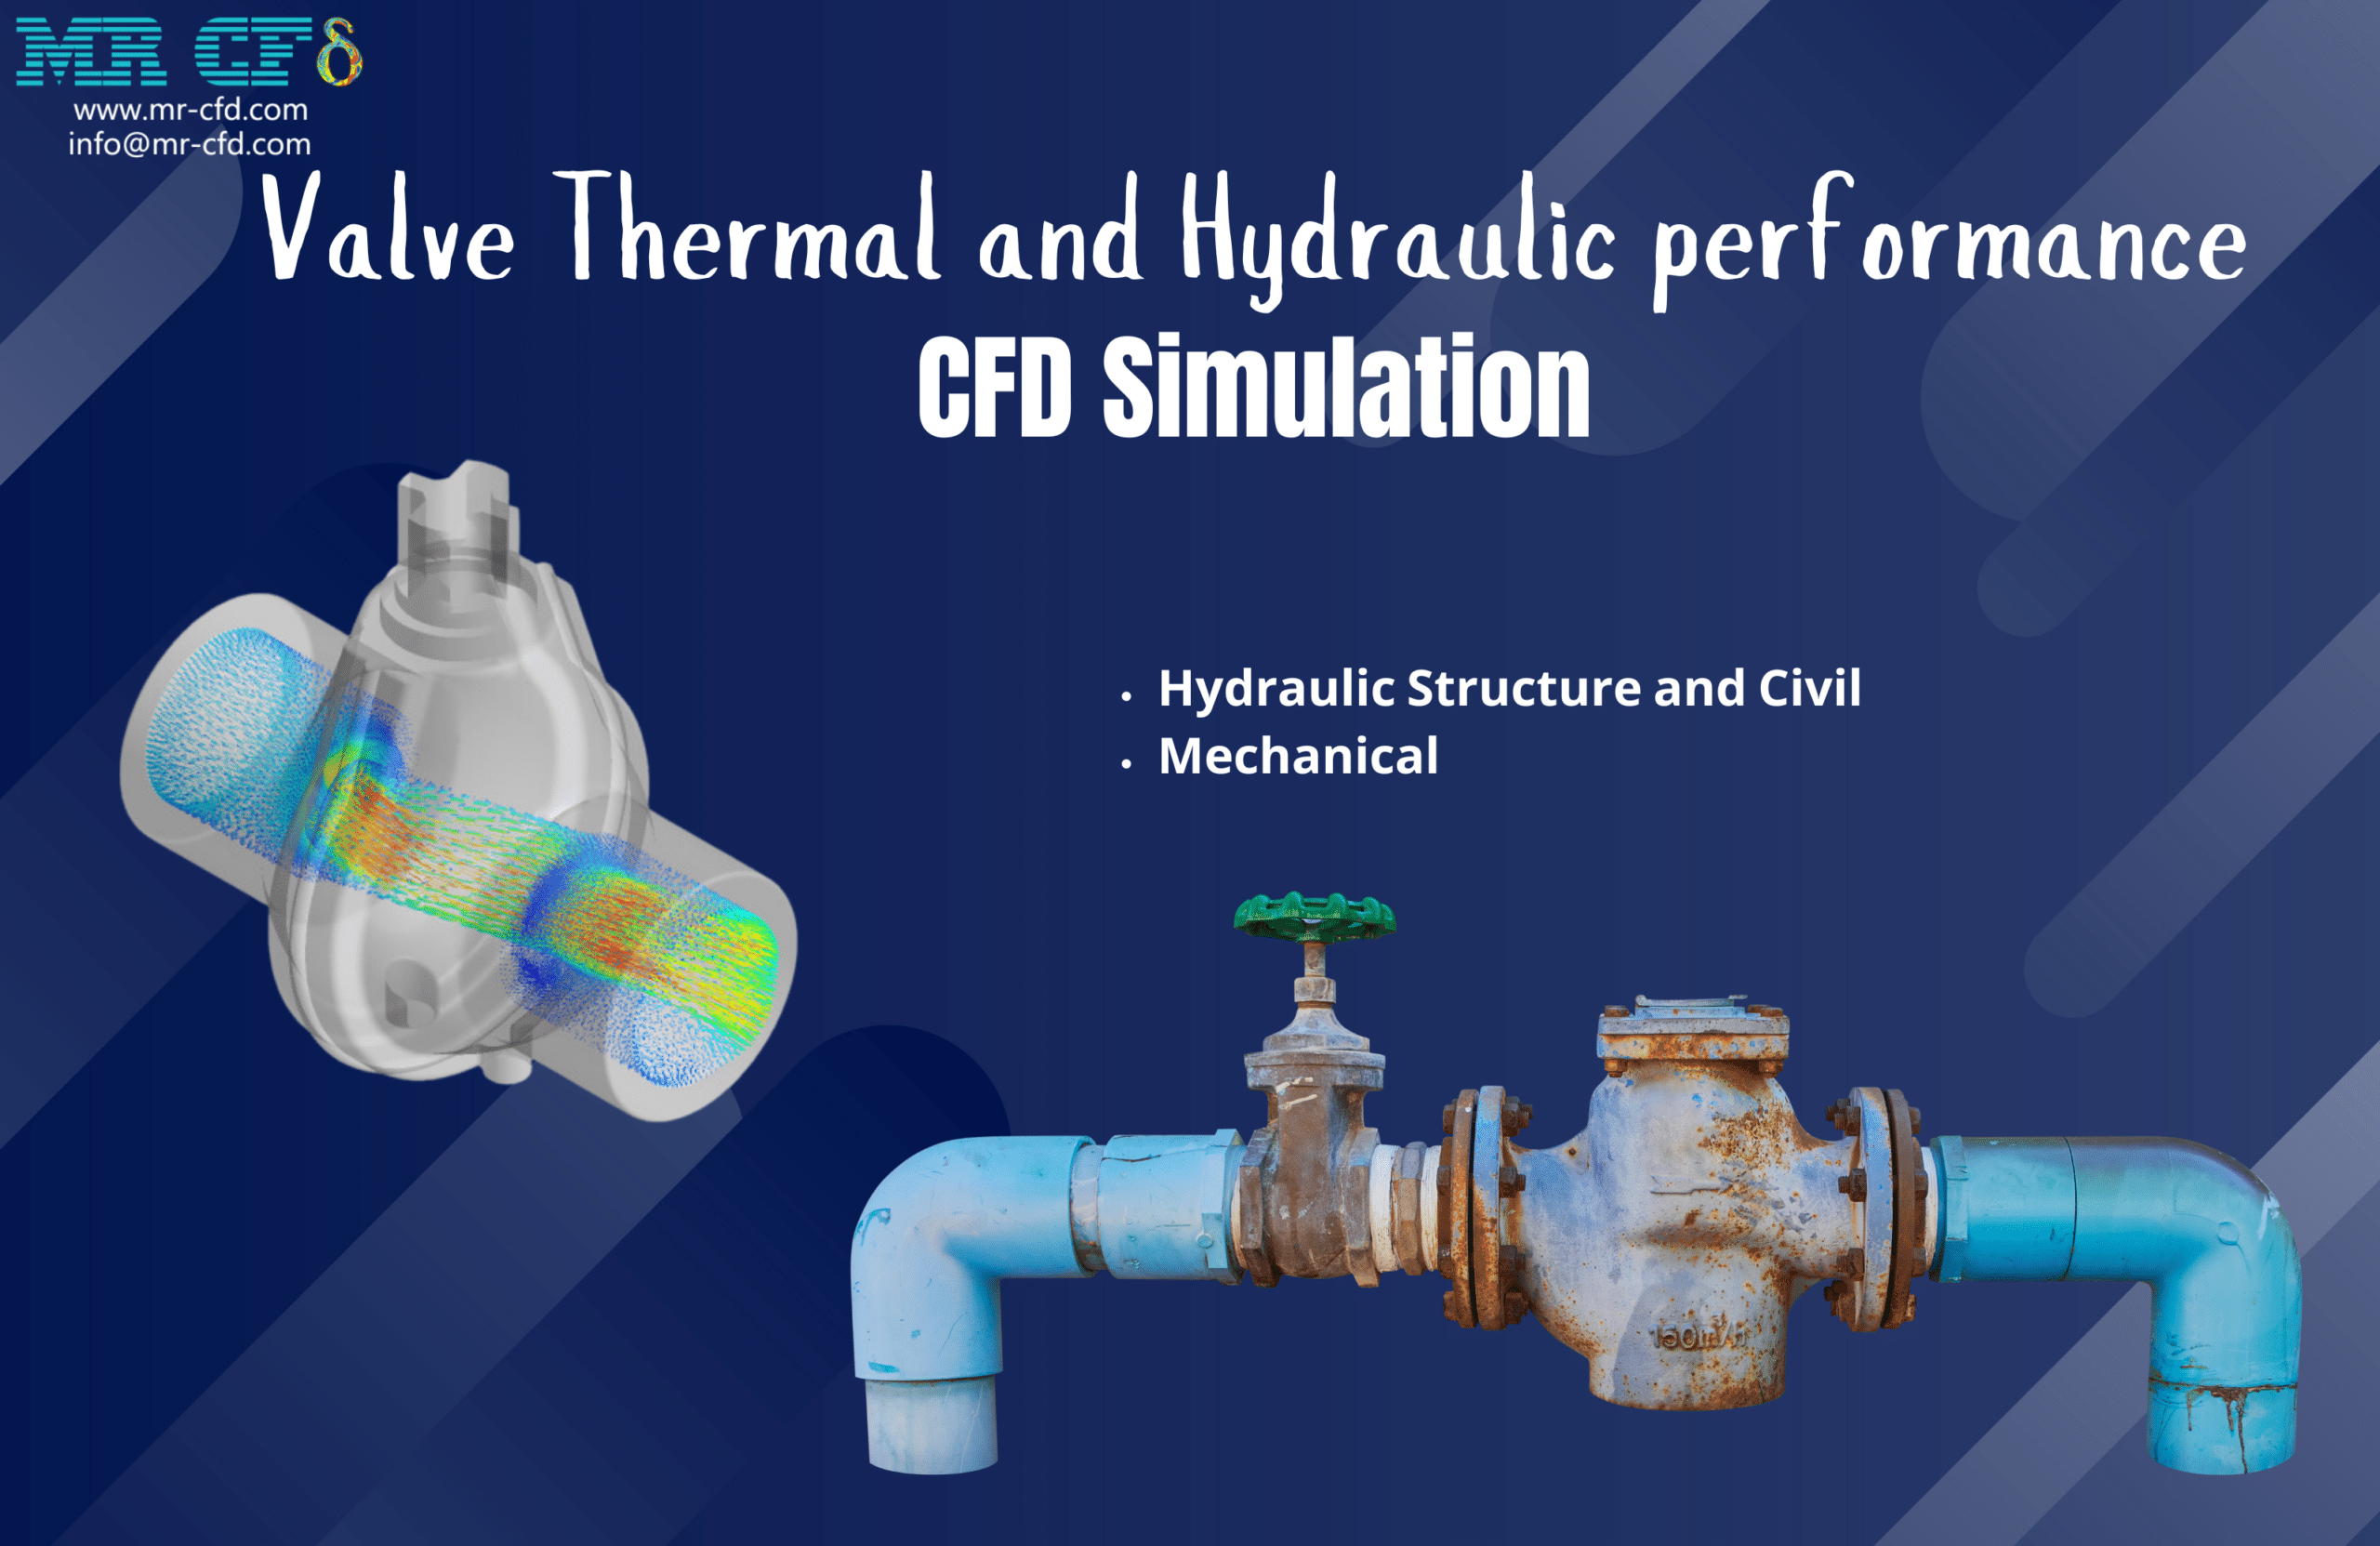
Valve Thermal and Hydraulic performance CFD Simulation
$80.00 $40.00 Student Discount
- This project investigates the steel valve Thermal and Hydraulic performance through CFD analysis in ANSYS Fluent.
- The study focuses on the cooling of hot water (400K) flowing through the valve while exposed to external air convection (300K).
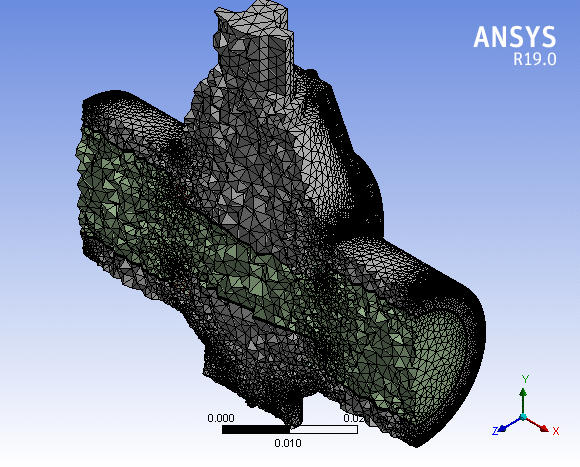
- The geometry was designed in ANSYS Design Modeler and meshed using ANSYS Meshing, resulting in a mesh of 2,237,861 elements.
- The simulation uses a pressure-based solver with the RNG k-ε turbulence model and enabled energy equation for steady-state conditions.
- The study demonstrates the impact of valve geometry on flow patterns, pressure distribution, and temperature gradients, providing insights into heat transfer and cooling efficiency.
To Order Your Project or benefit from a CFD consultation, contact our experts via email (info@mr-cfd.com), online support tab, or WhatsApp at +44 7443 197273.
There are some Free Products to check our service quality.
If you want the training video in another language instead of English, ask it via info@mr-cfd.com after you buy the product.
Description
Valve Thermal and Hydraulic Performance CFD Simulation, ANSYS Fluent Tutorial
Introduction
Valves are crucial components in fluid systems, controlling flow rates, pressures, and directions. This study explores the thermal and fluid dynamic performance of a steel valve exposed to hot water flow internally and cooler air convection externally. The analysis focuses on the heat transfer characteristics and flow behavior within the valve.
The primary objective of this research is to analyze the effects of the valve geometry on the water flow patterns and temperature distribution. By simulating the flow of hot water (400K) through the valve while it’s exposed to cooler ambient air (300K), we aim to understand the cooling process and its impact on the fluid dynamics within the valve. This study provides valuable insights for engineers and designers working on thermal management in valve systems.
The CFD simulation was conducted using ANSYS Fluent software. The geometry was designed in ANSYS Design Modeler and meshed using ANSYS Meshing software, resulting in a high-fidelity mesh of 2,237,861 elements.
Methodology
The simulation employs a pressure-based solver suitable for incompressible flows typically encountered in valve applications.
A steady-state solution approach was adopted to simulate the continuous operation of the valve.
The RNG k-ε turbulence model was used to account for the complex flow patterns within the valve.
The energy equation was enabled to track the temperature distribution and heat transfer within the system.
A heat transfer coefficient of 8 W/m²K was applied to the valve’s outer boundary to simulate convection with the surrounding air.
Results
The CFD simulation reveals significant insights into the thermal and fluid dynamic behavior of the valve:
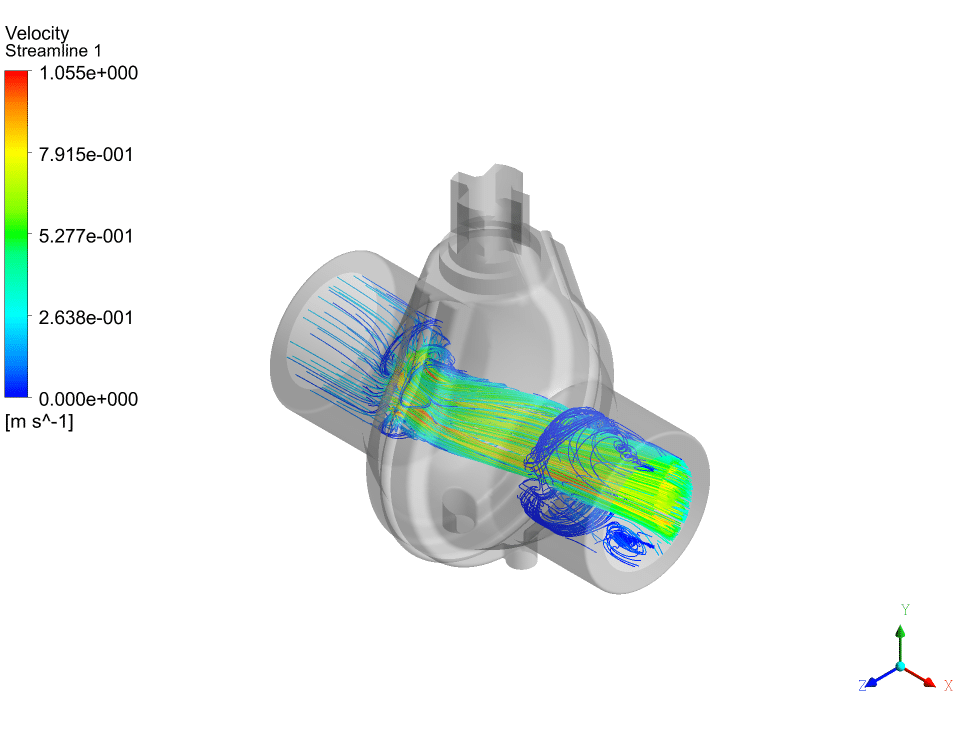
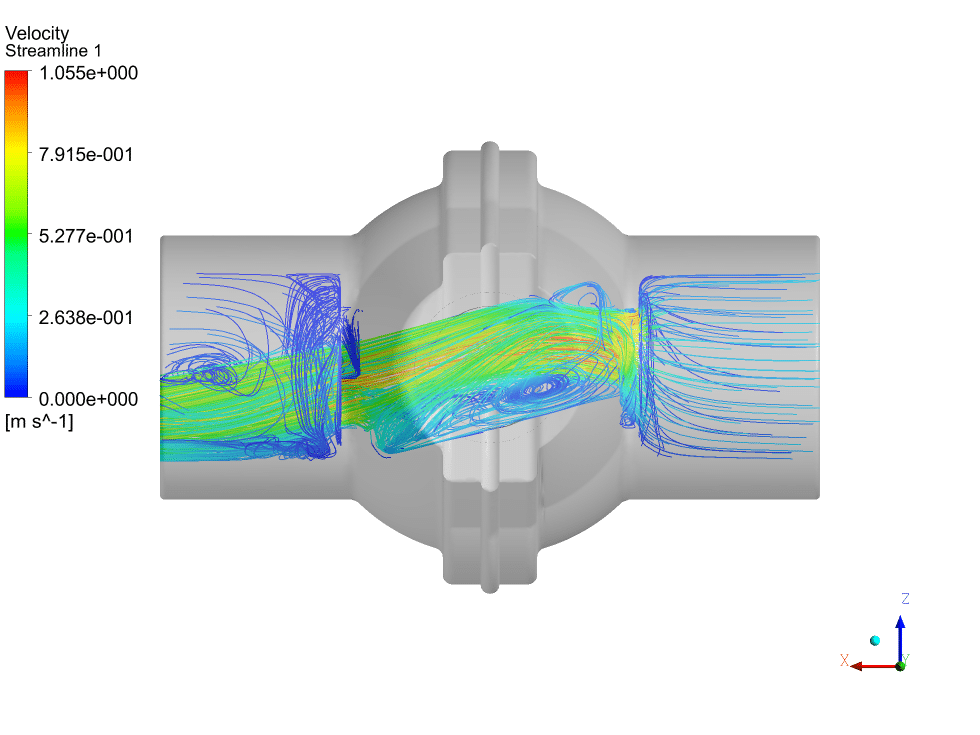
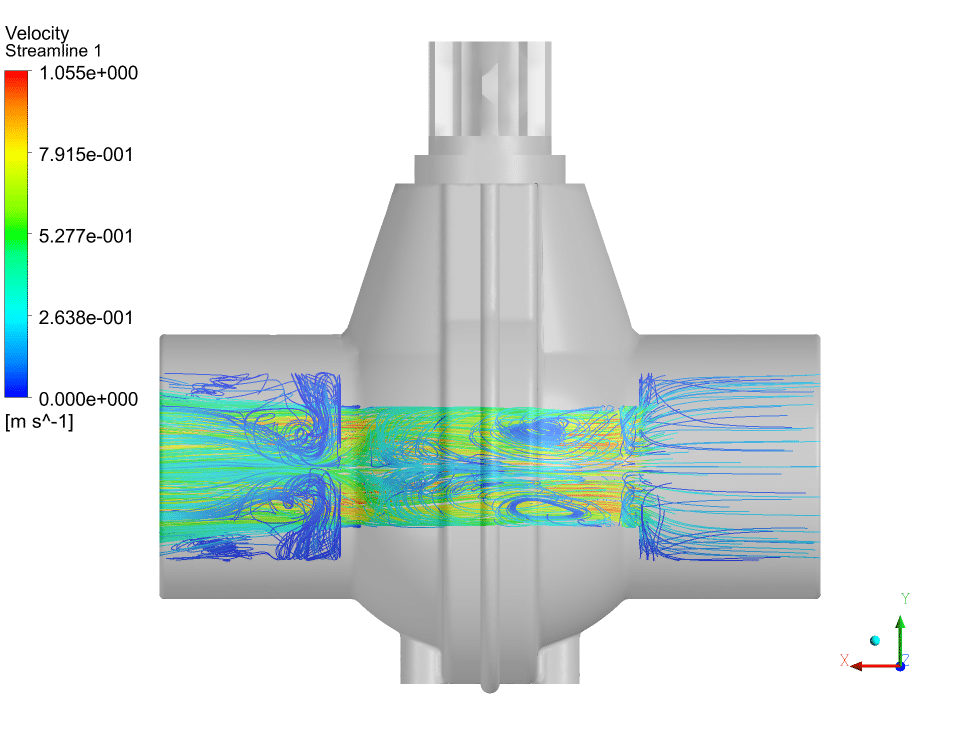
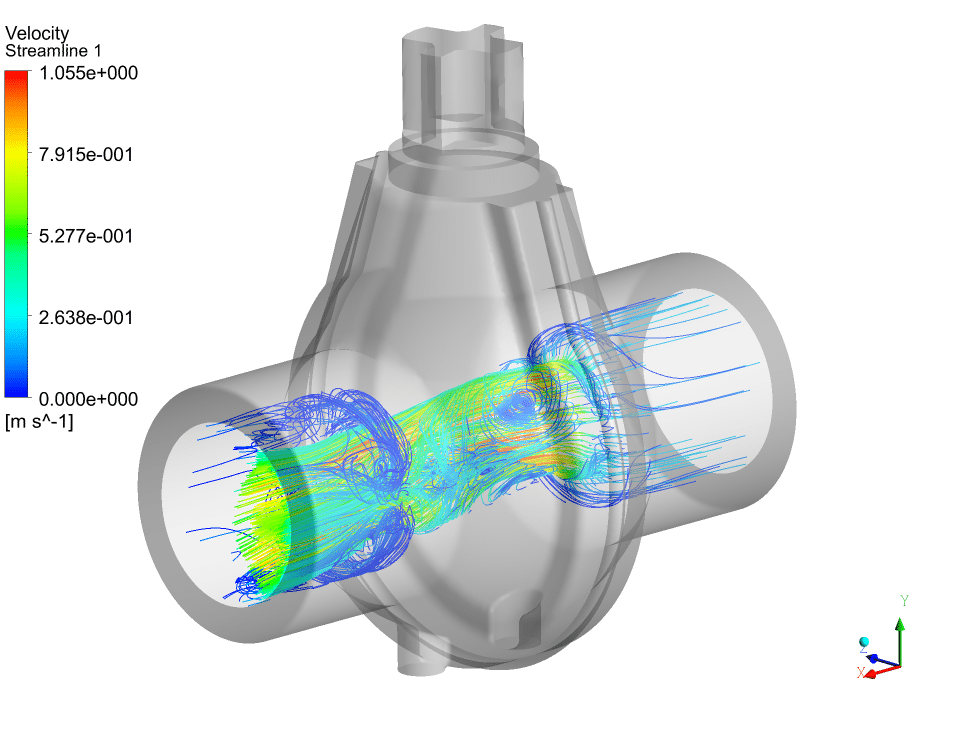
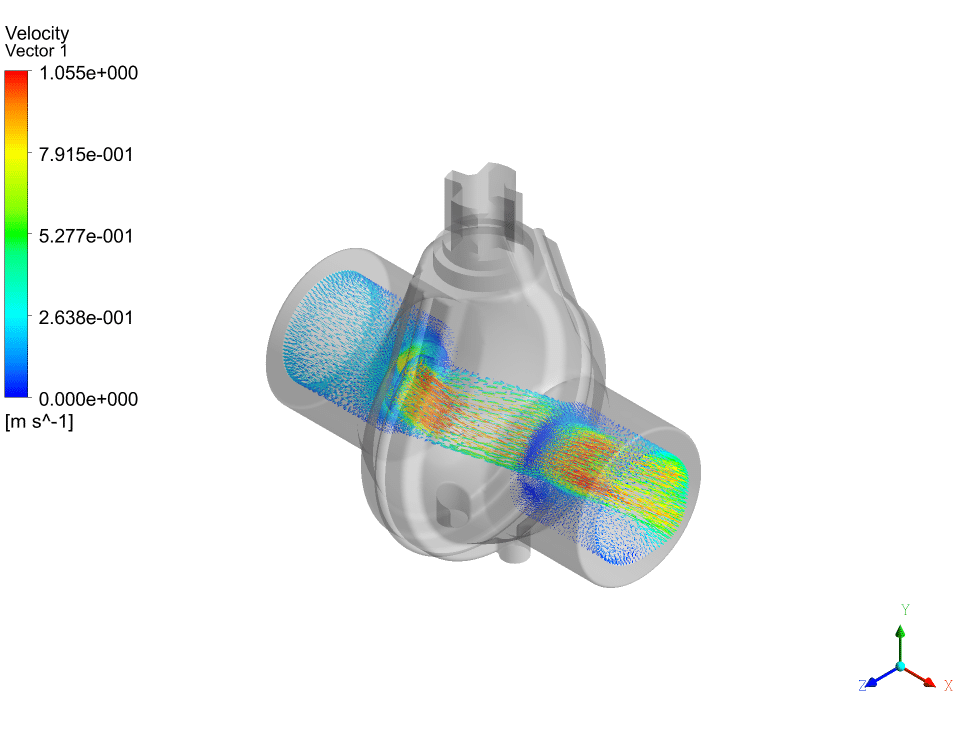
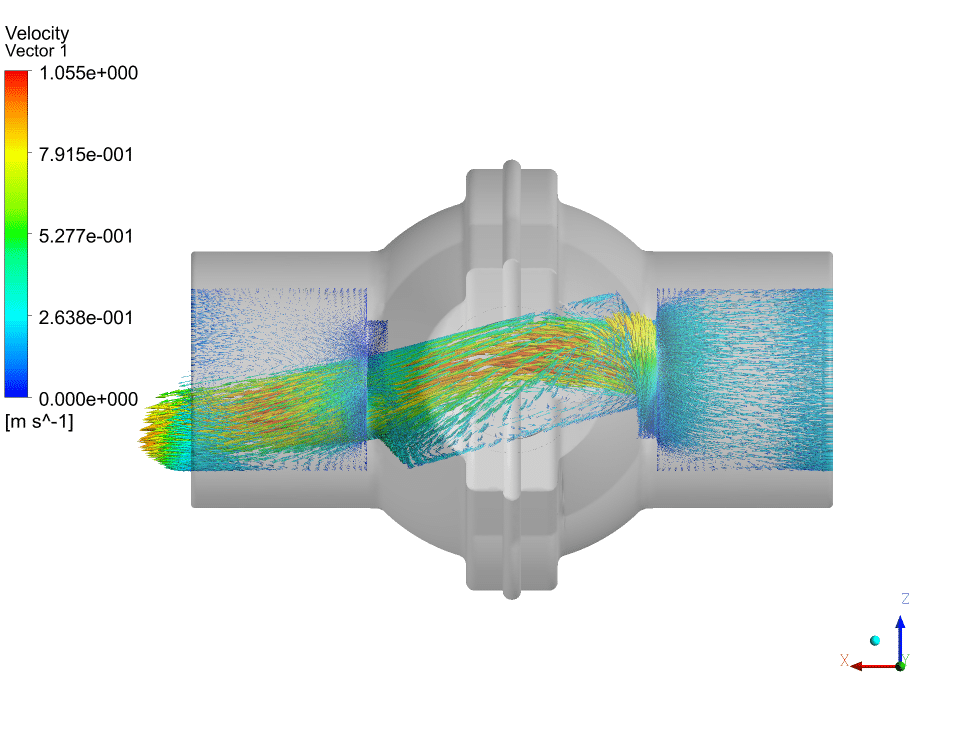
The velocity streamlines show complex flow patterns within the valve. The flow accelerates as it passes through constrictions, reaching velocities up to 1.055 m/s. Recirculation zones are observed in the expansion regions, which could affect heat transfer and potentially cause localized high-temperature areas.
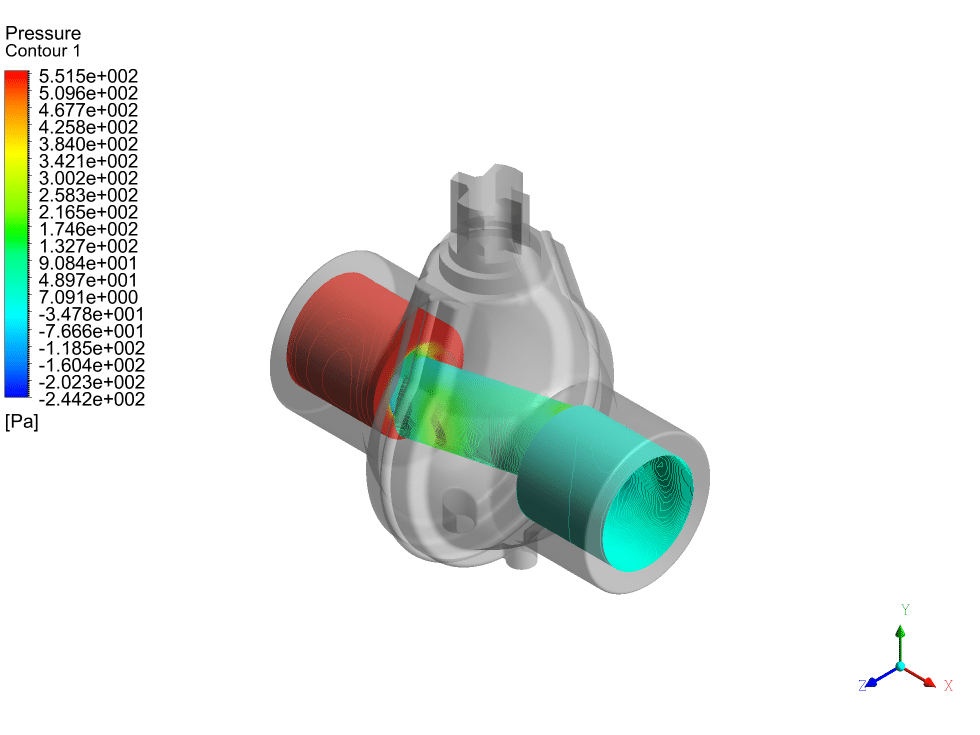
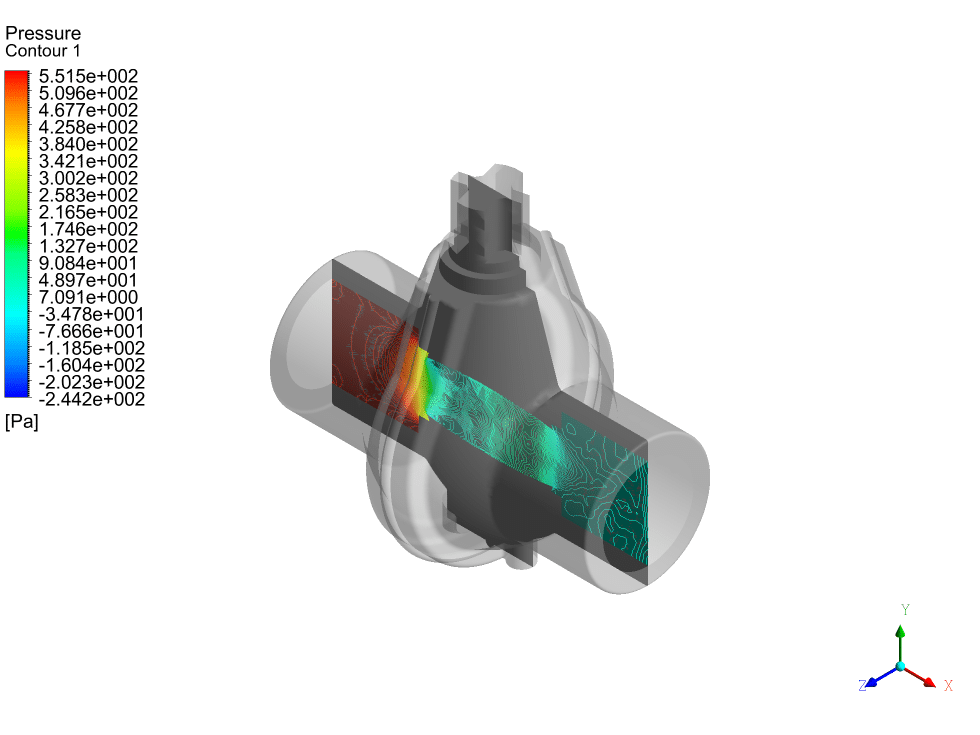
The pressure contours indicate areas of high pressure at the inlet and low pressure at the outlet. The pressure drop across the valve is evident, with values ranging from about 551.5 Pa to -244.2 Pa. This pressure gradient drives the flow through the valve and influences the overall system performance.
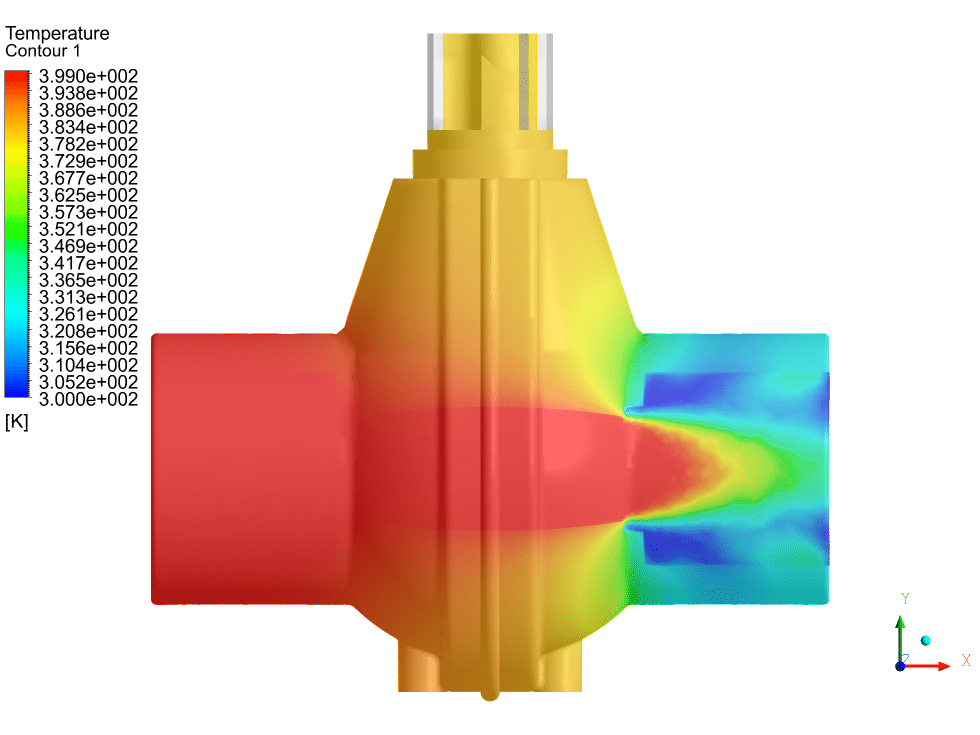
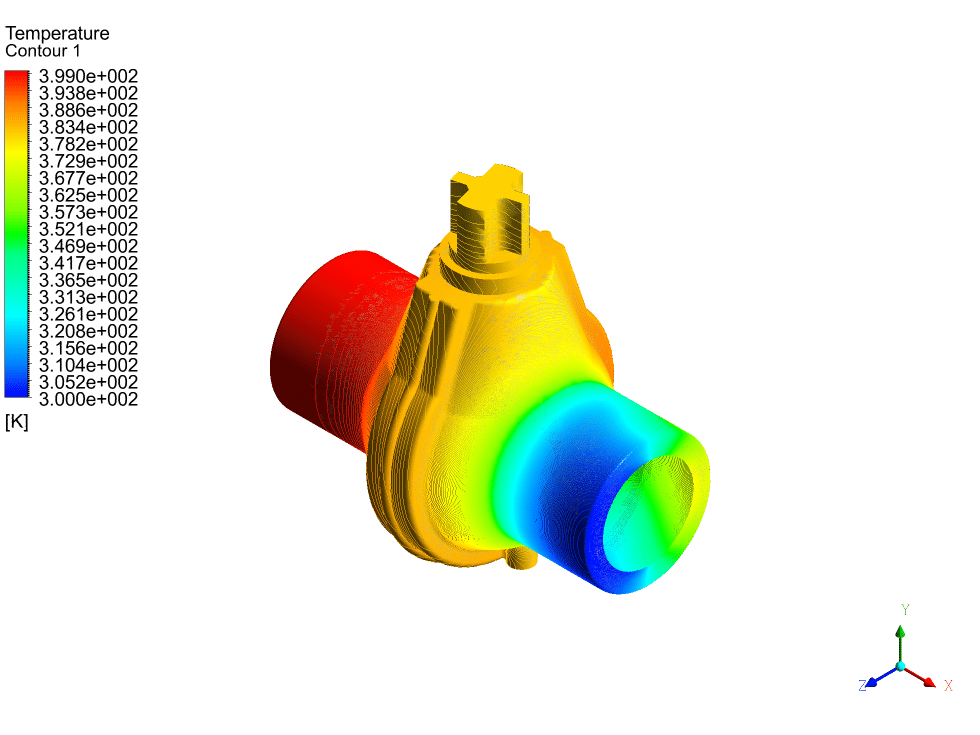
The temperature contours clearly show the cooling effect as the water flows through the valve. The inlet temperature is 400K (red), and the outlet shows cooler temperatures (blue-green), indicating effective heat transfer to the valve body and the surrounding air. The valve body exhibits a temperature gradient, with higher temperatures near the inlet and lower temperatures towards the outlet.
The velocity vector plot provides detailed insight into the flow direction and magnitude within the valve. It highlights areas of high velocity in the central flow path and regions of lower velocity near the walls, which is crucial for understanding the heat transfer mechanisms.
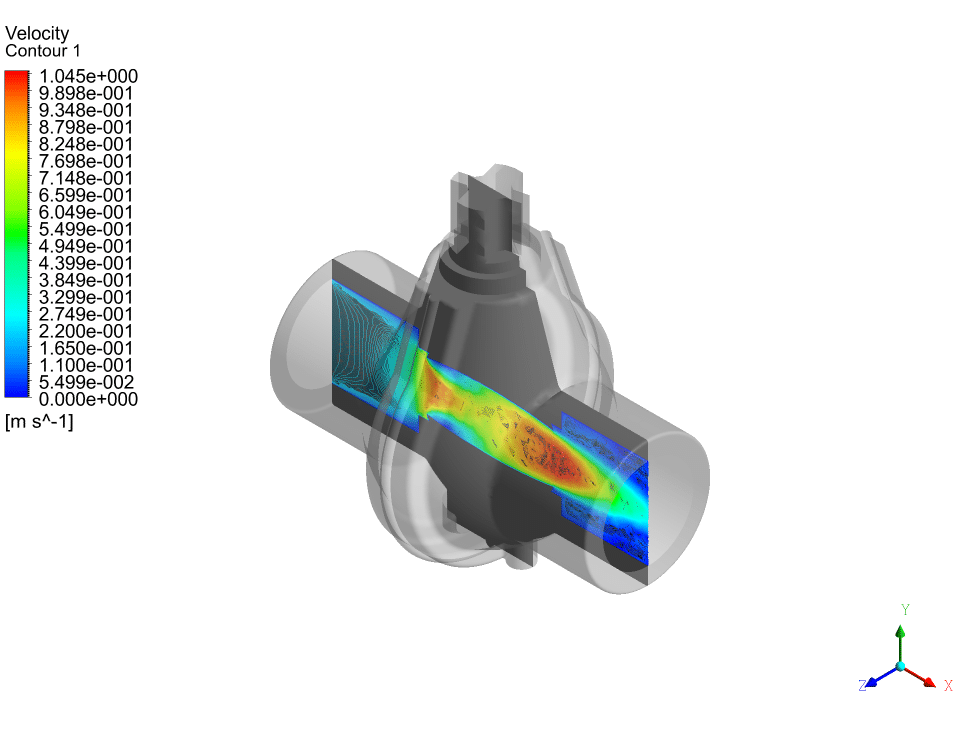
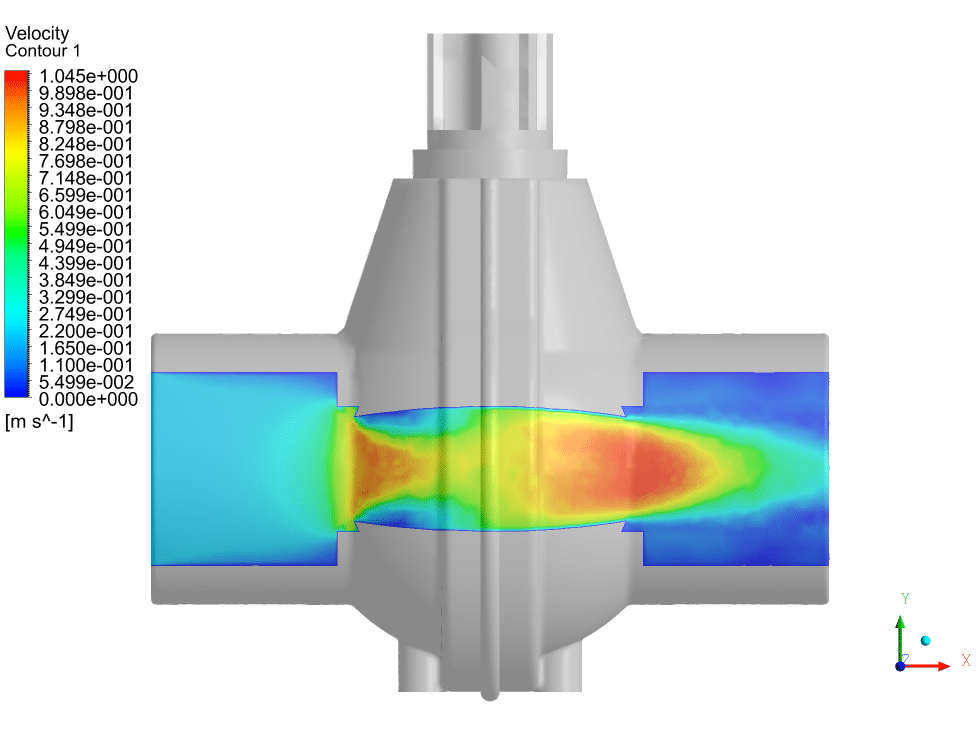
The velocity contour on a cross-section of the valve shows the variation in flow speed throughout the valve. The highest velocities are observed in the narrow passages, while lower velocities are seen in the wider sections and near the walls.
The simulation results demonstrate the complex interplay between fluid flow and heat transfer in the valve. The geometry of the valve significantly influences the flow patterns, creating regions of high and low velocity, which in turn affect the heat transfer characteristics. The cooling of the water as it passes through the valve is evident, with the temperature dropping from 400K at the inlet to lower values at the outlet.




Reviews
There are no reviews yet.